Parts 1 And 2 Can Be Found At:
https://www.ndavidmilder.com/2015/03/some-thoughts-about-studies-of-the-economic-impacts-of-downtown-entertainment-venues-part-1
https://www.ndavidmilder.com/2015/04/part-2-some-thoughts-about-studies-of-the-economic-impacts-of-downtown-entertainment-venues
The numbering of tables, figures and endnotes continues from Part 2.
Introduction
Whereas studies of the economic impacts of formal entertainment venues typically use input-output models to follow the effects of a venue’s expenditures and the relevant spending of its audiences, impact analyses of informal entertainment venues are far less enamored of this research strategy (18). Perhaps this is because they — being entities such as a park, public space, restaurant, bar, etc. — usually have far smaller annual expenditures than the formal venues. For example, the annual expenditures of Bryant Park in NYC and Millennium Park in Chicago are in the $11 million to $13 million range while the expenditures of the Metropolitan Museum of Art and the Art Institute of Chicago are $252 million and $211 million respectively (19). As was demonstrated in an earlier Downtown Curmudgeon article, the same pattern seems to hold true among entertainment venues in smaller communities (20).
Instead, Internet and library searches found that most impact analyses done on informal venues usually pay a lot more attention to how they affect the way nearby real estate properties are valued as measured by their rents, occupancy rates, sale prices, dollars invested to create or improve buildings and/or assessed values. Some of the studies on formal venues, in addition to their I-O analyses, look at impacts on nearby real estate (21).
Entertainment venues can be stimulants for nearby residential, office and hotel development – all interesting potentials for downtowners. Downtowners, of course, also will be interested in the people side of such developments, e.g., the numbers of residents, office workers/creatives, and hotel guests that entertainment venues can help attract and their potential downtown expenditure patterns. On these topics, the impact analyses have been thinner in number, the use of available data and the employment of statistical analyses.
Many impact studies fail to take into consideration the characteristics of the downtown environment in which an entertainment venue is inserted that can influence the range and magnitudes of its impacts.
The use of sophisticated research techniques, such as multiple regression models and, potentially, factor analysis, can provide invaluable insights and cope with the multi-causal situations that should frame most impact analyses. However, the use of far simpler data sources, such as a short survey of the judgements of local experts, can also be of immense value. When developers say that a park or PAC was an important reason why they built projects on nearby properties or a landlord reports that the redevelopment of a park led to higher occupancy and rents, these are not trivial pieces of evidence to be ignored. An analysis that combines both approaches promises even more reliable findings.
The types of questions that downtowners might ask about their entertainment venues’ impacts, especially the degree to which they are quantified, should inform what kind of research is needed. For example, it is one thing to want to know if a venue has had a meaningful positive impact on the nearby area; it is quite another to want to have precise data about the value in dollars of those impacts and how they compared to other causal factors.
Even a partially knowledgeable observer of the changes that occurred in the areas close to Bryant Park, Millennium Park, the High Line, Division Street Plaza, Lincoln Center, Campus Martius Park, or Discovery Green probably feels ,with considerable certainty, that these venues have had significant positive impacts on their neighborhoods. Such “knowledge” maybe imprecise, but in many ways it still can be very useful for a significant number of policy and program development purposes.
Any decent student of the social sciences knows that in our fields, there is very little that can be explained by a single silver bullet causal factor. Meaningful explanations of social science phenomena are far more likely to utilize several causal factors. Too many of the advocacy motivated impact studies are too simplistic because of their total focus on their client organization or project. When a downtown PAC, museum or public space is highly lauded because it can increase the value of nearby properties, it is easy for leaders in other downtowns, who are eagerly looking for best practices to follow, to forget that most of the value is probably accounted for by other factors that they also must learn how to use and mobilize.
Because an entertainment venue helps attract nearby real estate projects that have $Xs of investment does not mean that its economic impact equals $Xs. The impacting factors on site selection and acquisition are quite distinct from those that determine how much money needs to be invested in a building on that site. Location also factors in again in the determination of a building’s rents and appraised value. Consequently, entertainment venues can have impressive impacts on the rents and values of adjacent buildings.
Downtown leaders should be very cautious about the lessons they learn from these impact studies. The “transferability” of a project concept from one downtown to another is usually far more difficult than the success stories painted by these studies might suggest. Impact studies, especially those that are advocacy oriented, are unlikely to detail what those difficulties might be.
Variation in Approaches
All of the studies of the impacts on real estate value use a comparison of some kind in order to prove their case, but they differ in how this is done. In many instances, the causal connection is established simply by a comparison of some measures of real estate value (e.g., rents, assessed values, occupancy rates, etc.) “before and after” the creation of the venue or its substantial improvement. This approach can be both simple and powerful as demonstrated in a previous article in this series by Beth Anne Macdonald, who used before and after occupancy rates and investment levels to effectively demonstrate the positive impacts of Division Street Plaza on proximate properties in downtown Somerville, NJ (22).
Hedonic impact studies use geographic distance from the entertainment venue as an indicator variable – if properties increase in value with their proximity to the venue, then the venue’s positive impact is established (23). However, the venue itself is not in any way directly measured. Its attractiveness in the eyes of landlords, homeowners and renters and their willingness to pay more to be closer to it are hypothesized to be the factors that explain why real estate values would increase with proximity to the venue, but they are not directly measured. The venue acts as a positive, given factor in such analyses, not a true variable. The related variation is in the variable measuring the properties’ distances from the venue.
Another approach, traditional in the real estate industry, is to find a “comparable” that is intended to function as a kind of experimental control. That involves finding an area similar to the one surrounding the venue being studied except that it lacks a similar entertainment venue, and then comparing how the two areas score on the measures of real estate value selected by the analysts. In the impact area the venue exists; in the comparable area there is nothing like it.
Each of these approaches has its analytical advantages and limitations. A before and after analysis has some possible causal attribution problems. For example, how can the entertainment venue demonstrate that its purported impacts are not the result of other causal factors that also produced similar outcomes elsewhere in the downtown? Furthermore, the way that the entertainment venue exerts its positive influence may be increasingly shifting from producing new and increased real estate values to maintaining them at a desired level. Establishing a 95% or 100% occupancy rate leaves little or no potential upside, though helping to keep occupancy at that level can be quite an achievement. Also, what if the continued rise in adjacent real estate values is the result of people acquiring a greater desire for using such venues, not because of any improvements done to it? Does the causal impetus then still reside with the entertainment venue or with the external force(s) that favorably altered people’s evaluation of it?
Finding a truly comparable area can be far more difficult than it might sound. Which variables will be used to establish the comparability? What scores on the measures of those variables will be the comparability thresholds? Automatically, a questionable comparable area severely weakens the credibility of the analysis in which it is employed. Conversely, a credible comparable area can commensurately strengthen an impact study.
The hedonic studies are often difficult to do and are vested in a conjecture laden theoretical framework. On the other hand, they can be very powerful analytically.
None of the real estate value impact analyses reviewed for this article used measures of how the venue performs, such as attendance, revenues or number of events/performances as an impacting variable. None has used statistical data reduction techniques, such as factor analysis, that can take a number of indicator variables to create a way to score/scale a venue’s success and/or magnetism at different points in time.
Usually, it simply is the overall positive character of a venue that is treated as the impacting factor. It functions much like a switch variable – it’s either on or off. Positive impacts can only be produced by viable and successful venues, so they are the only ones usually looked at.
Not All Impacts Are Positive
It is important to remember that the economic impacts of entertainment venues on real estate can be either positive or negative – depending on the individual venue’s performance — and that the impacts will be stronger the closer the properties are to the impacting venue. These negative impacts can also be very visible. It all happens in the same neighborhood arena, whether the impacts are positive or negative, with the same causal paths probably being involved.
If Bryant Park, today, can be called a model informal entertainment venue, it should not be forgotten that in the 1970s and early 1980s it was the poster child for a badly failed, strategically located public space. Riddled with criminal activities, it induced pedestrians to walk on the other side of the street or to completely avoid the vicinity of the park. It also made leasing nearby commercial spaces extremely difficult and suppressed rents and property values. Its public reputation bordered on being infamous and the yellow press feasted upon it.

Figure 2. A long vacant downtown movie theater
Formal entertainment venues also can fail as businesses and fall into states of physical disrepair, even overt decay. For example, failed and rotting downtown theaters and movie houses, such as the one shown in Figure 2, have not been uncommon sights over past decades. Their most devastating negative impacts were on proximate properties. Their renovation or repurposing often has been expensive and taken many years to accomplish.
In Silicon Valley, entrepreneurial failures are treated as important learning experiences and badges of honor. In the economic development field, failures are completely disdained and overwhelmingly ignored. Because impact studies have become so entwined with advocacy, economic development impact analyses seldom look at failures. One might wonder what we are not learning as a consequence.
Strong Venues Can Mobilize the Neighborhood as an Impacting Agent — for Good or Ill
The impacts of entertainment venues can have both direct and indirect paths to nearby properties. Together they can constitute what might be called the neighborhood’s impact. Prevailing rents, for example, are a good measure of this neighborhood effect.

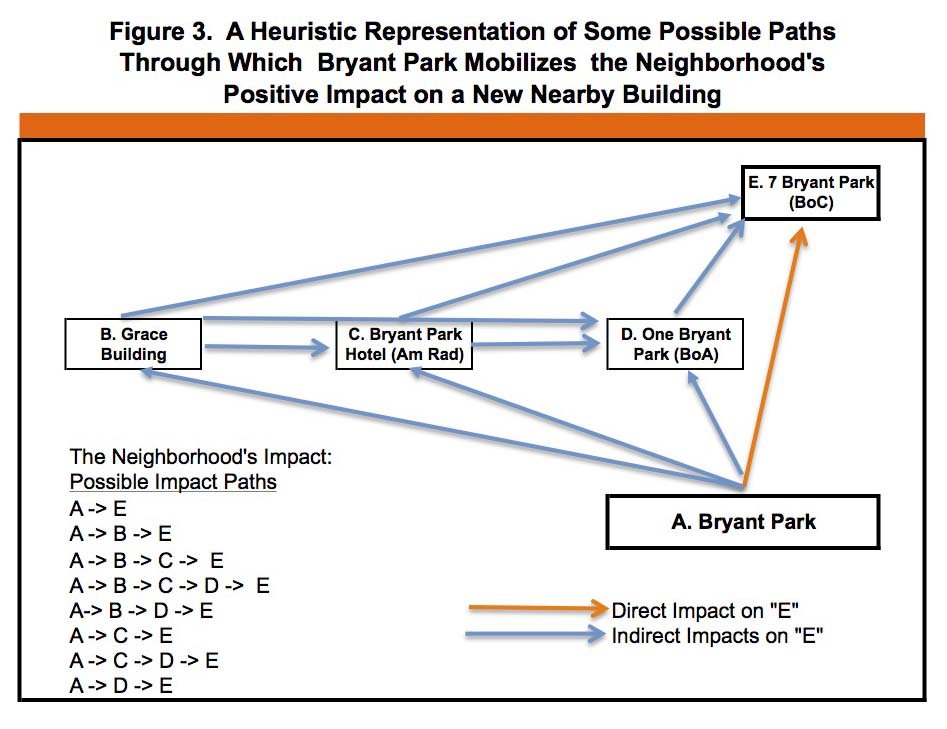
For example, there are about 26 buildings surrounding Bryant Park. For the purposes of brevity and manageability, only four will be cited in the following discussion – otherwise Figure 3 would be a mess and rather undecipherable.
The resurgence of Bryant Park helped the Grace Building increase its rents and occupancy rates. Later on, the park influenced the conversion of an office building into the Bryant Park Hotel. After that the Durst Organization capitalized on the park’s image and popularity to attract Bank of America as its anchor tenant for One Bryant Park, a large new office building. The importance of the park to the new building being developed by Hines is reflected by its address: 7 Bryant Park. The park has had – and continues to have – direct and positive influences on the desirability of these building for investors, developers, landlords and tenants.
As can be seen in Figure 3, Bryant Park probably was only one among many local agents impacting directly and positively on the Hines development project. The other buildings that the park is helping also have had their own direct impacts. It is not only Bryant Park, but, in a very real sense, the whole immediate neighborhood, e.g., the park and the 25 other buildings, that are having a positive impact on the Hines project. Part of their impact will be due to their own individual attributes, the remainder will be due to causal influences they are passing along from the park and other nearby buildings.
As Figure 3 also demonstrates, Bryant Park does not have just one causal path, its direct one A–>E, for influencing the Hines project. It also can work its influence along seven additional indirect causal paths through just the three impacting buildings displayed in Figure 3. For example: A–>C–>E. Suffice it to say, that taking the other 20+ buildings into consideration would produce many more causal paths through which the park can exert its influence, In this sense, the park is truly the neighborhood’s foundation stone. Question: as the neighborhood flourishes, do the impacts of Bryant Park shift from mainly flowing through direct paths to following mostly indirect paths?
This line of reasoning suggests that an entertainment venue’s potential level of indirect real estate impacts will often be influenced by the strengths of the adjacent buildings. Positive indirect impacts are far less likely when these buildings are unattractive or relatively small. On the other hand, once a sufficient bolus of acceptably attractive adjacent buildings has been achieved, indirect positive impacts can snowball.
The same kind of network of causal pathways very probably existed during Bryant Park’s troubled past and it helps explain why the park’s negative impacts were so pervasively felt and difficult to fix. That point is a good reminder that failing to keep important downtown entertainment venues popular and in good operating condition can have waves of unwanted repercussions.
The Proximate (Hedonic) Principle of Real Estate Value
Residential Impacts. There is a long standing consensus among real estate experts that the closer residential properties are to parks, the more likely they are to be impacted – positively or negatively – by it. These venues can create or destroy values on nearby properties. This impact carried through “nearby-ness” is called by some proximate value and hedonic value by economists. Proximate or hedonic value is determined mostly by a property’s distance from the venue combined with the quality and magnetism of the venue itself (24).
That parks can generate higher residential property values has been known and leveraged in England since the early 19th Century, as pointed out by John L. Crompton, who has written extensively about the “proximate principle.” Crompton cites this statement made in 1856 to show how the then New York City Comptroller believed that Central Park would be financially supported through the increased real estate values it would create:
“…(T)he increase in taxes by reason of the enhancement of values attributable to the park would afford more than sufficient means for the interest incurred for its purchase and improvement without any increase in the general rate of taxation” (25).
Crompton also details how Frederick Law Olmsted assembled data on Central Park’s impacts on abutting property values and how that data, wrapped into a package with the proximate principle, became conventional wisdom nationally among urban planners. In turn, it was soon used to stimulate park development in many other major cities across the nation (26).
Americans like living close to parks. For example, a 2001 survey by the National Association of Realtors revealed that 57 percent of voters would choose a home close to parks and open space over one that was not (27).
Not surprising, then, that over 30 studies have found parks have a positive impact on nearby property values (28).
1. Impact Magnitudes and the Reach of Impact Areas. In “The Payoff from Parks,” Howard Kozloff cites, from various sources, a number of recent projects that demonstrate how strongly parks can create significant values for the residential properties that are adjacent to them:
- In NYC, apartment prices, by 2011, in one building bordering the new and extremely popular High Line Park , had doubled since the park opened
- For apartments facing NYC’s Central Park, the premium for the typical apartment sale was, “ ‘more than double that for apartments in surrounding neighborhoods’ ”
- In Dallas, a luxury residential building could be successfully developed next to a submerged expressway, because the Klyde Warren Park was built as a deck over the Woodall Rodgers Freeway
- “New Town St. Charles in suburban St. Louis: “Land premiums for lots fronting canals are roughly 50 percent”
- “Upper Albany, Columbus, Ohio: Homes fronting the village green garner 25 percent premiums”
- “ Clayton, Missouri: Office properties in the business district fronting Shaw Park ‘achieve the highest lease rates in the St. Louis region, and operate at high occupancies.’” (29).
In addition, the 2011 impact study of downtown Chicago’s Millennium Park found that:
- “Rents in apartment buildings adjacent to the park increased 22.4% since the park opened in 2004” (30)
- “Since the park opened, over 4,800 apartment and condo units have been completed, resulting in a population increase of 71%. The development of new units was comprised of 64% of units being new construction and 36% being adaptive reuse of class B and C office space” (31)
- “Millennium Park clearly adds value to residential real estate with views of the property. Though there are many variables which factor into the sales price of condo units, it is clear that an excess of $125 per square foot premium is paid for units with a park view. This further illustrates people’s desire to live close to parks and other activities.” Millennium Park has added real estate value to the surrounding area.” (32).
Also, in Atlanta, GA, prices at an adjacent condominium increased from $115/PSF to $250/PSF after Centennial Olympic Park was built (33).
To provide an indication of the magnitude of the impact that the proximate principle can provide and the extent of its impact areas, Crompton cites a study of 14 neighborhood parks in suburban areas of the Dallas-Fort Worth metropolitan area. These parks were under 7.4 acres in size and unquestionably average in their features and maintenance. The study found that:
“Homes adjacent to parks received an approximate price premium of 22% relative to properties a half-mile away. Approximately, 75% of the value associated with parks occurred within 600 feet of a park and 85% within 800 feet. This distance approximates a two to three minute walk and delineated the parks’ principal areas of influence. The price effects of the parks were insignificant at a distance of approximately 1,300 feet (a quarter mile), the conventional estimate of a 5 minute walk” (34).
Peter Harnick and Ben Welle, based on their review of 30 studies, found that:
- “While proximate value (“nearby-ness”) can be measured up to 2,000 feet from a large park, most of the value is within the first 500 feet”
- “The preponderance of studies has revealed that excellent parks tend to add 15 percent to the value of a proximate dwelling.” (It is perhaps a good idea to keep in mind that other factors, primarily related to a dwelling’s characteristics, that account for 85% of its value.)
- “(P)roblematic parks can subtract 5 percent of home value” (35).
Given the unexceptional character of the 14 parks cited by Crompton and the importance Harnik and Welle ascribe to park quality as a determinant of proximate value, one may wonder if parks with far better features and greater magnetism, such as Bryant Park, Millennium Park, Balboa Park, Boston Common or Central Park might have somewhat larger impact areas –though their impacts still would ebb as their distances to properties increased. The data cited above would seem to indicate that Central Park, The High Line and Millennium Park probably account for significantly more than 15% of the value of their proximate properties. But, do their greater impacts also have a wider geographic reach? If so, then what does their curve of diminishing impact over distance look like?
That entertainment venues might have impacts beyond a half mile is partially supported by research conducted by C3D’s Stephen Sheppard on a different type of entertainment venue, the Kenosha Public Museum, in Kenosha WI. A close look at a map provided in that study of the museum’s impacts on residential real estate values strongly suggests that the museum’s primary impact area, where it increased property values 21% to 36%, extended out at least about one mile (36).
An earlier study by a Sheppard led C3D team of MASS MoCA’s impacts on residential property values in North Adams, MA found that the properties nearest to MASS MoCA increased in value by about 24%, or $11,728 in 2004 constant dollars. A positive impact was found out to about one mile from the museum (37).
From Figure 1 in that report, it appears that at about one kilometer (3,280 ft), the increase in value had probably fallen to about $3,518 or 30% of the increased value of the properties nearest to the museum. The MASS MoCA report also found that “Property value increases of the sort identified here, while significant in aggregate, are modest in percentage terms. They average less than 5% of total property values…” (38). These findings suggest that while museums may have larger impact areas than parks, with increasing distance the magnitude of impact quickly becomes much shallower.
A lot of a park’s/public space’s real estate impact probably works through a number of factors on which proximity would be very critical to the strength of their influence:
- The venue’s ability to be seen from the impacted property
- The frequency the venue is used by people living or working on that property
- The time it takes to walk from the property to the venue.
A new luxury 82 story residential tower is being built next door to NYC’s MoMA and the museum’s exhibition space will extend into the tower’s lower floors. It is interesting that the developer’s marketing strategy for the most expensive units — located above the 48th floor — uses the unobstructed views of Central Park (about 1,250 ft to the north) available at those heights as its pivotal asset (39). The developer is expecting these far from adjacent views of Central Park to generate a lot of sales value. This example suggests that the configuration of a park’s view shed may be the most critical factor determining how a park’s impact declines over distance as well as the park impact area’s geographic reach.
Museums and PACs are used by their patrons less frequently and in different ways than parks. For example, they may be less likely to be “consumed” by being viewed from across the street out of an office or apartment window. Their uses usually are far more passive than park uses. Do these differences structure their areas of impact in different ways than parks’ impact areas are structured? Do different types of entertainment venues differ in the magnitudes of their most proximate impacts and the geographic reach of their impact areas? Do they also have different rates for their impacts diminishing over distance? The answers to these questions are critically important to the proper selection of study area boundaries for the analysis of any entertainment venue’s impacts – especially in downtowns and large neighborhood commercial districts.
2. The Multi-Causality Problem. One might also hypothesize that on the downtown or neighborhood level, there is a distinct probability that other strong impacting factors are present and that the impact of the entertainment venue cannot be properly analyzed in isolation. Also, as the distance from the entertainment venue increases, and the influence of nearby-ness ebbs, it is likely that the importance of other impacting factors also will increase. Analytical issues related to multiple impacters consequently are likely to become increasingly important as the size of the designated impact area increases. Yet, too often in the analyses of the impacts of entertainment venues on real estate values, the presence of multiple causal factors is overlooked or ignored.
One reason may be that impact studies are usually done to support the advocacy efforts of a particular entertainment venue and its management organization may not want too much discussion of other positive causal factors.
Another probable reason is that paying attention to multiple causes with methodological rigor requires sophisticated analytical skills, easy access to a lot of data and adequate funding. Sheppard’s study of the Kenosha Public Museum is methodologically sophisticated. One of its virtues is that his multiple regression statistical technique is able to “ isolate the contribution (if any) of the presence of cultural organizations to house values from the dozens of other factors that influence them” (40). He laments the paucity of such studies on arts and cultural institutions and offers as one reason the fact that “the techniques required to carry out the analysis will almost certainly be beyond the capabilities of all but the very largest organizations or public arts agencies” (41).
Even in impact studies that try to avoid overtly overstating the impact of the subject entertainment venue, the failure to focus adequate attention on other causal factors can lead to implicit overstatements. When only one cause is discussed it is easy to leave the impression that it is either the most important one or the only one. A good example of this is the study done in 2004 on Lincoln Center, and downtowners can learn a lot from it (42). The study notes – and few, if any, other knowledgeable observers would deny — that:
“Fewer and fewer people in New York City remember what the Upper West Side of Manhattan was like prior to the building of Lincoln Center. The old tenement buildings are long forgotten by the vast majority of current residents and businesses, as well as most visitors. Instead, the visitor to the Lincoln Square neighborhood today finds a vibrant and diverse residential and commercial community that continues to evolve” (43).
It then goes on to concur with a prior study’s conclusion that Lincoln Center played a “key role” in the development of this vibrant community.
The analysis provides data to show that:
- The number of housing units in this neighborhood increased by 19.4% between 1960 and 2000, higher than Manhattan’s 9.7% or NYC’s 16.1% (44)
- The number of households in this neighborhood increased by 16.8% between 1960 and 2000, higher than Manhattan’s 6.2% or NYC’s 13.9% (45)
- “(T)he assessed value of taxable property in Lincoln Square has grown 2,608% since 1962, while the average for all of Manhattan was 447% over that same time period” (46).
- “Throughout the 1980s and 1990s, the neighborhood attracted large investments in retail and commercial ventures. Most observers would agree that Lincoln Center has acted as both an anchor and a catalyst for these developments” (47).
The study focused on the Lincoln Square neighborhood that is “bounded by 58th Street on the South, 72nd Street on the North, Central Park on the East, and the Hudson River on the West” (48). While these may be this neighborhood’s boundaries, there is no evidence presented to prove that they coincide with Lincoln Center’s impact area.
As the crow flies, Lincoln Center is about 2,000 feet away from the neighborhood’s most northeastern corner at 72nd Street and Central Park West and about 2,440 feet of its most northwestern point near 72nd Street and the Hudson River (49). Central Park is about 840 feet due east and the Hudson River is about 2,200 feet due west from Lincoln Center. This is not a small study area.
Two of the study area’s boundaries very probably were, in their own rights, very strong impacting factors on local real estate values, population growth and household growth . Since its inception in 1980, the Central Park Conservancy has led an impressive overhaul of the park that has greatly increased its attractiveness and usage. As the data cited by Kozloff indicates, Central Park can have very strong positive impacts on nearby apartment prices. The appeal of the upscale residential buildings along Central Park West never significantly weakened and they include some of the most prestigious in the city, e.g. the Dakota. More recently, the city’s first “billionaire’s building” was developed at 15 Central Park West, where asking prices have reached $12,200+ PSF (50).
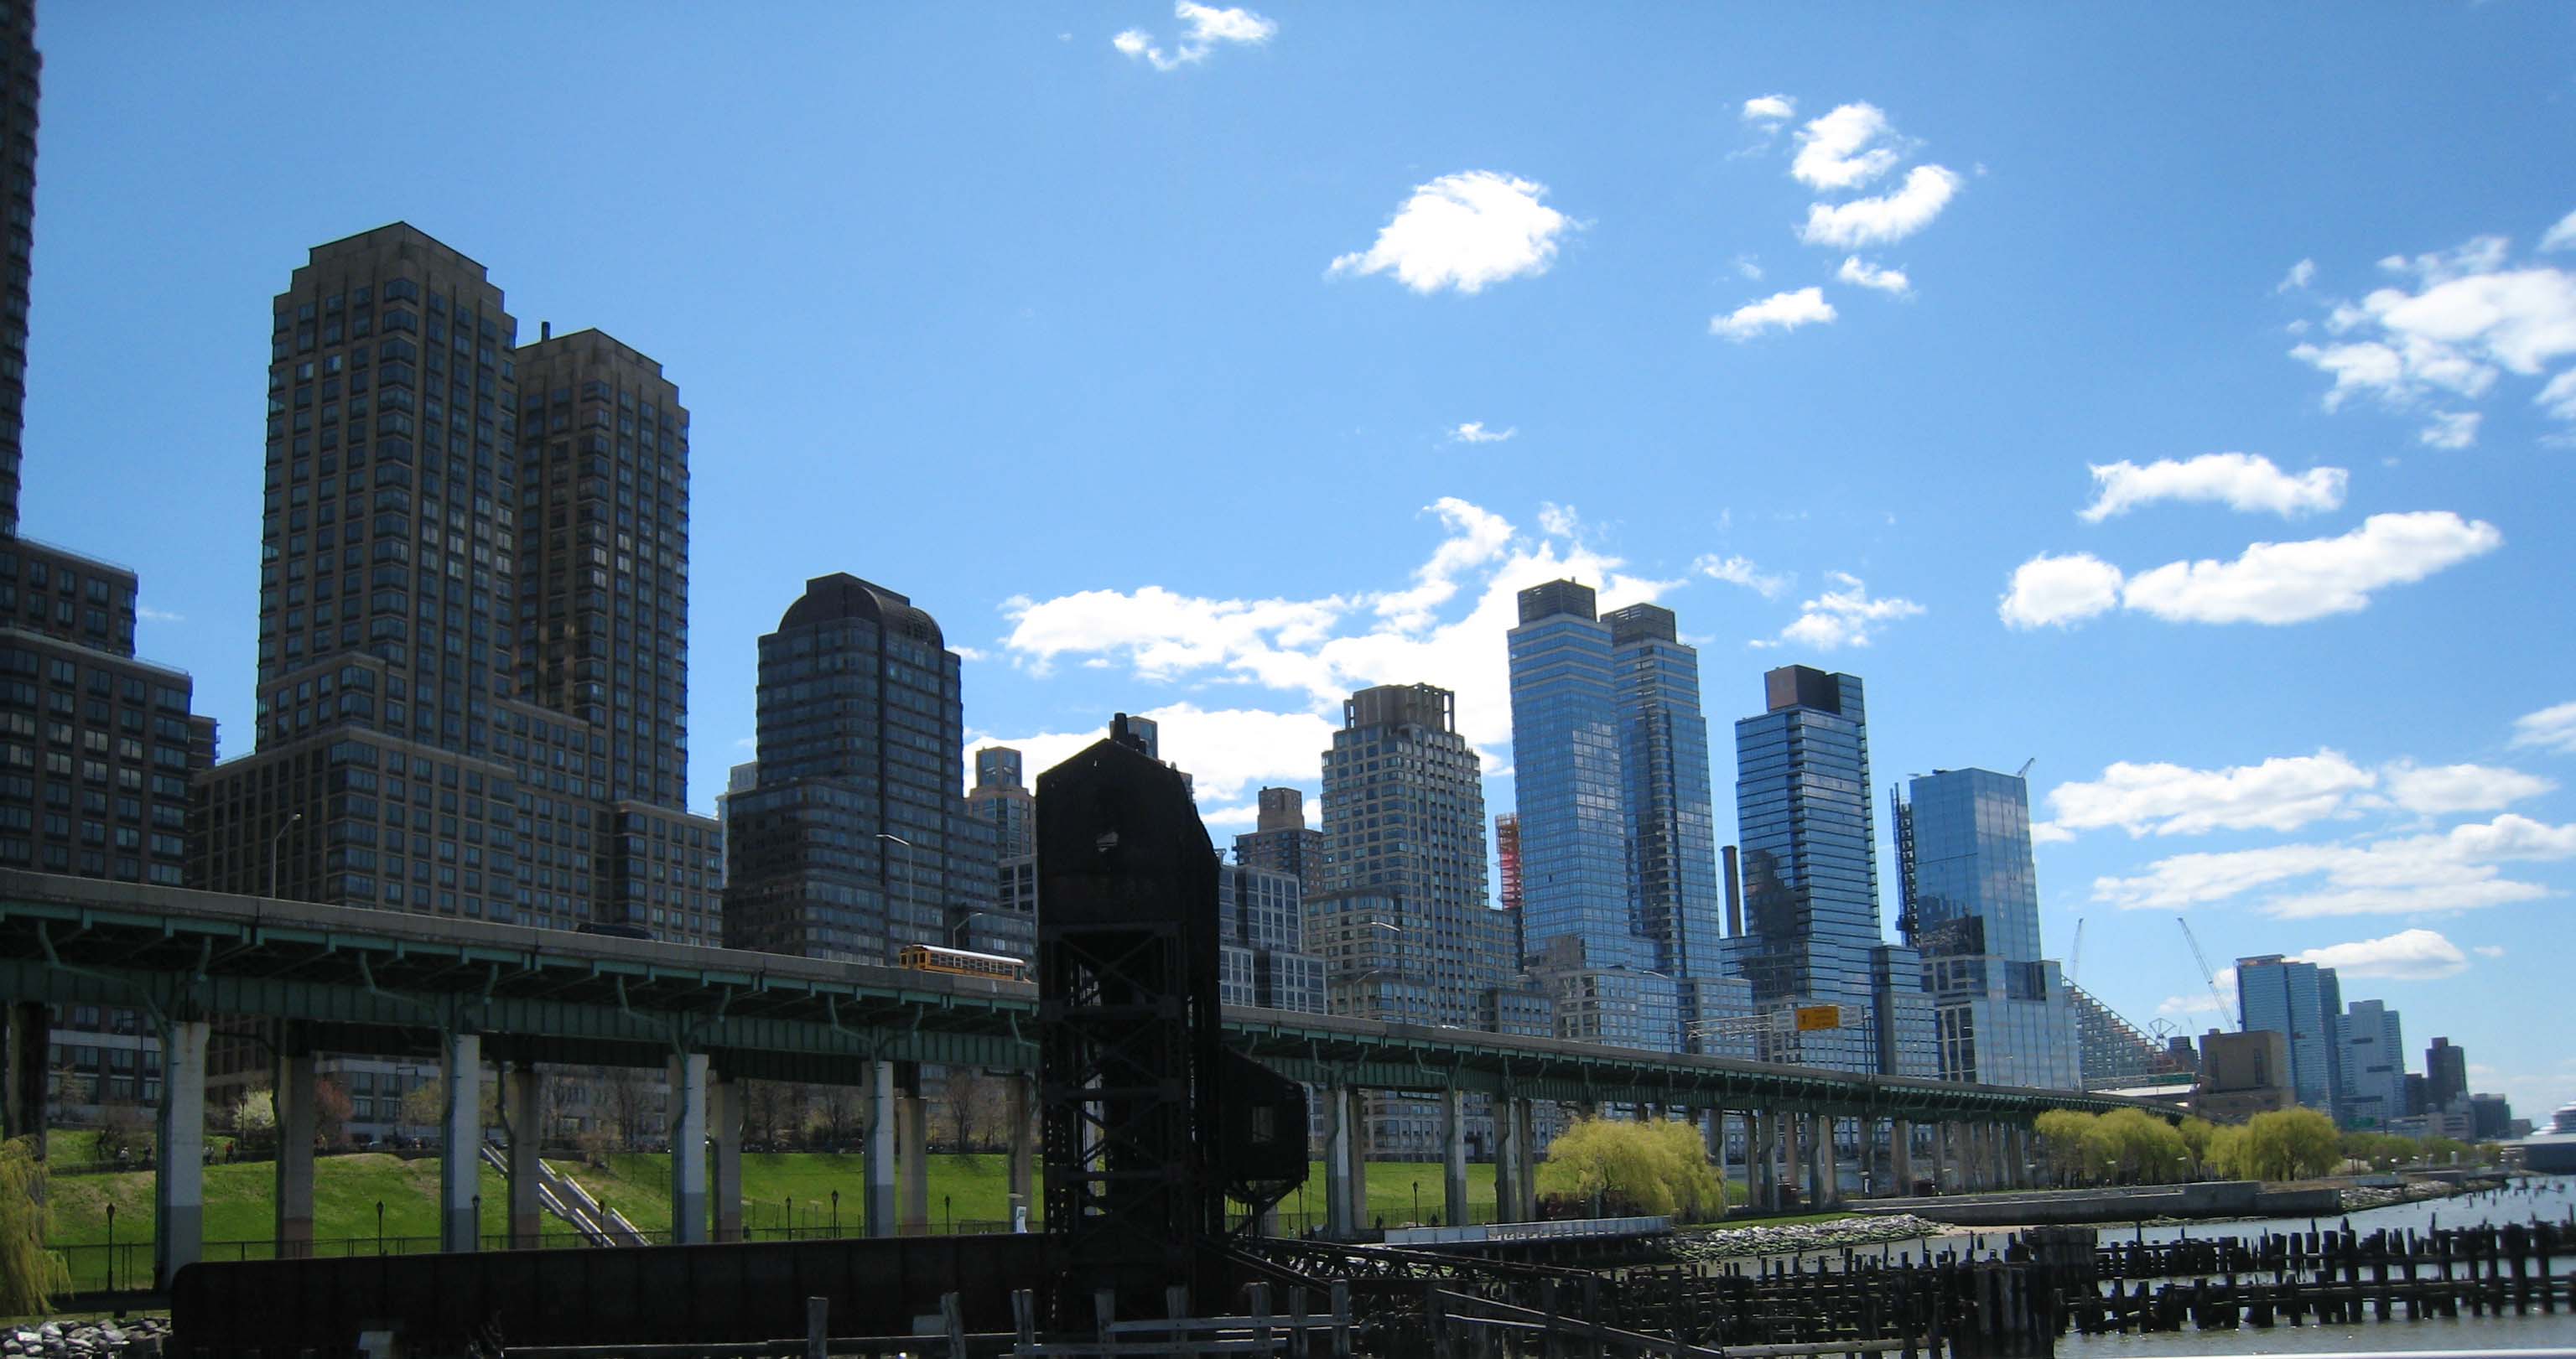
A long history of anecdotal reports and a perusal of real estate ads indicate that residences in Manhattan with river views also get substantial premiums in rents and sale prices. That suggests that the Hudson River also probably has strong impacts on the desirability and value of nearby apartments and their buildings. By 2004, Trump’s Riverside South had built 2,828 new residential units in five buildings along the Hudson River in a former Penn Central rail yard (51). Since then, new buildings have probably brought that total to 5,000+ units (see Figure 4).

Figure 4. Riverside South along the Hudson
The neighborhood also has some other features that influence both residential and commercial locational decisions and that probably even influenced the selection of the site for Lincoln Center: its proximity to the Midtown Manhattan CBD and its mass transit assets. The neighborhood basically abuts the Midtown CBD, and its Broadway commercial corridor has grown to the point where it now can be seen as an extension of that CBD. The neighborhood is served by four subway stations, seven subway lines and five bus lines.

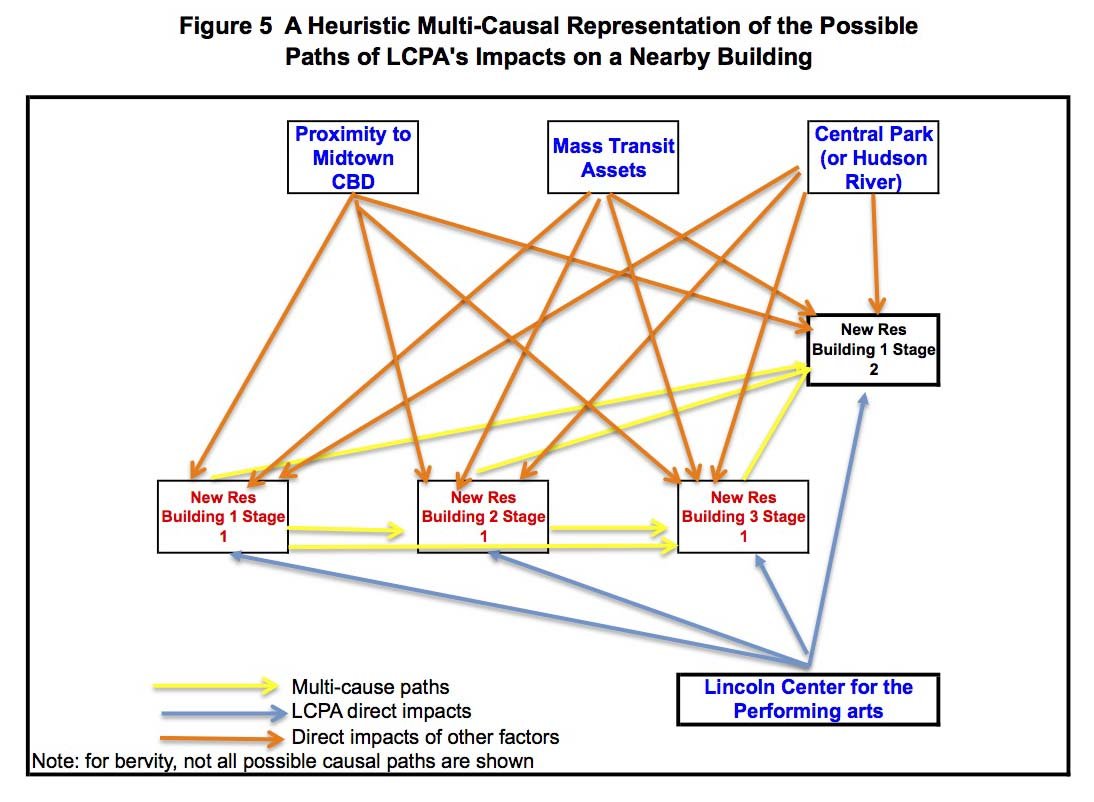
Looking at the causal factors associated with Lincoln Square’s residential development, as partially represented in Figure 5, it appears to have been fairly complicated, with many factors in the equation and numerous direct and indirect paths through which they could be manifested. The presence of many strong impacting forces means that there is is a very strong neighborhood effect that now underlies its magnetism. Over time, the new residential units and their affluent residents helped bring in
- A steady growth of national retail chains that includes Apple, Brooks Brothers, Lululemon, Best Buy, and Zara
- A 13 screen cinema (one an IMAX) that probably attracts at least 500,000 guests a year
- An increasing number of prestigious restaurants, e.g., Jean George, Per Se, Picholine, Bar Bouloud, etc.
These, then added to the neighborhood’s magnetism and the complexity of analyzing Lincoln Center’s economic impacts. It should be noted, however, that this did not happen quickly, probably taking 20+ years for Lincoln Square’s magnetism to become sufficiently strong.
Certainly, this multi-causal situation provides a basis for calling in question the use of Manhattan and NYC as the comparable areas by which Lincoln Center’s impacts on Lincoln Square’s growth in housing units, households, assessed real estate values were to be established. How many other neighborhoods in Manhattan are as close to a Central Park or a Hudson River as well as a world class CBD and have seven subways lines serving them? Perhaps a few, but far from all. How many in NYC? Probably a far,far lower percentage. Can Manhattan and NYC then really provide the useful comparisons to the Lincoln Square neighborhood that are needed to show how Lincoln Center has impacted it?
Lincoln Center’s local impact area also still remains uncharted. Assuming that it was congruent with the Lincoln Square neighborhood did not mean it was an accurate representation of reality.
Analyzing the residential impacts of PACs in smaller downtowns will often present a similar need to deal with a multi-causal situation. For example, in downtown South Orange, NJ, a substantial and growing number of housing units have been developed near the commuter rail station – which the South Orange PAC also abuts. How much of this residential development can be attributed to the PAC? How much to the rail station? How much simply to a downtown location?
From a downtowner’s perspective, it also would have been useful to learn how the impacts of local residents compared to that of Lincoln Center’s audiences on local retail growth.
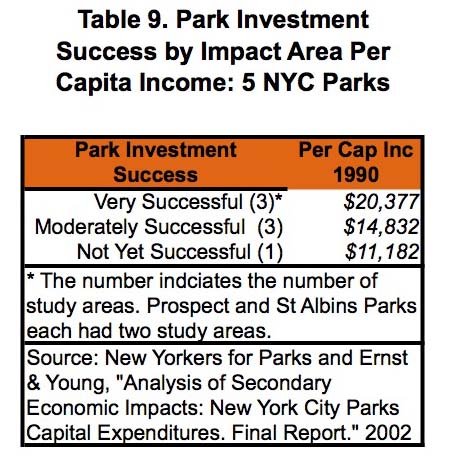
3. The Influence of the Income Levels of Park Impact Area Residents. Most people are not affluent enough to live across from Central Park, the High Line or Millennium Park. How successful are investments in parks that are located in less affluent areas, such as those in or near many downtowns? In 2002, New Yorkers for Parks and Ernst & Young conducted an in-depth study of six NYC parks that gathered some data relevant to answering that question. The study was reported in the document “Analysis of Secondary Economic Impacts: New York City Parks Capital Expenditures. Final Report” (52). Among the parks studied was Bryant Park, the only one with the real estate inventory in its impact area being predominantly office buildings. The other parks studied had mostly residential impact areas.

Table 9 was constructed by this author from data presented in that report. It speaks to the question of how the economic impacts of parks are influenced by the incomes of the people who live within their impact areas. The table reports on data from seven study areas. Prospect Park in Brooklyn and St. Albans Park in Queens each had two impact areas looked at by the E&Y researchers and the data on them were included in the table. Also included in the table are data on Close Lakes Park on Staten island, Crotona Park and P.O. Serrano Park, both in The Bronx. Data on Bryant Park are not included in the table because its surrounding properties are not dominated by residential uses. Each of the study areas had an “impact area” close to the park and a “control area” that was supposed to be as comparable to the impact area as possible, save for its proximity to the park.
Based on their analysis, E&Y rated each of the parks on the degree to which the financial investments in them had paid off by increasing the values of the real estate in their impact areas and the taxes that were levied on them. The impacts of the park investments were judged to be very successful, moderately successful and not yet successful. The study covered the years 1990 to 2001.
Though the sample size is admittedly small, all seven study areas were looked at with the same methodology and the pattern in the data is clear: the success of park investments increases with the incomes of their impact area’s residents.
That it’s tougher for parks to have positive impacts on real estate in poorer neighborhoods and downtowns should surprise no one, but kept in mind to assure realistic policy and programmatic expectations. That said, because something is tough to accomplish does not mean that it should not be attempted.
4. The “People’ Part of Residential Impacts. Residential development not only means physical development, but also possible associated changes in the characteristics of the people and households that occupy them. These people changes can have significant economic ramifications. Retailers, for example, have long followed roofs and many of them have come to appreciate having lots of nearby residents with high disposable incomes. Conversely, residential development can also raise issues of gentrification through the displacement of low income households.
For example, the 2004 study of Lincoln Center’s economic impacts noted that:
“…the population that resides in Lincoln Square is, in many ways, atypical: It is slightly older, more educated, and has a higher average income than most in Manhattan. Unlike most neighborhoods in Manhattan, Lincoln Square has more residents between the ages of 25 and 34 than it does residents under the age of 24. These residents tend to be highly educated, with 75% holding at least a bachelor‘s degree, compared with just 49% across Manhattan and 27% across the five boroughs. Lincoln Square residents are also more likely to have high incomes, with almost 40% of households reporting an annual income of $100,000 or more, compared with just 24% of Manhattan and 14% of New York City households. Given these demographics, the surge in retail investment during the past decade comes as little surprise” (53).
The neighborhood impacts claimed for Lincoln Center seem quite clear. On the other hand, the NYC park improvements studied by E&Y seem to have had far less definitive impacts on the characteristics of the people who live in their impact areas.

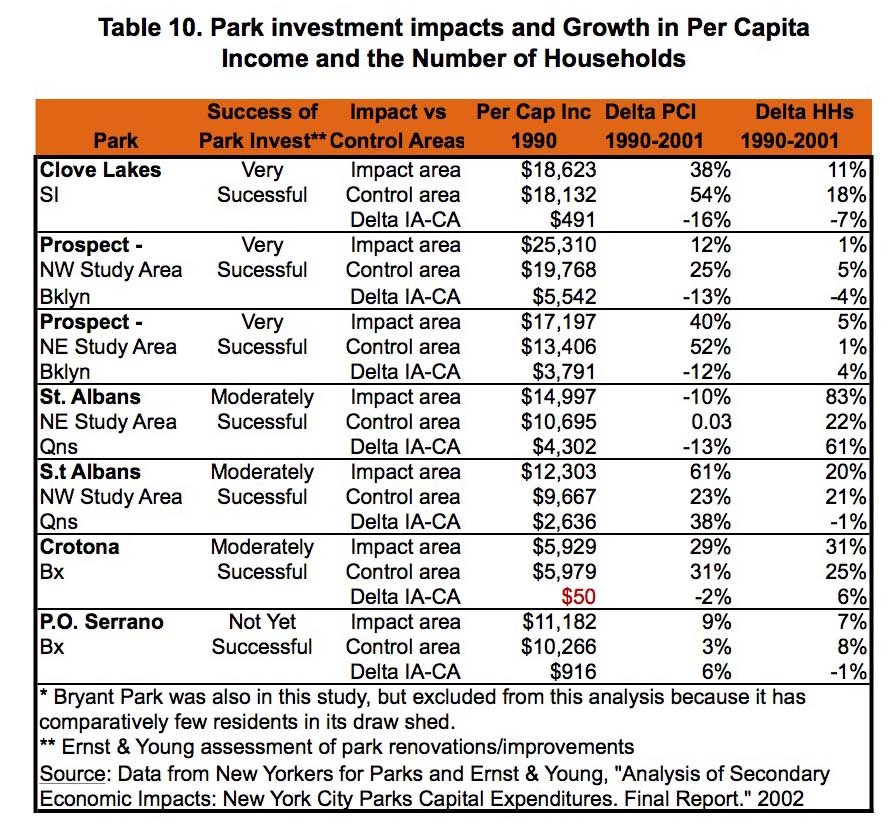
The data in Table 10 were assembled and computed from statistics presented in the E&Y report. The table covers seven study areas, with each having an assessment of its park’s investment impacts. Each study area has its own impact area and control area. Statistics are presented for each impact and control area on per capita income in 1990, the percentage growth in per capita income (PCI) between 1900 and 2001 and the growth in the number of households (HHs) between 1900 and 2001. Looking at the column “Delta PCI 1990-2001” we find that:
- In six of of seven study areas, the PCI grew in the impact areas. The growth ranged from a very modest 9% to an impressive 61%
- The two impact areas for St. Albans Park had both the highest and lowest PCI growth rates, 61% and -10%. The two impact areas for Prospect Park also had dissimilar PCI growth rates, 12% and 40%
- The growth in PCI among the impact areas does not appear to have an apparent association with the success of their park’s investment
- In five of the seven study areas, the growth in PCI was greater in the control area than in the impact area. This probably reflects the fact that a number of other, unidentified, factors impact a neighborhood’s PCI and they, in aggregate, are often far more powerful than a park’s creation or substantial improvement.
As for household growth, which is closely tied to residential unit growth:
- The parks that had “very successful” and “not yet successful” investment impacts showed relatively modest growth rates in their impact areas of 11%, 1%, 5% and 7%
- The parks with moderately successful investment impacts had more robust household growth of 83%, 20% and 31%. In the St. Albans NE impact area, the combination of -10% PCI growth and 83% household growth supports the hypothesis that a lot of less affluent households were being attracted to that area. That was probably the result of affordable housing units being built
- The differences between impact and control areas on the household growth variable (see Delta IA-CA) are smaller than on the PCI variable, except for the St. Albans NE Study Area, and there is no apparent pattern across the study areas.
The E&Y study shows that putting an entertainment venue into a neighborhood is no guarantee that it will attract a lot more affluent people to live in that area. A lot also depends on the neighborhood’s other development assets. Lincoln Center inserted into another Manhattan neighborhood — such as around the old location of the Metropolitan Opera in the Garment District — might have produced quite a different set of local impacts.
Impacts on Offices, Hotels and Retail
Offices and Jobs. Office development is important in many downtowns and basically the main story in some. Small and medium-sized towns are very unlikely to attract tenants needing large amounts of office space, though office activity can still be an important function for their downtowns. Office development not only impacts on real estate values, but also on how the downtown looks and operates. Many “office districts” can be deader than doornails after 5:00 p.m. and on weekends. For many retail and service operations, the characteristics of a district’s daytime population are more important than those of its residential trade area. Offices bring in jobs and the people who fill them can be important components of a district’s daytime population. They often account for high percentages of lunchtime shoppers and of those who use nearby public spaces and cultural venues.
1. Campus Martius Park in Downtown Detroit and Discovery Green in Downtown Houston. These two successful parks were projects of the Project for Public Spaces (PPS). In their documentation on the PPS website, PPS provides information about how these projects have impacted on their surrounding areas. The documentation does so in a way that is easy to read, easy to understand and useful and relevant for downtown leaders. One reason is that the quantified impacts did not require complicated research with large data gathering efforts or sophisticated statistical techniques to determine. Nor is it long winded.
With both parks, a primary impact discussed is the new investment dollars attracted by the parks, including the investments in new office buildings. Doing this does not require the collection of a large number of pieces of data. PPS also uses local experts to establish the causal connection between the the parks and their impacts. For example, regarding Campus Martius Park, the PPS website states that:
- “The $20-million public space, comprised of less than two acres, has spurred well in excess of a billion dollars in new investment downtown and spurred the re-location from the suburbs of thousands of employees of major corporations like Compuware and Quicken Loans…” (54)
- “Most significantly, the Compuware computer firm moved its headquarters and 4000 employees from the suburbs to a new building near the square” (55).
It then establishes the causal connection by using this quote:
- “ ‘Compuware would not have come downtown without the park,’ notes Bob Gregory of Detroit 300. ‘They didn’t want just a building. They wanted a lively district, where their workers would have things to do’ ” (56).
PPS describes Discovery Green’s impacts in the following manner:
“Catalyst for more than $500 million in downtown development projects (completed or underway) that specifically note the park’s creation as an impetus for the dramatic investments, including the creation of the Embassy Suites Hotel, One Park Place Luxury Apartment Building and the Hess Tower (Hess Corp HQ)” (57 – italics added).
With Discovery Green, it is apparently the developers themselves who made the casual connection between the creation of the park and their investments. it’s hard to argue with them about why they invested.
This approach to impact analysis has the advantages of being relatively easy to do, easy to understand and having considerable credibility. Yet, it should be used with caution because of some potential conceptual muddles. For instance, with regard to Campus Martius Park, based on the information PPS provides, it seems legitimate to conclude that
- The park had a major influence, perhaps even the predominant influence, on the site selection decisions of Compuware and Quicken Loans that led them to construct and occupy new buildings adjacent to it. The park undoubtedly has helped make development happen
- It is doubtful that the park was the dominant factor in the determination of how much money was invested in these projects. The number of employees these firms wanted to accommodate, how much space they wanted to provide for employee desks and amenities, the costs of land and the costs of the labor and materials needed to create that amount of office space were the far more likely dominant determinants of the magnitudes of those investments. The proximity and quality of the park may have impacted on investment magnitudes to the degree that the developer’s financial planning anticipated the park would provide a premium in rents and/or the building’s sale
- Location does have an impact on rents and rents are an important determinant of a buildings value. Consequently, the park now most probably does add to the value of the adjacent buildings and the rents of their leased spaces. There is no research cited by PPS on how much of the adjacent building’s rents can be attributed to their location adjacent to the park, but it is unlikely to be more than say 15% to 25%. Again, the park is neither the sole or the dominant causal factor
- While these percentages are relatively modest, the park’s impact becomes more impressive when they are applied to the aggregate valuation of these buildings. For example, if the buildings together are now appraised at about $1 billion, then the park accounts for $150 million to $250 million of that valuation. That’s not exactly chump change, especially for a $20 million public space investment.
2. Millennium Park in Chicago. The 2011 study of this very popular and successful park showed that, in contrast to its significant positive impacts on residential property values, its impacts on nearby office buildings have been negligible: “An analysis of rental rates and vacancy trends of the East Loop compared to the rest of the downtown market did not yield any significant trends. This was confirmed in conversations with active office leasing brokers in the East Loop” (58).
The brokers felt the main constraint on the park’s impact was that “the distance from the main transportation hubs on the west side of The Loop will continue to hinder demand” in the East Loop (59). This is further proof that the characteristics of the downtown environment in which an entertainment venue is inserted will influence the range and magnitudes of its impacts.
The brokers noted that views of the park did give some East Loop office spaces a strong marketing tool that helped differentiate them from their downtown competitors (60).
The credibility of these findings is enhanced because the researchers combined their secondary analysis of leasing data with consultations with commercial brokers who knew the East Loop office market.
These findings also demonstrate that a big, successful entertainment venue may not always be a spark for office development. Furthermore, they again show that the attributes of the urban environment in which such venues are inserted will influence the characteristics and magnitudes of their impacts.
3. Bryant Park, New York City. Two interesting studies have been done of Bryant Park’s impacts on adjacent office buildings. The 2002 E&Y study, discussed above, is interesting because of its findings, its methodology and the careful way that its findings were stated. A more recent 2014 study, by Landauer Valuation & Advisory, is notable for its methodology, its credible numerical estimates of how much the park impacts on the rents of the office buildings that surround it as well as their valuations, and the prudent wording of its findings and approach (61). Both E&Y and Landauer are staffed with real estate professionals.
The E&Y study looked at four of the 20+ buildings located across a street from Bryant Park and compared their asking rents in 1990 and 2002 to those in some other nearby Manhattan CBD office submarkets. One of the buildings was rated as Class A, while the other three were Class Bs.
This sampling was presumably because the inclusion of all the adjacent buildings would have been prohibitively expensive. It is interesting that although the E&Y researchers had established the same types of impact and control areas for Bryant Park as they had for the other five parks they studied, they ignored them when examining the impacts of the park on nearby office rents. In effect, they used the other Midtown CBD office submarkets as control areas for rent related variables. That is understandable, given that is where the strongest competition for Bryant Park’s adjacent office buildings is likely located. It also reinforces the argument offered above, that the geographic definitions of such control or comparable areas may need to vary depending on the variables being analyzed.
Importantly, the E&Y study recognized that:
- “Increases in real estate values during the 1990s (were) due to several factors including:
- – Bryant Park renovations
- – Improvements to Grand Central Station (sic)
- – Revitalization of Times Square
- – Economic conditions
- – NY Public Library renovations” (62).
The E&Y study found that:
“Between 1990-2002, asking rents for commercial office space near Bryant Park increased from 115% to 225% as compared to increases ranging from 41% to 73% in the surrounding submarkets.” (63 )
The difference in the asking rent increases is undeniable, but the study unassertively concluded from this that “park renovation (was a) critical factor to success of the area” (64). Notably, it did not try to quantify how much of this growth in asking rents was due to the park’s renovation. Nor, based on the temporal coincidence of the park’s renovation and the strong increase in asking rents, did it attribute all the increases to the park’s renovations.
Rents combined with a cap rate can be used to generate a useful estimate of a building’s value. The E&Y researchers did not attempt to generate such estimates for the four office buildings adjacent to Bryant Park.

Looking at Part A of Table 11, we can see that, in 1990, the asking rents at the Grace Building, the only one in the Class A category, did not lag behind the Grand Central submarket and lagged behind the Rockefeller Center submarket by 22%. As might be expected, the 1990 asking rents lags of the Class B buildings were far more substantial: -73% compared to the Grand Central submarket and -23% compared to the Penn Plaza Garment District submarket. By 2002, all of the buildings had higher asking rents than their comparison submarkets. This was certainly an impressive turnaround.
The three Class B buildings showed greater improvements than the Grace Building. The table’s “Delta” rows show the differences in the relative positions of the asking rents of these buildings in 1990 to their relative positions in 2002. Part B of Table 11 is based on Part A and presents the average market lag in 1990 and the average delta for the Grace Building across its two comparison submarkets as well as the same types of data for the three Class B buildings in their respective two comparison submarkets. The Grace Building had less of an average lag, -10.5%, but it also had a smaller average delta, 35.5%. In contrast, the three Class B buildings had an average asking rents lag of -48% and a delta of 65.5%. The buildings with the largest lags made the largest gains in asking prices relative to those in their competitive submarkets. Is this a result simply of the fact that they had more statistical territory to recapture or also an indication of some more interesting underlying tendencies?
None of these buildings were decayed or in bad condition. The building in the best condition was in the best competitive position. It was Bryant Park that was the force of decay and disorder. Its renovation obviously helped all of them, as the owners of all the building have attested, though it seems to have helped the less strong the most on a percentage basis. Is this a one-of-a-kind situation or will a similar result occur whenever a public space or entertainment venue that has been dragging down its surrounding neighborhood’s attractiveness and real estate values is very successfully renovated? Also unknown, is how much the renovation of the park stimulated improvements in the Class B buildings, giving them better office spaces as well as an improved location to sell. This would demonstrate how Bryant Park’s direct and indirect causal paths function.
Following this line of reasoning, it is harder to see how a similar result flows from the creation or successful renovation of a public space situated amidst a group of buildings that are either decayed or in marginal condition — unless the project is so large or there are other powerful casual factors that can join with the public space to spur the substantial renovation of the existing buildings or attract the construction of new buildings.
The data in Table 11 are also consistent with the hypothesis that as the properties surrounding a public space get stronger and more desirable, the relative weight of the public space’s direct impacts on them may diminish.
The 2014 report by Landauer Valuation & Advisory stands out for its methodology. Its analysis of the park’s impact on rent rates focuses on 548 leases, of which 126 are in buildings located in the BID, with the remainder in nearby buildings that are outside of the BID. Like Sheppard’s hedonic studies, it uses a multiple regression model statistical tool to analyze the relative strengths of several potential causal variables:
- Location: whether the space is or is not in the BID, i.e., adjacent to the park
- Whether the space is in a Class A or Class B building
- The square footage of the leased space
- The type of lease, e.g., new or renew
- Floor height – where it is in the building
In addition, it surveyed 29 appraisers, commercial brokers and building representatives.
The Landauer report also provides a model that more economic impact studies should follow when it comes to a report’s language. This description of the project is a good example:
“We have completed this exercise for comparison purposes, in an effort to quantify the approximate percent difference in value that is attributable to the rent premium derived from a location on Bryant Park” (65).
How many economic impact studies say they are an “exercise for comparison purposes” or engaging in an “effort to quantify the approximate percent difference?”
Considering the park’s specific impact on rents, Landauer reported that:
“Our statistical analysis yielded a Bryant Park-based office rental rate premium of approximately 10% to 15%. The survey of market participants offered an opinion of the premium of 14.55% on average, with a median of 15%, a mode of 10%, and a standard deviation of 6.66%.
We have concluded to a premium attributable to being located on Bryant Park of one-eighth, or 12.5%” ( 66).
Some other interesting findings of this exercise:
- The strongest explanatory variable was the floor in the building on which the leased space was located
- The location variable – whether or not the space was in a building adjacent to the park – was the second strongest, about 22% weaker than the location in the building variable
- Building class and the amount of leased space both had about half the explanatory power of the location variable (67).
Landauer then used its findings about the park’s rental rate premium to assess the park’s property value premium, inserting them into a fee simple building value analysis of six office buildings that were located on the park. Extrapolations were then made to the other buildings in the Bryant Park Business Improvement District. Landauer found that:
“Further, it is our opinion that, when translating the rent premium into a property value premium, properties located on Bryant Park would be worth between 20% and 25% less, on average, if they were not located on Bryant Park” ( 68).”
Here, again, the park did not account for most of the building’s worth. However, given that the six buildings studied are probably worth $ 6 billion+, between $1.2 billion and $1.5 billion of their worth can be attributed to being adjacent to Bryant Park (69). Extrapolating that out to all 26 buildings in the BID would vastly increase the dollar value of the park’s impact on adjacent buildings.
Regarding the park’s impact on the city’s real estate tax revenues, Landauer found that
“This value premium results in increased real estate tax revenue for the City of New York, estimated to be a minimum of $33,000,000 annually. Only office rental rates and their effects on value were estimated in this report, not retail rental rates. Therefore, it is conceivable that the increased tax revenue is greater than this amount” (70).
Many of the other real estate impact studies reviewed for this article would have benefited from using a methodology similar to Landauer’s. Many more economic impact studies would benefit by stating their findings in the same prudent language used by Landauer.
Impacts on Nearby Retail. Covering how much the audiences of an entertainment venue spend within the entertainment venue’s region, perhaps even looking closer at how much they spend in retail shops, hotels and eateries seems to be the limit of the analytical attention economic impact studies might give to impacts on retail and hospitality activities. Of course, having defined “local” or “community” at the county or multi-county level. means they do not pay much attention to the neighborhood immediately surrounding an entrainment venue — except if they are also looking at impacts on real estate values. Even these “impact on real estate value” studies seldom go into much analytical depth on retail space values, e.g., the 2004 Lincoln Center study. Sometimes this is apparently due to the analysts or their clients not feeling the subject merits the required attention or the associated costs of time and money. In other instances, such as Landauer’s Bryant Park study, the needed data were just not there to collect and analyze.
This might be considered as a remarkable pattern, given that in so many communities across the nation, downtown leaders and EDOs played important roles in bringing these entertainment venues into their districts.
Observational and anecdotal information indicate many instances where a robust retail sector exists within about a five minute walk of an entertainment venue – e.g., Union Square in San Francisco, Union Square in NYC, Lincoln Center in NYC, Boston Common, etc. Not known are the degree to which the entertainment venues have sparked and helped maintain the retail development and the channels through which this influence is exerted. For example, do the audiences of a downtown PAC add more to the coffers of nearby retailers and restaurants than the new residents attracted to the area, directly or indirectly by the PAC?
However, there also are many instances where the nearby retail is either non-existent, weak or not impressive. NJPAC in Newark, for example, has not sparked a nearby retail revival. The Green in Morristown, NJ has attracted some major destination retailers like Century 21, but not been as attractive a location for small independent merchants. For all its success and magnetism, the retail around Bryant Park has not been as impressive as its impact on adjacent office buildings has been, though its improvement in recent years is quite noticeable. The GAFO retail has not been that robust. Food operations, on the other hand, have been strong, with the Le Pain Quotidien and the Starbucks locations across from the park reportedly being among the highest grossing in their chains (71). More upscale shops, such as Whole Foods and Tourneau, a watch retailer, reportedly have signed leases for spaces near the park (72). Most impressive has been the development in recent years of a kind of vibrant and charming boutique/eatery cluster of attractive small shops along 40th Street from 5th to 6th Avenues. A decade ago, this block was quite dull and glum.
Do these examples demonstrate the lack of a casual connection between entertainment development and retail growth or are there, in these downtowns, unidentified factors present that inhibit the manifestation of that causal connection? Does it make a difference if the district around the venue is dominated by office activities or if it also has a significant number of residential buildings? Do the lack of a shopper bounce gained by having retail on both sides of a street or one-way auto traffic make any difference? Are some types of retail and hospitality activities helped by some kinds of entertainment venues and not others? The strength of eating and drinking establishments in or near theater districts or close to PACs, parks and public spaces suggests that they are more likely to benefit from the presence of entertainment venues. Americans for the Arts surveys have shown that the audiences of cultural and arts venues spend much more in eateries and hotels than on retail purchases. Not known is how much of those expenditures are spent in establishment close to the entertainment venues or the indirect impacts of those establishment through the residents and workers they have helped bring into their districts.
These questions cannot be answered by a study of just one entertainment venue in one downtown. That means that the needed type of study could be complicated and expensive. Americans for the Arts has assembled a very large database on cultural and arts venues and it can probably can used in such a study, while reducing its data gathering costs.
Impacts on Nearby Hotels. Many important and famous hotels are located adjacent to or within a few minutes walk of Central Park in NYC, Union Square in San Francisco, Times Square in NYC, and the Boston Common in Boston.
Observational and anecdotal information also indicate many instances where hotels have been developed following the development or rejuvenation of an entertainment venue. For example:
- The building of the first phases of Mitchell Park in downtown Greenport, NY, was followed by the development of a 30-room hotel adjacent to it (73)
- An office building was converted into the Bryant Park Hotel in 2001 and a 282 room hotel is now being built just west of Bryant Park on W42nd Street (74). Field observations over the years suggest that there are a lot more hotels within a five-minute walk of the park than there were a decade or two ago. How much of that growth can be attributed to the park and how much to the 1 million SF Macy’s about five blocks south and a revived and extremely crowded Times Square is an interesting question
- As noted above, the creation of Discovery Green in Houston sparked the development of an Embassy Suites hotel nearby (75)
For the Greenport and Houston examples, city official and developer reports provide evidence for claiming a causal link between the establishment of the park and the development of the hotel.
On the other hand, there are numerous downtown parks and public spaces without a hotel on or near them. Why do some attract hotels and others do not is still an unanswered question. The demand for hotel rooms, condition of the surrounding neighborhood and transportation access are some other possible factors. The lack of in-depth research on this question remains a problem. One thing is certain: inserting an entertainment venue in a downtown probably will not, by itself, spark the development of a hotel.
The 2011 impact study of Millennium Park stands out among the studies reviewed for this article in the depth of its analysis of the park’s impact on hotels. It reported a secondary analysis of data on the number of hotels and hotel rooms in the area adjacent to the park before and after its completion. From that analysis, and consultations with local experts, the study concluded that:
“The demand for hotels generated by Millennium Park overcame the financial challenges of the recent recession and added 18% more units since the park’s inception. With 4.5 million annual visitors going to the park each year, it’s clear that these people need places to stay. The park spurred hotel development boom, and that can be attributed to the number of people the park attracts” (76).
This analysis certainly indicates that there was significant growth in the numbers of hotels and hotel rooms after the park was completed. However, the explanation of the causal connection presented above again exemplifies the conceptual muddles that economic impact studies can fall into. To begin with, not all of the park’s visitors are from out of town and in need of a hotel room. There also is no survey evidence presented to show that people stayed in these hotels because they were going to visit the park, as the above quote seems to imply? The causal linkage may actually be the reverse of that: proximity to the park, and possible hotel room views of it, gave these hotels a strong marketing advantage for attracting guests who were visiting Chicago for a wide variety of reasons other than visiting the park. Many of these out of town hotel quests then may have gone to the park, not because of a pre-trip plan to go there, but as a consequence of taking a room in a hotel from which it could be easily seen and visited. How many of these hotel guests did what and why is still unknown – as is the causal connection.
The report also claims that: “The park spurred hotel growth that otherwise would have never existed, as no hotels were built between 1999 and 2003” (77) Again, was this because developers thought that park visitors would rent rooms or they thought that new hotel rooms in that part of The Loop with views of a large and attractive park would be very, very marketable. Also, did the recession bring land prices down to more affordable levels? The developers certainly knew what views of the park were doing for residential development.
Whether the association between the park’s development and nearby hotel development is spurious or casual remains unclear — as does the strength of any casual connection. Can it really be argued that the park accounts for the entire 18% increase in units?
Many downtowners have an increasing interest in tourism. That is often accompanied by a desire to learn more about the capabilities of downtown entertainment venues to spark hotel development. Additional research in this area would have an audience, especially in small and medium-sized communities.
Impacts on How the District Works
Most economic impact studies strive to state their findings in terms of dollars. However, if we learned anything from the Troubled Years for America’s downtowns, it was that a downtown only has its competitive advantages to the degree that it works as it is supposed to. The downtown socio-economic subsystem itself is very important. When consumers feel afraid to walk on its sidewalks or in its public spaces, when shops offer an unattractive array of products and services, when commercial spaces are old, unattractive and graffiti strewn, when public transit is unreliable or dangerous, when parking is hard to find and fear inducing, when business owners are leaving in droves, when investments in downtown properties and businesses fall to a trickle, the downtown obviously is not working properly. Conversely, when the creation or improvement of an entertainment venue helps make the downtown function better, it can help attract more downtown visitors, stimulate the sales revenues of nearby businesses and spark other nearby investments in properties and businesses. While a monetary value very often cannot be assigned to these “how the district works” impacts, they still can be analytically important and many can be quantitatively assessed.
For example, DANTH’s field observations of Bryant Park since the early 1980s strongly suggest that the park’s revitalization, with its improved appearance and new opportunities for visitors to engage in a wide array of interesting activities, attracted a large number law-abiding visitors. Their presence, in turn, probably has reduced substantially the fear of crime and the level of avoidance behaviors in that part of the Midtown CBD. That has probably increased pedestrian activity near the park. All of that was good for local businesses and property owners.
Also, reviews of the last round of physical improvements to Lincoln Center focused on how they made the center “less austere and more welcoming and far more integrated into its West Side neighborhood” (78). That certainly sounds as if the renovations had very important positive impacts on the surrounding neighborhood, regardless of whether or not they can be stated in terms of dollars and cents. However, such comments also imply that Lincoln Center previously was having some serious negative impacts on its how its neighborhood functioned, a fact that prior impact studies failed to note, most probably because of their advocacy orientation.
The impact study on Chicago’s Millennium Park employed a “quadruple net value” approach that looks at a long list of social/cultural, economic, environmental and sensory variables. Almost all of them might speak to the issue of how the park has made the downtown area near the park work better. Some of the impacts this report looked at were:
- Social/Cultural: decrease in reported crimes; number of public transit connections; number of parking spaces at or near thew park; number of annual visitors; number of annual events; number of residential units close to park; number of organizations that use the park; pedestrian comfort; square feet of shaded area in the summer
- Economic: park’s impacts on residential, office and hotel development
- Environmental: amount of green space; air quality; storm water runoff; energy conservation
- Sensory: iconic visual elements; sounds and smells (79).
Other downtowns might find some of these variables more or less relevant, and other analysts might take issue with how particular variables were looked at, but this report certainly shows the wide range of impacts that can be considered. New or expanded entertainment venues that are housed in pedestrian unfriendly fortresses, or that create significant air or noise pollution or that severely stress nearby public transit facilities are bound to have adverse economic impacts.
C3D’s study of MASS MoCA’s impacts on South Adams, the town where it is located, looked at far fewer variables than did the Millennium Park study. However, its use of an hedonic analysis of real estate values, its analysis of the gentrification issue and its effective use of readily available data to assess the museum’s impacts on business and job growth make it a study that downtown leaders in other communities might want to look at.
ENDNOTES
Numbering continued from Part 2.
18. Though some have been done, see for example: John L. Crompton, Measuring the Economic Impact of Park and Recreation Services, National Recreation and Park Association, Research Series 2010, pp.68, http://www.nrpa.org/uploadedFiles/nrpa.org/Publications_and_Research/Research/Papers/Crompton-Research-Paper.pdf
19. See Figure 14 at: https://www.ndavidmilder.com/2014/11/bryant-park-part-3-a-comparison-to-other-entertainment-venues-on-annual-expenditures-and-annual-expenditures-per-visitor
20. Ibid,
21. See, for example: Economic Development Research Group, The Economic Role and Impact of Lincoln Center, 2004, pp.41, http://www.edrgroup.com/library/economic-impact-analysis/the-economic-role-and-impact-of-lincoln-center.html Hereafter referred to as LCPA study
22. See: “Three Informal Entertainment Venues in Smaller Communities: Bryant Park Series, Article 4” at https://www.ndavidmilder.com/2014/12/draft-121414-three-informal-entertainment-venues-in-smaller-communities-bryant-park-4
23. Peter Harnik and Ben Welle, Measuring the Economic Value of a City Park System, The Trust for Public Land, 2009, pp. 19 p.1. Hereafter referred to as H&W.
24. Ibid. p.1
25. John L. Crompton, “THE PROXIMATE PRINCIPLE: The Impact of Parks, Open Space and Water Features on Residential Property Values and the Property Tax Base,” National Recreation and Park Association, 2004, pp.201, p.51 http://www.carolinamountain.org/sites/default/files/files/Nature%20and%20Commerce/2%20Compton_ProximatePrinciple.pdf
26. ibid pp. 53-53
27. Megan Lewis, How Cities Use Parks for Economic Development, The City Parks Forum, American Planning Association, 2002, pp 4, p3
28. H&W p.1
29. Howard Kozloff, “The Payoff from Parks,” Urban Land, August 29, 2012. http://urbanland.uli.org/economy-markets-trends/the-payoff-from-parks/
30. Dennis Jerke, Ryan Mikulenka, et al. MILLENNIUM PARK: QUADRUAPLE NET VALUE REPORT. Texas A&M University And Depaul University. Summer 2011. Pp.77, p.29
31. Ibid. p.31
32. Ibid. p.33
33. Megan Lewis, How Cities Use Parks for Economic Development, The City Parks Forum, American Planning Association, 2002, pp 4, p.2
34. John L. Crompton, “THE PROXIMATE PRINCIPLE: The Impact of Parks, Open Space and Water Features on Residential Property Values and the Property Tax Base,” National Recreation and Park Association, 2004, pp.201, p.85 http://www.carolinamountain.org/sites/default/files/files/Nature%20and%20Commerce/2%20Compton_ProximatePrinciple.pdf
35. H&W p.1
36. Sheppard Ken Stephen Sheppard, “Measuring the impact of culture using hedonic analysis.” Center for Creative Community Development, October 2010, pp.28, p.21
37. Stephen C. Sheppard Kay Oehler Blair Benjamin Ari Kessler. “Culture and Revitalization: The Economic Effects of MASS MoCA on its Community.” C3D Report NA3, 2006, pp.16
38. ibid p 17
39. Oshrat Carmiel, “Inside New York’s Newest Architectural Masterpiece for the Mega-Rich,” BloombergBusiness, May 15, 2015. http://www.bloomberg.com/news/articles/2015-05-15/moma-tower-s-70-million-duplex-newest-addition-to-nyc-skyline
40. Stephen Sheppard, “Measuring the impact of culture using hedonic analysis.” Center for Creative Community Development, October 2010, pp.28, p.9
41. ibid p.9
42. LCPA studyp24
43. Ibid. p24
44. Ibid. p27
45. LCPA study p.28
46 Ibid. p.32
47.lbid. p.34
48. LCPA study p.24
49. Distances measured on Google Maps
50. See:http://ny.curbed.com/archives/2015/02/25/15_central_park_west_pad_wants_29m_after_owner_paid_59m.php
51.Computed from data provided at LCPA study, pp.30-31
52.- Hereafter referred to as the E&Y study. This document is a pdf file of a slideshow presentation and can be found at: http://www.ny4p.org/research/other-reports/or-smartinvestment02.pdf
53. LCPA study p.25
54. See: http://www.pps.org/projects/pps-involvement-in-the-place-led-regeneration-of-detroit/
55. See: http://www.pps.org/projects/campusmartius/
56. Ibid.
57. See: http://www.pps.org/wp-content/uploads/2011/08/discovery-green_benchmark_aug-2011.pdf
58. Dennis Jerke, Ryan Mikulenka, et al. MILLENNIUM PARK: QUADRUAPLE NET VALUE REPORT. Texas A&M University And Depaul University. Summer 2011. Pp.77, p. 30
59. ibid.
60. ibid.
61.Landauer Valuation & Advisory, “Valuation Study Of: Bryant Park Business Improvement District.” New York, NY, December 2014, pp.61. Hereafter referred to as Landauer. A big thanks to Dan Biederman for sharing this report with us.
62. E&Y study p. 38
63. Ernst & Young. “How Smart Parks Investment Pays Its Way,” Executive Summary of the NY4P / E & Y study: “Analysis of Secondary Economic Impacts Resulting from Park Expenditures,” 2002 ,pp. 16, p. 2
64. E&Y study p. 38
65. Landauer, p.28
66. Ibid, p.28
67. Computed from data on Landauer , p.24
68. Ibid., p.2
69. Computed from data on Landauer , p.52
70. Landauer, p. 56
71. Reported by a Bryant Park Corporation staff member
72. Ibid
73. See: https://www.ndavidmilder.com/2014/12/draft-121414-three-informal-entertainment-venues-in-smaller-communities-bryant-park-4
74. Landauer, p.10
75. See endnote 47
76. Dennis Jerke, Ryan Mikulenka, et al. MILLENNIUM PARK QUADRUAPLE NET VALUE REPORT. Texas A&M University And Depaul University. Summer 2011. Pp.77, p.34
77. ibid.
78. Editorial, “Lincoln Center, New and Improved,” New York Times, May 13, 2009. http://www.nytimes.com/2009/05/14/opinion/14thu4.html
79. Dennis Jerke, Ryan Mikulenka, et al. MILLENNIUM PARK: QUADRUAPLE NET VALUE REPORT. Texas A&M University And Depaul University. Summer 2011. Pp.77
80.