I am very happy to share this article on downtown multifunctionality/ functional diversity that was recently published in the JURR, a British journal focused on urban renewal and regeneration. It reflects my most recent thinking on this subject, as well as my efforts to add some analytical heft to it while also getting more people to find it of interest and importance.
Here’s the abstract: “In the large downtowns in the US, the adaption rates and impacts of remote work have been strong and sparked efforts to make these districts far more multifunctional, especially by adding lots of new housing. While comparable city centres in Western Europe have not seen remote work have similar impacts on office occupancy, multifunctionalism has long been heralded as a factor that makes them strong. For example, it underpins their two key competitive advantages of dense agglomeration and the generation of many multipurpose trips. While multifunctionalism is a familiar concept and is often mentioned in relevant publications, there is amazingly little written about it theoretically, and little to no empirical research done on it. I took on that topic in a recent paper in which I noted that how downtown multifunctionality is ‘packaged’ in the physical containers in which the venues of these functions are activated, and how they physically relate to each other, are very often the key factors in determining whether efforts to make a downtown more multifunctional will succeed. I also argued that a function must have very magnetic destinations active in these containers. This paper focuses just on the topic of packaging functions and is an expansion of my prior analysis that covers much new ground.”
I have really had it with the Doomers, those who argue that our large downtowns are doomed to failure and diminishment.[1] It’s time to call them out for being the downtown ignorant Chicken Littles that they are.
Their Covid crisis instigated doom loop analysis has been a considerable worry for many municipal business and political leaders, since it predicts not just the decline, but the end of our large downtowns’ ability to be thriving business districts. It also has been almost as good a story for grabbing public attention for many media outlets as fires, riots, and other serious calamities. Of course, it also has been raw meat for some authors who seek greater notoriety. The legitimacy of this argument seems to mistakenly be seen as deriving from the fact that academics and wannabe urban pundits have been its leading proponents and some even used real data analyzed by sophisticated statistical tools. However, the most worrisome parts of the argument are really based not on any data or fancy statistical tools, but on the Doomers conclusions and assumptions. The Doomers thinking displays an enormous ignorance about what downtowns are really like and how they operate. The media writers and their editors who bought the Doomers’ analysis are little better.
The Conclusion of a Downward Spiral. Doomers cite the very low occupancy rates found in the office clusters in our largest downtowns – too often based often on questionable data, mind you — and predict consequent enormous losses in lease revenues and building values. This they then argue will mean the failure of lots of office buildings. Investing in downtown real estate and leasing downtown spaces consequently will be much less attractive, and this will have very adverse effects on other downtown sectors such as retail and personal services. City tax revenues will also drastically fall, with a consequent reduction in essential services, precisely when quality of life problems are surging. Overall, these downtowns will thus become much less attractive in a continually degrading manner.
Frankly, much of this part of the Doomers analysis is valid. Major downtown office sectors have undeniably been hit hard by the pandemic, and many outmoded buildings are indeed doomed. But that has happened several times in the office sector since the 1980s, if not as strongly. Quality of life problems have surged both in frequency and visibility during the crisis. However, the Doomers turn the current office sector downturn into a unique event by making an unwarranted analytical leap, based on little to no probative evidence: they claimed that these downtowns would fall into an unstoppable downward spiral, AKA the doom loop. They did not entertain any possibility of a recovery of any kind such as:
The downtown’s office sector does indeed shrink, maybe even by 20% to 30%, but then it stabilizes at this new equilibrium point that is still a very consequential 70% to 80% of its prior size. But downtown growth is now engined by other sectors such as housing, personal services, entertainment and culture.
After stabilizing, the office sector starts to grow again.
The Doomers’ data have no probative value for determining whether the doom loop scenario or one of the recovery scenarios is the more probable outcome.
Their major justification for predicting the doom loop seems to have been that quality of life issues — e.g., rising crime rates, more homeless – were occurring along with fewer downtown visits and lots of business closures were occurring early in the crisis. Yes, in the past these issues did cause downward spirals in many downtowns. What is interesting is that these problems often emerged in the 1970s and 1980s in fairly large downtown office clusters that stayed successful in spite of them. Ironically, the fortress designs of these clusters often induced the very fear of crime they were meant to protect against. In time, many districts overcame these problems and the downtowns office sector became more prosperous than ever before! Downtown Manhattan and Charlotte’s CBD are two examples that come to mind.
The Doomers choice of the gloomy scenario also shows an ignorance about many characteristics of our large downtowns and it keeps being eroded by hard evidence of downtown recoveries, some of which appeared early in the crisis:
Historically, large downtowns have proved to be amazingly resilient. They survived the Great Depression, and some like Midtown Manhattan even had trophy projects like the Empire State Building and Rockefeller Center developed during that very stressful era. Many also came roaring back after the mid 1990s after having struggled during the 1970s and 1980s.
Downtowns in some states, such as Texas, have long had their office sectors go through serious boom and bust periods because of overbuilding, exhibiting a kind of cyclical resiliency.
Back around the Great Recession the growing appeal of open offices was supposedly making many older office buildings outmoded, much as remote work is said to be doing today. That was supposedly causing great havoc within the real estate industry. If memory serves me, office growth soon returned with a happy vengeance. The office sector, just like other sectors, will experience periodic serious disruptions caused by capitalism’s process of creative destruction. This process is one of both mass disruption and strong recovery.
Nonresident office workers only account for a relatively small proportion of downtown visits. Almost two-thirds of these visits are accounted for by visitors who neither work nor live in a downtown. These visitors were quick to stay away from our downtowns as Covid became a national emergency, and accounted for a far greater proportion in the drop of downtown visitation than did the office workers, BUT they were also the quickest to return in very substantial numbers.[2] This quick return indicates that the causation of this decline in visitor visitation was situational in nature, not structural. In contrast, the slow return of office workers is consistent with structural causal factors being present. By October 2021, data from Placer.ai was already showing strong signs of recovering downtown visitation. Still, Doomer gloom continued to be published.
Office workers also account for a relatively small portion of a downtown’s retail sales. Tourists and residents are the big retail shoppers and spenders. Many downtown retail problems were existing precrisis, caused by the strong wave of creative destruction that industry has been experiencing for about a decade.
So the ability of a declining office sector to hurt retail sales and decimate downtown pedestrian activity is far more modest than the Doomers suggest.
Downtown return to office rates (RTOs) have risen from about 30% early in the crisis to a median of 65% in our large downtowns. That’s not evidence of a downward spiral, but of a significant partial recovery, though the extent of the final recovery is still uncertain.
Midtown Manhattan, once thought to be a potential victim of an office generated doom loop recently was the “hottest office market” in the US in the first half of 2023 that had “far and away” the most absorption of office space.[3]
In downtown San Francisco, the process of wringing out excessive values from troubled office buildings seems to have started, with prior owners and bankers taking their losses and the new owners attracting new tenants with lower and more affordable rents.[4] This process promises to help increase downtown office occupancy rates, as well raising office worker foot traffic and consumer spends.
Greater downtown visitation is known to help reduce the fear of crime, and drive bad uses out of the area. This is something about which the Doomers appear to know nothing. A recently released terrific report by a Paul Levy led team at the Center City District in Philadelphia found that: “The cumulative average of visitors across the (nation’s largest) 26 downtowns by the end of Q2 2023 back at 79% of Q2 2019 levels; workers of all kinds back at 66%; and residents at 120%.”[5]The direction of downtown visits is obviously strongly upward, not downward. That will help make these areas seem more activated and alive, while helping to reduce the fear of becoming a crime victim. The quality of life conditions in these downtowns are not on any definitive downward spiral, though serious issues certainly remain unresolved.
The title of the CCD’s report, Downtowns Rebound, sends a very important message about our large downtowns. They may not have fully recovered, but they are definitely rebounding. There’s no downward spiral. They are not doomed or dying.
Downtown Doomer proponents seem to mistakenly identify the process of creative destruction that downtown office sectors are going through as a downward spiral to doom.
What does seem to be in a genuine doom loop is the doom loop argument itself!
The Assumption That the Economic Health of All Downtowns is Dependent on the Strength of Their Office Clusters.
The focus of the Doomers is on downtown offices and, in their eyes, the failure of that sector drags the rest of the downtown into a downward spiral with it. Such an analytical connection is perhaps easy when the terms Central Business District or CBD and downtowns are frequently used interchangeably, and CBDs are seen as dominated by large office clusters.
In fact, most downtowns are far more complicated and have three sets of major functions, as displayed in Figure 1: Central Business Functions, Central Social Functions, and Central Support Functions.[6] The Central Social Functions (CSFs) are given short shrift by the Doomers, if they are noticed at all, but they are essential in many ways. First, strong CSFs can help assure that downtowns will keep appearing well activated and magnetic, in spite of any diminished office worker presence.[7] In turn, that helps assure that quality of life problems will not push an office sector downturn into the feared death spiral.
Second, in many small and medium sized downtowns, large office clusters are not their strong points, but CSF venues such as restaurants, bars, hotels, churches, public spaces, arts and cultural venues are.[8] Some of our largest downtowns, if admittedly too few of them, have significant amounts of the venues associated with CSFs such housing, retail, public spaces, entertainment and culture. The CCD in Philadelphia is a great example of this. But the fact that most visitors to our largest downtowns, both precrisis and today, are not coming there to work, means they are coming to shop or visit many CSF type venues, and these venues have a significant presence. Residents are also frequent visitors to CSF venues. Indeed, their presence help make living downtown attractive. That strongly suggests that should a downtown have a failing office sector, it could be offset to a significant degree by developing and growing venues associated with CSF functions. That is contrary to the Doomers’ postulation that if a large downtown’s office sector is badly hurt, the whole downtown must not only hurt, but fail.
The leisure, entertainment and hospitality sectors are filled with CSF venues. The CCD study found that the top three cities in terms of overall job recovery—San Antonio, Nashville and San Diego—are also the three cities with the highest share of leisure and hospitality employment. That’s a very impressive example of downtown resiliency given that in the early part of the crisis they probably suffered the largest employment losses. In these downtowns, non-office CSF functions and venues have a lead economic role. Doomers do not acknowledge the possibility of this type of downtown.
In contrast are the type of downtowns the Doomers focus on with employment largely in office prone sectors – e.g., information technology, finance, insurance, and professional and business services, They have had a lower rate of job recovery, if still a substantial one that the Doomers seem to ignore. One explanation for this may be that their major sectors have high proportions of jobs that can be done remotely.[9] An issue that has emerged in these downtowns is can they become more multifunctional, as evidenced most frequently by discussions about adding more housing to the downtown. Some serious efforts are underway in several of these, e.g., in Chicago and Washington, DC. Doomers when they opine on this argue such efforts are likely to be too small and ineffective or unlikely to happen.
[1] There are many Doomer analysts/authors, here is just one well know Doomer article: Gupta, Arpit and Mittal, Vrinda and Van Nieuwerburgh, Stijn, “Work From Home and the Office Real Estate Apocalypse” (October 5, 2023). Available at SSRN: https://ssrn.com/abstract=4124698 or http://dx.doi.org/10.2139/ssrn.4124698. Its first draft was in May of 2022. In the media, even the Wall Street Journal, The New York Times, and The Washington Post have had Doomer articles.
[8] N. David Milder, “How Our Downtowns’ Three Most Important User Groups Can Help Their Sustained Recoveries.” IEDC’s Economic Development Journal. Forthcoming.
Non Resident Downtown Employees. Three plus years after Covid19 was declared a national emergency, it seems that most of our downtowns are now pretty far into recovering from its impacts, though their recoveries are not yet complete. Even so, fears of a Doom Loop emerged grounded mainly on the negative impacts of remote work on office demand, that in turn is based on some distortedly presented data from Kastle Systems on office building worker occupancy rates. Kastle reports on metro regions, not cities though they speak of cities, and the vast majority of their buildings are in the suburbs, not downtowns. Also, when they do have some presence in a downtown, they tend to be in the second tier buildings most likely to have been made outmoded by remote work, not the most attractive and successful ones. In Manhattan for example, Kastle is not in the higher quality buildings owned by the city’s 10 largest landlords that attract the most prestigious tenants and have the highest rents.[1] Flaming the Doom Loop fears was an academic study that showed how such a reduction in office occupancy in NYC and nationally would severely reduce property values by about 44%, with commensurate resulting reductions in municipal property tax revenues.[2] To date, such drastic reductions have not appeared to gain much traction in NYC or nationally.
The most reliable data on remote work is from WFH Research. It shows that about 41% of the workers it sampled work totally remote (12%) or in a hybrid mode (29%). Moreover, about 33% of the paid full days were worked from home in our largest cities. So yes, remote work has reduced the number of hours office workers are in our downtowns, but most are still working there. And the 33% is far less than the 60%+ hours worked at home early in the crisis. So office workers have slowly been contributing to the recoveries of their downtowns by working more often in their downtown offices, if not at precrisis levels.[3]
That said, the data strongly support the hypothesis that a significant amount of remote work is here to stay, and corporate execs and downtown leaders committed to achieving a 100% Return To Office (RTO) rate may be digging a ditch for themselves by fiercely fighting remote work. What they also probably overlook is that precrisis the office buildings in these large downtowns never had a 100% worker occupancy rate. An 100% rate would mean that workers were not sick, on vacation, doing their jobs by meeting externally with clients and suppliers, or working from home.
Consequently, it is really hard to understand those who continue to want a 100% RTO rate and the extinction of remote work, since evidence strongly indicates that quest is impossible to achieve, and it probably never even existed before Covid19. Certainly, one can question whether a recovery strategy primarily aimed at achieving precrisis office occupancy rates would be productive.
Furthermore, we don’t know clearly yet how that 33% reduction in paid days worked will translate into office demand. One might reasonably suspect that it makes a lot more buildings outmoded. Yet, there is a real possibility that the effects of remote work might be mitigated to a significant degree by higher SF/worker in offices reconfigured to be more attractive to workers and heighten a firm’s RTO rate. A current primary strategic challenge for our large downtowns is how to make up for the spending and pedestrian trips of the 41% of office workers who are now working at home to a significant degree. That is what downtown leaders should now be focusing. on, not raising RTO rates.
Downtown Housing. More housing is certainly one way of doing that, but it will take a lot of time, gobs of money, new regulations, and a lot of tough politicking to achieve. It will certainly not be easy.[4] That said, it definitely still should be done, but we now need another strategic thrust capable of producing meaningful shorter term benefits.
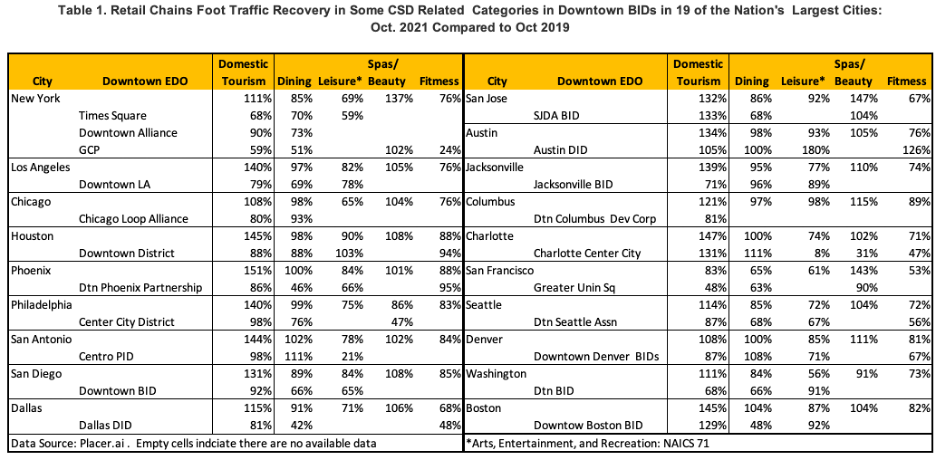
Downtown Visitors. To achieve more immediate results, another, and more practical, strategic thrust should be to increase downtown visitation by those who neither live nor work there. Data released by Philadelphia’s Center City District –see Figure 1 above –show that such visitors account for most downtown visitation and by a large margin.[5] Based on the data in Table 1 that shows domestic tourism was returning very strongly at the municipal level in 19 of our largest cities and in several of their downtowns—e.g., Austin, Boston, Charlotte, San Jose, and Philadelphia – as early as October 2021, my very strong suspicion is that researchers will soon report that this pattern characterizes many other large downtowns.
Foreign and business tourism are also recovering, but at lower rates that may take some time to regain precrisis levels, if they ever do. Business travel budgets, for example, are rebounding, though reflecting in part higher travel prices. Moreover, about 17% “of corporate travel will be replaced with virtual meetings, …suggesting a degree of permanence in the shift with companies recognizing the benefits of virtual meetings ranging from cost savings to lower carbon footprints.”[6] Still, foreign and business tourists had almost completely disappeared from our large downtowns early in the crisis, so their returns, even if at a level lower than might be desired, have been meaningfully contributing to downtown recoveries.
Strong Destinations Are Needed to Win More Visitors. My research and field visits over the past few years has led me to believe that many of our largest downtowns need to up their game when it comes to downtown visiors:
They have been living off of their laurels and too many of the attractions downtown leaders have seen as strong and unique have in fact lost their luster and a significant amount of their magnetism.
These old attractions/destinations now need a hard-headed assessment, and then where required they should be improved or replaced. People come downtown based on the strength and convenience of its attractions.
Improving the programming of public spaces may be one element of such a thrust. Improving the tenants of the small shops on side streets might be another. Right now many rely primarily on retail windows to make sidewalks interesting. Can other uses capable of doing that be brought in?
In many of these large downtowns these attractions’ ability to bring in visits by people living and working within between .25 mi and 1 mile of the core has significantly atrophied over the past 10 years or so. THESE RESIDENTS ARE NOW BEING UNDERSERVED, YET ARE WITHIN REASONABLE WALKING AND BIKING DISTANCES. They should be given priority attention.
[5] In Placer’s calculations: “Visitor” = shopper, tourist, convention attendee, concert attendees, someone visiting a doctor, etc. Resident = Their phone sleeps in the geography most nights per week. Non-Resident Worker = Their phone sleeps in a different geography at night, but routinely comes to the same location in the defined area 3-5 days per week. I want to thank Paul Levy for generously sharing these data with me.
Over recent months I’ve been getting a sense that some suburban downtowns may well make relatively strong recoveries from our current virus induced economic crisis, and relatively speaking, stronger even than those of our superstar downtowns. This also prompted me to think that the current and potential strengths of some of these suburban downtowns are too often underestimated and overlooked. I’m venturing to presume that others may also find these thoughts of interest and they are presented below. Please, let me know what you think about them.
Suburban Downtowns Are Different and Often Surprisingly Strong
Last year Bill Ryan and I did some research on dataset covering all of the 259 downtowns in cities in the 25,000 to 75,000 population range in seven Midwestern states. Our findings will appear in an article in the Winter 2020 issue of the Economic Development Journal, titled Living and Working Downtown: Is It a Population Growth Engine for Small Cities? Included in the dataset were 167 suburbs that usually are parts of relatively large metropolitan areas in which much larger cities are the cores, and 92 independent cities that are themselves the cores of a smaller metropolitan or micropolitan area. We were struck by how different these two types of downtowns are in many important respects. For instance:
Though less multi-functional, the suburban downtowns averaged about the same number of residents 3,089, as the independent downtowns, 3,294.
However, suburban downtowns had a higher population growth rate, 5% to 0.23%, and a lot fewer had declining populations, 31% versus 46%
Moreover, the suburban downtowns scored much lower on our two measures of live-workers in their downtowns, between 3.1% and 8.7%, than the independents, 12% to 29%. Additionally, such low levels even were present in the suburbs that had attracted relatively large numbers of office workers to other parts of their city, such as Dublin, OH, with 42,200+ in 2017
One factor that helps explain the greater strength of the suburban downtowns is that they are very probably located in metro areas with significantly stronger economies than the smaller metros the independent cities are anchoring.
A trend that helps to explain the low live-work numbers in suburban downtowns is that most suburban residents are not drawn to the type of dense housing units their downtowns tend to offer. National surveys for many years now have continued to show that about half of the adult population prefers living in the suburbs and that the vast majority of people who live in the suburbs want to be there. (See the table above.) That strongly implies that they prefer the urban lifestyle that includes single family homes, lower population densities, a slower pace of life, significant car use, and an environment that is predominantly “green” rather than concrete and asphalt.
Moreover, when these suburbs do attract offices they tend to be located in office park-like developments, within about a 5-minute drive of, but not in their downtowns.
The Importance of CSD Functions in Suburban Downtowns
Our findings also had some strong potential implications for a far broader range of downtowns:
Suburban downtown residential populations are not driven by the presence of downtown jobs, as some experts believe is the case with our large and superstar downtowns.
Consequently, they must be driven by other factors. Since the downtown populations of the suburbs and independents are so close, these other factors are probably as strong or stronger than downtown employment is in non-suburban downtowns. These other factors certainly are not weak, and they also could be present in non-suburban downtowns, too.
A very probable strong factor are the suburban downtowns’ Central Social District (CSD) assets: its housing, restaurants, bars, parks, athletic fields, public spaces, cinemas and theaters, libraries, art galleries, maker spaces, farmers markets, community centers, houses of worship, childcare and senior centers. Indeed, it can be reasonably argued that the suburban downtowns that have been successful in terms of popularity, use and investment have done so largely because of the strength of their CSD functions.
Housing is a very important CSD function. Two advantages suburban downtown housing may have are the likely greater comparative affordability of its costs and the convenience of it locations. In struggling downtowns units may be affordable because they are in poor condition and can only command cheap rents. In more successful downtowns, it may be that apartment rents/costs are cheaper than renting/owning an apartment in the region’s core city, or living in a suburban single family house (e.g., empty nesters), and/or because the apartment is occupied by several people who share the rent payments (young adults).
Units close to mass transit will probably be convenient for those who commute by rail or bus to large employment centers elsewhere in the region. Indeed, in these suburban districts, the commuters who live in TOD residential developments may be the equivalents, in terms of economic impacts, of the live-workers found in and near the cores of our largest downtowns. However, according to one report, NJ Transit has found that only 12.5% to 25% of the residents in the TOD projects developed around its stations are NJT commuters.1
These downtown residents can bring in substantial purchasing power. For example, it was estimated that, around 2010, the roughly 1,500 new occupied residential units in downtown Morristown, NJ, would bring in about $72 million in potential retail spending power. 2
Undeniably, when the CSD assets of a suburban downtown are strong, the district is highly urban in character, and more analogous to a strong big city neighborhood commercial district, such as Williamsburg in Brooklyn, or Forest Hills in Queens, than to a sizeable rural town. We might characterize these districts as “urbanized suburban downtowns.”
Typically, suburban downtowns have a Greater Downtown area that includes the downtown and nearby areas from which people can conveniently get to and from the downtown core , some on foot, but most by car. Sorry, folks, but we are talking about the suburbs here. That may be changing in the near future as AV vans and greater use of e-scooters and bikes come more into play.
The non-district portion of the Greater Downtown area can have relatively significant population and workforce densities and be the source of a lot of the customer traffic of downtown merchants. These users also can strongly influence the image of the downtown.
Unfortunately, there is no study of urbanized suburban downtowns. Some districts that I would include in that category are in Wellesley, MA; Englewood, NJ; Morristown, NJ; Cranford, NJ; Westfield, NJ; and Cranford, NJ.
Some have had strong GAFO retail, though that has weakened substantially with the upheavals in the retail industry over the past decade and the Covid crisis. Some have a lot of office workers located nearby in their town who are important lunchtime customers. Some have PACs, theaters and/or cinemas. All are walkable and have lots of eateries, coffee shops, and drinking places. All are surrounded by residential populations with high percentages of creatives – some also have large numbers of creatives working within or very near the town.
This suggests that non-suburban downtowns can also flourish by strengthening their CSD assets.
Suburban Creatives
For many creatives, these urbanized suburban downtowns may be extremely attractive, especially if they either: 1) prefer the suburban lifestyle when it comes to single family housing and green spaces, yet still enjoy urban type entertainment venues such as good restaurants and cultural events, or 2) they are nesting and need affordable and relatively spacious residential units, while also appreciating many aspects of urban entertainment and leisure time activities. The fact that these suburbs often have excellent public school systems also makes them attractive to core city nesting creatives who are looking for a more affordable place to live. In NYC, for example, the private elementary school average cost per student is $13,000 per year and for private high schools the average is $25,267 per year. With taxes, parents will probably need double that amount of their income to cover those costs.
My prior research on 14 counties in Northern NJ that are suburbs of NYC or Philadelphia – see the above table — certainly suggests that in 2010 very substantial numbers of creatives lived, worked or even possibly live-worked in these communities. Interestingly, the median of the percentage of their workforces that were creatives was 31%, but the median of the residential adult population in the labor force who were creatives was 40.3%. See above table. In Somerset and Hunterdon Counties over 50% of the residents in the labor force were creatives. So these suburban counties of superstar cities/downtowns probably have been recruiting lots of creative residents for decades. The size and economic power of these suburban creatives often seems to be overlooked because so much attention is focused on the young creatives being attracted to hip urban neighborhoods of the superstar cities.
Some downtowns in these high creatives counties have tried to attract more creatives to spark economic growth, while what they probably needed to do was to better leverage the numerous creatives they already had! Far too little attention has been paid to these suburban creatives.
The downtowns in these counties did not have anywhere near the number of apartments or condo units needed to house all of these creatives, so it seems reasonable to deduce that most were living in the single family type homes the suburbs are famous for. It also seems reasonable to deduce that the vast majority of these creatives probably were living there because they liked the lifestyles these suburbs support. In turn, this seems to counter the blindered visions of where creatives want to live that only focus on hip urban neighborhoods. Furthermore, it also counters visions that just focus on the young creatives who may indeed have a significant tendency to live in the hip urban neighborhoods, by showing lots of probably older creatives, who have probably nested, prefer suburban or rural residential areas.
Some Downtowns Will Be Better Positioned to Recover Economically Than Others
There already is plenty of evidence that points to the imputation that suburban downtowns, especially those that are urbanized, will be much better positioned to have a successful economic recovery than others. There are also a number of steps their leaders can take that will further solidify their strong recovery positions.
Tourists. Most suburban downtowns, especially those that have been urbanized, are unlikely to be heavily dependent on tourist customer traffic/expenditures as are the downtowns in our large cities such NYC, Washington, D.C., San Francisco, etc., or in rural towns where tourism is the main economic engine. In those areas the collapse of their tourist markets have had large negative impacts.
Moreover, the resurgence of tourism will be hampered by other factors besides the pandemic’s impacts. International politics is one. For example, It probably will be very hard for our major downtowns to regain the strong flows of big spending Chinese tourists they once had. Even under an optimistic scenario, it very probably will take a few years for tourism to return to prior levels in these downtowns.
Office Workers. Merchants in our big city downtowns have also been clobbered by the disappearance of their office workers. In many of them only abut 20% to 30% are now showing up. Moreover the growing adoption of remote work probably means that the number of office workers employed in our largest downtowns probably will decrease by 16% to 22% after the crisis. 3 In contrast, in the suburbs – e.g., Morristown, NJ, Dublin OH, Garden City, NY – that have attracted large numbers of jobs, office worker presence has remained substantially higher through the crisis than in central cities, and they are also more likely to fully recover more quickly. The suburban office workers do not have to use public transportation to commute to work. Consequently, these suburban towns are unlikely to be hurt as much by remote working or to experience their office jobs being decanted to less populated, and less public transit dependent areas as may happen in our large cities. To the contrary, some suburbs may be substantial recipients of such workforce decanting and the growth in remote working. Their downtowns will benefit from this.
Foot Traffic. It should not be surprising then to find that while in many large downtowns foot traffic has fallen by roughly 60% – 70% since 2019, it has been substantially less in their suburbs. See chart nearby.4 Foot traffic is critical to the health of any downtown. The suburbs may not need to recover as much as the center cities on this key variable.
Downtown Small Merchants. Truth be told, small merchants have been a disappearing breed in big city downtowns well before Covid19 appeared. At best they have retreated from the major commercial corridors to sidestreets. A number of factors were involved such as: unaffordable rents; associated real estate bubbles and consequent landlord needs for high paying tenants; new landlords who knew nothing about managing retail properties, and redevelopment that forced closures and relocations. In contrast, small merchants remain the primary occupants of the storefronts in most suburban downtowns, though vacancy rates have continued to creep up for many years now, and non-retail uses continue to increase.
While there has not been any rigorous systematic study, a review of many reports on the internet suggests that merchants who are more dependent on residential markets and less on tourists and office workers were doing significantly better than those who were focused on tourists. Many of our largest downtowns have relatively few residential units within their boundaries, but a whole lot within a Greater Downtown area that includes nearby neighborhoods from which residents can easily and quickly get to the downtown core. That would suggest that merchants in suburban downtowns, especially those with substantial new market rate housing, will not be among those hardest hit. Of course, that does not mean that they are not being hurt or stressed, but it may indicate that it will be relatively easier for them to survive and recover.
Downtown Retail Chains.
Superstar Downtowns, In these districts retailers have long paid extremely high rents for premier retail locations. However, in recent years, real estate bubbles and high rents have resulted in high “availability rates, ” with 20% or more not being unusual. The above table details such a situation in Manhattan in Q2 of 2019. Most of those locations have been very dependent on tapping office worker and tourist shoppers and their ability to again earn meaningful profits probably awaits the return of those shoppers at some still unknown time in the future. The prior high availability rate suggests problems that the Covid19 crisis can only have exacerbated.
Many of these retailers are in the luxury market and BCG recently estimated strong declines in luxury retail sales for 2020 and 2021, with a recovery appearing in 2022, BCG also found that many more shoppers are now trading down than trading up.5 Moreover, online sales of luxury merchandise has been growing significantly.
Many observers expect a new equilibrium between retailer and landlord needs will be reached in the coming years. However, until then retail in these big downtowns may be somewhat unstable. While the landlords of the luxury retailers may continue to claim that all is well, 20% availability rates and the disappearance of key market segments are strong visible evidence that those assertions are not true.
Retail Chains Resurging Post Crisis in Suburban Downtowns. The claim has been made that the closure of many malls and chains will set free so much market share that retail chains and small independent retailers located in suburban downtowns will grow and prosper as the current crisis ebbs. There is probably some merit to this claim – but not much.
Most suburban downtowns have not attracted large numbers of GAFO retail chains, though they often do quite well with those selling necessities such as groceries, convenience goods, and medicines. That is not likely to change in the future because these districts lacked and will continue to lack the required locational assets. Few have the auto traffic that passed near the malls. If retail chains do return to the suburbs, standalone locations abutting high traffic roads on the periphery of these towns may very likely be preferred to those in their downtowns. However, some in wealthier market areas – e.g., Westfield and Englewood in NJ, Wellesley in MA — have in the past attracted lots of GAFO chains, and they often were like open air lifestyle mall downtowns. Even then, though, while the number of retail chains present in these districts was often impressive, according to information confidentially provided by one well known national brokerage firm, their profits per store usually ranked relatively low within their chains. They were thus among the most prone to be closed if their chain got into financial trouble. So unsurprisingly their strength and numbers were eroded by the Great Recession, new competitors appearing both online and from strengthened malls, the retail chains’ corporate weaknesses being magnified by the process of creative destruction occurring in the retail industry, and the negative economic impacts of Covid19. For example since 2009, one of these retail chain rich suburban downtowns has lost the following chains: Esprit, Coach, Chico’s, Ann Taylor, Lucky Brand, White House-Black Market, Janis & Jack, Papyrus, Aerosoles, Victoria’s Secret, Eileen Fisher, Coldwater Creek, Kiels, Omaha Steaks, and Game Stop.
For many years the trophy retailers downtown leaders wanted to attract were largely in the apparel sector, e.g., The Gap, Chico’s, Talbert’s, Ann Taylor, Victoria’s Secret. Today, that sector is in disarray – even some off-pricers, like Stein Mart, that had been seen as well positioned, have fallen.
The argument for the supposed market share being yielded by closing malls and retail chains being captured by retailers in suburban downtowns has a number of problems analytically:
The demand for some kinds of merchandise has been in long decline, e.g., for apparel. This has been influenced by the trend toward informal workplace attire that has been strongly reinforced by the current crisis, and the growth in remote working. It also has been impacted by consumers wanting to spend more for interesting and rewarding experiences than for things.
More than ever, retail chains are looking for low risk locations. These locations tend to be in areas where there are significant numbers of fairly affluent shoppers or very large numbers of easily accessible shoppers with more modest incomes. About 20% of our malls were doing well prior to the crisis, and they tend to capture these affluent shoppers. Walmart, Target, Costco, Best Buy, et al are prospering even during the crisis from their growing proficiency with omnichannel marketing strategies. They are attracting the mid-market shoppers. These malls and big boxes are formidable competitors and probably are sopping up lots of any market share the folded malls and retail chains yielded.
E-retail was growing impressively before the Covid19 economic crisis, but its growth has accelerated substantially during the crisis, and strong evidence suggests these high e-sales levels will not diminish all that much as the economy improves. E-commerce definitely has and will capture substantial portions of any market share that folding malls and chains might yield.
There seems to be fundamental weaknesses with the business model used by retail chains, especially when they are taken over by hedge funds and the like. Bean counters seldom are good merchants, much less great ones!
Internet born retailers may look for spaces in suburban downtowns, but their behavior to date indicates they will look for locations in higher income market areas with strong customer flows. For example, Warby Parker now is located in downtown Hoboken and downtown Westfield in NJ. They are unlikely to flood our suburban downtowns.
The failed malls and chains probably will yield a relatively small amount of market share that downtown retailers might capture. Small downtown merchants are much more likely to benefit from that yielded market share simply because they need much lower sales revenues to survive. That said, these small merchants still better have other market segments to tap.
There is little reason to believe that our recovery from this crisis will somehow coincide with the resurging strength of our specialty retail chains. Because of their high rents, landlords in our large downtowns will probability continue to seek retail chain tenants, or shift to other users who can pay those rents. Consequently, the large downtowns will continue to feel the impacts of the process of creative destruction that the retail industry still is in. On the other hand, relatively few suburban downtowns had many GAFO retail chains, and their numbers were substantially reduced even before the Covid19 crisis. Consequently, they neither benefit a lot from the presence of these retail chains, nor are they very vulnerable to the substantial vicissitudes that these chains may continue to face.
The Costs and Availability of Space. The ability of small merchants to recover and for startups to succeed will be significantly influenced by the availability and costs of their storefront spaces. While deflated rents and increased availability can be expected in both suburban and center city districts, the suburban rents long have been significantly lower and probably will remain so in a relative fashion well into the future. This fact, combined with the greater stability of their potential consumer market segments, probably will give the suburban merchants a greater chance of achieving a sound recovery, or a startup succeeding, than their center city peers might have.
Rent costs are particularly important for restaurant operations.
Remote Working.
The suburbs are also likely to benefit significantly from the shift to remote working:
Their numerous creative residents are likely to be in occupations prone to remote working.
Remote workers are likely to favor downtowns with strong CSD assets as they seek relief from the social isolation of their home offices, and they often also require business services and supplies.
Suburban communities are likely to have more relatively affordable housing, with more space per rental dollar than their regions’ center cities. This may attract many remote workers who are residents of the regions core cities. However, the affordability advantage might be blunted by rent deflation in the core city. For example, reports indicate that rents in Manhattan below 96th Street have already fallen by 20% to 30%.
Also recent research has shown that significant economic growth based on quality of life assets and the attraction of remote workers can lead to rising housing costs even in rural areas.
What will not be blunted, however, are the large numbers of people who prefer living in the suburbs, and they often include commensurately significant numbers of creatives, the group most prone to becoming remote workers.
It is fairly probable jobs will be decanted by a significant number of corporations from their prime big city locations to less expensive, auto accessible suburban satellite locations. Such office facilities will have cheaper rents than those in the core city downtowns, and provide corporate tenants places where their remote workers can come to get the social interactions they need to help their productivity, creativity and career advancement.
Recovering CSD Functions.
Many CSD venues have been hit very hard by the pandemic’s economic adversities. Almost all performance and exhibition venues have been closed or their public access severely limited. Many pamper niche operations closed permanently or shifted to operating online. Yet many of these operations, when allowed by local governments, have reopened on a limited basis, and the characteristics of some suggest that they will recover along with the local economy.
Two characteristics will determine those that will recover quicker and stronger and those that will not: if they are for profit operations and if they are large.
Small Arts Organizations. About 40% of the arts nonprofits are usually in the red financially, and mortally threatened by strong economic recessions and economic crises such as the present one. 6 Their business model is so dependent on contributions from numerous sources that their financial recoveries are seldom easy. So downtowns of all sizes are likely to have to wait quite a while for these smaller arts organizations to recover and contribute to their vitality.
Pamper Niches. In contrast, many of the pamper niche operations are for profits and relatively small – hair and nail salons, Pilates and yoga studios, dance schools, martial arts, studios, spas and gyms. They have relatively very low start up and operating costs, and little need to keep large inventories of goods on hand. While many were quick to close during an economic crisis, they are also relatively easy to restart or start anew as the economy improves. They are also the types of operations that often occupy large numbers of downtown storefronts, especially in the suburbs. Indeed, in many of our suburban downtowns there have long been complaints that these pamper niche operations were crowding out retail tenants because they could pay the higher rents landlords were looking for that small retailers found unaffordable.
Restaurants. Some of the most important CSD venues for all downtowns are their restaurants and bars. From early on in the crisis, there have been dire predictions of calamitous levels of restaurant failures – one foresaw the prospect of 85% of our eateries failing.7 These claims seemed to be supported by prior research showing that the average small restaurant only had enough cash on hand to cover their expenses for so few day, 16, that they were unlikely to stay open if they faced a major economic crisis – see table below. Months later, well into the current crisis, the Census Bureau’s Pulse surveys of small businesses have had consistently similar findings.8 One might have thought that by then their numbers would have declined as many went out of business. National survey data seems to indicate that about 20% of our restaurants may have closed do far.
The Center City district in Philadelphia recently published very interesting and well researched counter findings about restaurant closures.9 Well into the crisis, their survey found that only about 5% of their 1,078 restaurants had closed permanently, with another 19% closed temporarily. Just 19% were deemed fully opened and have indoor dining. Perhaps most interesting are the 600 restaurants (about 55%) that are classified as partially opened because they have outdoor dining, or only do take outs and deliveries.
My observations in the solidly middle income neighborhoods close to my home here in Queens, NY, also found a surprisingly low number of permanent restaurant closures. My communications with some suburban downtown managers yielded similar observations. The only reports of numerous closures I’ve found were about the eateries in the Midtown Manhattan CBD that are so dependent on tourist and office worker customers. The City’s Comptroller just issued a report that “found that more than 2,800 small businesses had permanently closed between March 1 and July 10, including at least 1,289 restaurants.” That would mean that about 5% of NYC’s restaurants closed, on par with the Center City findings.10
The fascinating question is: How are so many restaurants surviving so long when they never seem to have enough cash on hand to do so? CARES or other government program dollars? Owners not taking any salary? Dipping into their 401ks? Tapping extended family resources? Landlord forbearance? Public donations via gift cards, crowdfunding, etc.? The Center City research findings suggest a possible viable explanation: many are in some stage of operational hibernation – e.g., the 19% that are temporally closed and the 55% who are partially opened. Their reduced operational metabolism rates translate into a reduced need for cash. In turn, that means that the cash they have on hand can cover more days of operation. It also may mean that financial tools that are well within the restaurant owners control – such as dipping into 401ks, using credit cards, tapping family resources, etc. – can get many through the survival phase of this crisis if they hibernate. That also would mean that they are making substantial personal and family sacrifices in the hope that they again will earn meaningful annual incomes as they emerge from hibernation during the economy recovery.
If recovery means that these restauranteurs have to come out of hibernation and compete to again win adequate annual incomes, then it may prove to be a time period as, or even more, arduous than was the survival phase of the crisis. More restaurants may close because they will need to earn a lot more money to thrive than they did to survive, while they may have depleted the financial resources that helped them to survive thus far. Local market conditions will probably play a very important role in determining those eateries that will survive and those that will fail.
Households in the top income quintile (above $109,743 in 2017) accounted for about 38% of all the consumer spending for food away from home; those in the top two quintiles (above $66,898 in 2017) accounted about 61% of those expenditures. See table above. Moreover, so far into the crisis, employment in households with incomes above $60,000 has been far more secure than for those with lower incomes. Downtown restaurants able to easily tap affluent residential customers are more likely to survive the recovery than those that are not. The urbanized suburban downtowns tend to be in rather affluent market areas: in 2016, I estimated the annual household income at $188,000 for downtown Wellesley, MA; $131,000 for downtown Englewood, NJ; $152,000 for downtown Westfield, NJ, and $165,000 for downtown, Morristown, NJ. That will help their restaurants recover relatively quickly and substantially.
Let’s compare the prospects during the recovery phase of this crisis for restaurants in our superstar downtowns with those in our urbanized suburban downtowns:
Markets: The superstars must wait for the return of two very large market segments, office workers and tourists. Their residential markets may not be all that strong. Financially, that means many may have to wait quite a bit of time for their revenues and profits to return to the levels their owners were sacrificing to stay in business for. Their potential residential customers live mostly in nearby neighborhoods that are likely to have their own restaurants that are much closer to them. In contrast, the suburban downtown eateries rely mainly on the residential market segment that has never gone away and that savvy operators have been serving with takeouts, deliveries, and curbside deliveries during the crisis. These suburban eateries may also have office workers who are still present in the town in significant numbers, and others returning at a rapid rate as the virus’s impacts subside because of their reliance on autos to commute. New remote workers and newly decanted office installations may add significantly to their numbers. The suburbs’ consumer markets will start strong and may get even stronger. The superstars’ markets will start off very uncertain and require an unclear length of time to reach an iffy level of recovery. For example, though their office workerforces eventually may return, they’re very likely to be, at best, about 16% smaller in number.
Most arts tourists (tourists who attend arts events) visiting our large cities are not big spenders. A study of 21 study regions with populations over one million by Americans for the Arts that included the cities of San Jose, Dallas, San Diego, San Antonio, Phoenix, Philadelphia, Miami—Dade and Chicago found that, in 2016, the average arts tourist spent about $51.41 a day. See the table above. About 31% of that went for meals and drinks, averaging $16.05. Another $6.57 went for refreshments and snacks. While there certainly are significant numbers of wealthy arts tourists and they are likely to be among those who resume visiting our superstar downtowns fairly early, they will tend to go to the higher priced eateries. The less expensive eateries in these downtowns are less likely to see their tourist patrons return as quickly or as robustly. Their recovery is likely to be weaker and slower
Rents. During normal times, the lower commercial rents in suburban downtowns may have been equivalent to those in the superstar districts when the number of potential diners and their spending power are considered. Today, with the superstars’ disappeared market segments, increased risk, and uncertain rent deflation, suburban commercial rents look like a much better buy for all businesses, especially restaurants that are so rent sensitive.
Performing Arts Venues, Museums and Galleries. One might assume that the superstars are far richer in major arts, cultural and entertainment venues than the suburban downtowns, and that will help them to be better at attracting people back to their districts. In turn, that would enable them to better support local merchants. A closer look, however, reveals that their advantages may not be as strong as many might assume.
For example, superstar CBDs often have surprisingly few of these venues. In Midtown Manhattan, there are only two important museums, MoMA and the Morgan Library & Museum. The Metropolitan Museum, Whitney, Frick, Guggenheim, Neue Galerie, New Museum, Folk Art Museum, and many others are not. The major area for art galleries was in Soho, but is now in Chelsea and other parts of Manhattan. In Cleveland, the prestigious Cleveland Museum and Severance Hall, home to the Cleveland Symphony, are located about five miles from the heart of the downtown. It’s theater district, Playhouse Square, is about one mile away. Similarly, in Philadelphia, the Museum of Art, the Barnes and the Rodin Museum are outside the downtown district. MOCA and The Broad are In downtown LA, but LACMA. Hammer, Norton Simon, Annenberg, Huntington Library and Getty Center are not. Still, many of these superstar downtown museums are themselves superstars and that means that they are very dependent on tourists for visitation. For example, about 75% of MoMA’s visitors are tourists. See table above. Their full recovery and ability to activate the downtown will probably await the return of the tourists.
Strong art museums are seldom found in suburban downtowns, so how strongly these districts are activated is not dependent upon them, or their recoveries, or the return of lots of tourists.
Theater clusters are certainly to be found In some of these large downtowns such as Manhattan and Houston, as are performing arts venues such as Carnegie Hall and Madison Square Garden in Manhattan, the Kimmel Center for the Performing Arts in Center City Philadelphia, and the Music Center in downtown LA. However, in Manhattan, the Lincoln Center for the Performing Arts is located close to, but beyond the Midtown CBD. These venues are often considered world class, and that usually means that they, too, are heavily dependent on tourist ticket buyers. About 66% of the attendance of Broadway’s theaters are tourists, as is about 46% of Lincoln Center’s. Some observers claim that tourists will return once these venues open. However, getting Broadway shows ready to open will take time as will the scheduling and staging of other performing arts events. The Broadway League, for example, is now talking about reopenings starting around June 2021, but how long it will take to achieve a full recovery is still unknown.
These performing arts venues have another characteristic that poses serious problems for the downtowns and neighborhoods in which they are located. For very substantial parts of many days they are dead and inert, only coming alive outside for relatively brief moments before and after performances that occur usually during the evenings and a few afternoons. When inert, they diminish from, instead of contributing to, the sense of activation and pedestrian friendliness of the sidewalks they abut.
A number of these urbanized suburban downtowns do have sizeable performing arts venues, though most do not. In NJ, for example, The Count Basie Theater in Red Bank was the attendance leader among the state’s theaters in 2016 and 2017 selling 235,000 tickets. It has a budget of around $17,000,000.11 The Mayo Performing Arts Center in Morristown, NJ, has an annual attendance of about 200,000 and an annual budget of about $8, 000,000. It is a major component of the downtown’s strong and broadly defined entertainment niche that also includes a six-screen movie theater and eateries and bars that have annual sales above $100 million. The Bergen County PAC also has attendance in excess of 200,000 and an annual budget of about $10,000,000. These performing arts organizations have significant budget, and their audiences are not heavily dependent on tourists. Similar performing arts venues located in less affluent suburban markets have budgets well under $2,000,000 and lower attendance. The larger the budget, the more likely these performing arts organizations will survive through this crisis and recover. Once social distancing precautions are lifted, their primarily regional audiences, often from affluent households with members in creative occupations, can be expected to quickly return as their productions are presented. However, many of the weaker suburban performing arts organizations may struggle to recover or fall to the wayside—as will be the case pretty much everywhere.
Some Challenges and Opportunities Suburban Downtowns Will Likely Face
Downtown Cinemas Are Again In Danger. DANTH, Inc has been following the plight of downtown movie theaters for about 15 years. During that time streaming via cable or online was a persistent and slow growing threat to our traditional brick and mortar movie theaters. By releasing movies electronically either before or simultaneously with the theater releases the potential audiences of the theaters are substantially diminished. The Covid19 crisis has shut down movie theaters either completely or substantially. Streaming has grown enormously in utility, attraction and supporters among producers, and there is general agreement in the trades that it will be much more important in the future, and there is no going back. It’s a very cheap and efficient distribution channel that is unconstrained by the need for social isolation. Warner Bros. just announced that it will release all of its 2021 films on HBO Max at the same time that they open in theaters. Other studios are expected to soon follow.12
This Problem Is Especially Dire for Many Suburban Downtowns. How many movie theaters and theater chains will survive the crisis is a question of considerable interest to all types of downtowns, but much more important for those in the suburbs. For many, their movie theaters are their strongest arts/entertainment draw, especially after dark. Moreover, they invariably occupy strategically important locations in buildings that often are difficult to convert to other uses. Also, movie houses are among the most reasonably priced of all entertainment venues, and they have rather few user frictions compared to going to a sports event, concert or stage play.
Streaming may mean that it will be much more difficult for operators to make sufficient profits to recover from the crisis and stay in business long term. However, during the digital projection conversion crisis of a few years ago, many towns used community owned businesses to step in and save their cinemas. Suburban downtown leaders soon may find that tool can be used to save theirs’s, too. Moreover, a whole toolbox of tools to capture community value is emerging that also can be used. The leaders of these suburban downtowns should prepare for such a contingency since quick action is often needed to save these cinemas.
Unrealized Potential to Develop Strong and Well – Activated Public Spaces. By and large suburban downtowns lack popular, well-used downtown public spaces. Within their communities, the parks are generally located elsewhere. Additionally, even when they do have a physical public space downtown they are usually badly under-utilized, mainly purposed as adornments, ceremonial venues, and weakly scheduled event spaces. Where the missing vibrant public spaces are most surprising is in the urbanized suburban downtowns that have so many potential eager users and operations such as loads of strong eateries that mesh well with them.
In the past, this was just a missed opportunity, but with the need of these downtowns to have strong attractions that can again draw lots of people downtown, they well may be a savvy strategic move, or even a necessity. This need will also be reinforced if the local cinema weakens or closes.
The crisis induced closed streets and parklets can also provide these suburban downtowns a way of creating quickly and cheaply some needed spaces. Given that the sidewalks in many of these districts are fairly narrow, such projects can have a variety of immediate benefits. Still, the formula behind strong public spaces such Bryant Park can be distilled to scale to the smaller sizes and different characteristics of the urbanized suburban downtowns. A good place to start doing this is Andy Manshel’s new book Learning From Bryant Park.13 Here are a few things that interested downtown leaders might consider:
Location really matters. A public space on the periphery will have far fewer users and far weaker positive impacts on its surrounding properties and their uses.
How the space is programmed will have a far greater impact than how it is physically designed or how pretty it was meant to be. This is a major point that Andy strongly argues for.
Simple things really matter: as Holly White pointed out, if you want people to stay, they will need places to sit. Shade also counts. Andy stresses in his book that you don’t have to spend big bucks to succeed.
With programming, test things out and if they don’t work well, learn what went wrong, then either fix them, or do something better. Also, iterate, keep refreshing an improving the programming you have.
Just don’t think about events. Think also about how people-watching can be facilitated and enhanced. Public spaces can proved opportunities for people to do things, to let them become the space’s performers such as chess tables, boules courts, ping pong tables, reading rooms, ice skating rinks, carousels, swings, climbing rocks, etc.
Bottomlines
Urbanized suburban downtowns, with strong CSD functions, that are able to draw upon large numbers of creative class households, have growing numbers of remote workers, and maintain steady consumer market segments are well positioned to experience relatively strong economic recoveries from the Covid19 induced economic crisis. They can do even better if they take steps to protect their movie theaters and develop vibrant public spaces.
It’s about time that academics and economic development professionals realize that suburban downtowns do not grow or function in the same ways that our urban districts do. The suburban districts depend far, far less on being employment centers and more on being the central place for people to meet, enjoy themselves, help each other, buy necessities, and sometimes to buy non-necessities. Daytime workforces may be very important customers for district merchants, but their workplaces are far more often than not located beyond the district’s borders, and sometimes even in other towns. Their downtown housing is not driven strongly by live-workers, yet it can provide a very important in-close user/shopper base. Most of their shoppers also get to the downtown by car, and will continue to do so until AV shuttles and micro mobility vehicles provide viable alternatives.
ENDNOTES
1) Source: John Shapiro, formerly of Phillips Preiss Shapiro Associates, based on interviews with New Jersey Transit officials while working on multiple TOD projects in northern NJ, including for NJT.
3) N. David Milder. Remote work: An example of how to identify a downtown-related trend breeze that probably will outlast the COVID-19 crisis. Journal of Urban Regeneration and Renewal Vol. 14, 2, 1–20. Forthcoming.
4) The chart is from: Michael Sasso and Andre Tartar. U.S. Downtowns Yearn for Vaccines as Merchant Traffic Off 79%. https://www.bloomberg.com/news/articles/2020-12-03/u-s-downtowns-yearn-for-vaccine-as-merchant-traffic-falls-70?sref=mHw3n8zP
5) Christine Barton. BCG LUXURY PERSPECTIVE. Luxury First Look 2021| Where are we headed? September 2020. Presented at the Future of Luxury Conference, September 23-24, 2020, convened by Luxury Daily.
Contact: N. David Milder, Editor The ADRR — The American Downtown Revitalization Review 718-805-9507 [email protected]
THE CREATION OF THE AMERICAN DOWNTOWN REVITALIZATION REVIEW (THE ADRR)
There currently is no real professional journal for the downtown revitalization field. For many years, that has been strongly lamented by many of the field’s best thinkers. To remedy that situation, a band of accomplished downtown revitalization professionals are creating The ADRR. It will be a free online publication, appearing four times each year. The target date for the debut issue is now set for the June 1-15, 2020 timeframe, with the second issue aimed for the Sept 7-14, 2020 timeframe.
This ADRR is intended to be a lean and mean operation, based totally on the availability of free online resources and the time, energy and elan contributed by its authors, advisory and editorial board members, and its editor.
How to Subscribe to The ADRR
Those interested can now visit The ADRR’s website, www.theadrr.com , where, on the home page, they can sign up to become subscribers. This enrollment places the subscriber on a MailChimp mailing list so that they can receive New Issue Alerts (see below).
How Issues of The ADRR Will Be Distributed.
New Issue Alerts, containing the Tables of Contents of issues and links to their downloadable pdfs of articles are sent to subscribers via a MailChimp email blast and posted to the ADRR’s website. Each issue’s pdf files initially will be stored in a folder in ND Milder’s Dropbox account from which they can be downloaded. Subscribers can download only those articles they want to read and whenever they want to read them. The ADRR also can be found via Google searches.
The Content We Are Aiming For. Only manuscripts about major downtown needs, issues and trends will be considered for publication. They will be thought pieces and not just reports about a downtown’s programs and policies that its leaders want to brag about. Articles must have broad salience and their recommendations broad applicability within the field. The “voice” of The ADRR will be anti-puff, and very factual, evidence driven, though not dully academic. Discussions of problems and failures will be considered as relevant as success stories if, as so often is the case, something substantial can be learned from them. The ADRR will not avoid controversial issues.
Also, the focus of The ADRR will not be overwhelmingly on our largest most urban downtowns, but also provide a lot of content and relevant assistance to those in our small and medium sized communities, be they in suburban or rural areas.
Who Will Write the Articles?
Hopefully, they will be from people in a broad range of occupations – downtown managers and leaders, municipal officials, academics, developers, landlords, businesspeople, consultants, etc. — who have significant downtown related knowledge and experience.
Curated Articles and Wildflowers. Initially, the ADRR will solicit articles to prime the content pump. Once The ADRR is up and running some articles will continue to be solicited on topics deemed a high priority by the editorial board members. Each board member can select a topic to curate an article on and seek the author(s) to write them. However, there still will be a continual traditional general call for submissions (wildflowers) focused on subjects selected by their authors. All submissions, curated or wildflower, must demonstrate sufficient merit to warrant publication in The ADRR. All submitted articles will be reviewed by board members. We hope to see many submissions!
Article Length and Author Responsibilities.
There will be short reads and long reads. Articles of 1,500 to 5,000 words will be considered. Multi-part articles of exceptional merit and salience will also be considered. What counts is their quality, not their length. Authors must have their articles thoroughly proofread prior to submission. Poorly proofed manuscripts will be rejected. Guidelines for submissions may be found on The ADRR website.
Publication Schedule:
Published four times per year, with a minimum of 5 articles in each issue. Given that this is an online publication, from a production perspective, the number and length of the articles is not a particular problem. However, from an editorial and content management perspective, the number of articles and their lengths can quickly become burdensome.
How It Will Be Organized.
The ADRR will be published by an informal group for its first year, with no person or group having ownership.
Editor. During the ADRR’s first year, N. David Milder has volunteered to serve as its editor.
The Advisory/Editorial Board :
Jerome Barth, Fifth Avenue Association
Michael J Berne, MJB Consulting
Laurel Brown, UpIncoming Ventures
Katherine Correll, Downtown Colorado, Inc.
Dave Feehan, Civitas Consulting
Bob Goldsmith, Downtown NJ, and Greenbaum Rowe
Stephen Goldsmith, Center for the Living City
Nicholas Kalogeresis, The Lakota Group
Kris Larson, Hollywood Property Owners Alliance.
Paul R. Levy, Center City District, Philadelphia
Beth Anne Macdonald, Commercial District Services
Andrew M. Manshel, author
N. David Milder, DANTH, Inc
John Shapiro, Pratt Institute
Norman Walzer, Northern Illinois University
Articles in our first issue that will be published in June 2020
Michael Berne, MJB Consulting, Working Title, ” Bringing Downtown Retail Back After COVID-19”
Roberta Brandes Gratz, “Malls of Culture.”
Andrew M. Manshel, “Is ED Really a Problem?”
N. David Milder, DANTH, Inc., “Developing a New Approach to Downtown Market Research Projects – Part 1.”
Aaron M. Renn, Heartland Intelligence, “Bus vs. Light Rail.”
Michael Stumpf, Place Dynamics, “Using Cellphone Data to Identify Downtown User Sheds”.
The Spotlight: “Keeping Our Small Merchants Open Through the COVID-19 Crisis”
Katherine Correll, Downtown Colorado, Inc.
David Feehan, Civitas Consulting
Isaac Kremer, Metuchen Downtown Alliance
Errin Welty, Wisconsin Economic Development Corporation.