Introduction
While downtown leaders could benefit greatly from impact studies done on the entertainment venues located in their districts, they will find that far too many either geographically do not provide downtown relevant information, employ questionable research techniques and/or fail to look at key downtown-related impact variables. Much of this is because they too often lack a downtown perspective, one that is based on how a successful downtown works and that responds to the reasons so many downtown leaders and EDOs want strong entertainment venues in their districts. Such a perspective can not only help establish the needed geographic analytical lens, but also spotlight which impact variables are really important and explain why. Some impact studies seem to select variables not because they have high policy or program importance, but because there are available relevant data.
The Use of I-O Models. A lot of these impact studies primarily rely on input-output (I-O) economic models, a well respected tool among economic development analysts. However, their findings tend to be the least useful for downtowners. Most importantly, they focus on a geographical unit — the county, large city or region — that is far larger than any downtown, requiring a secondary analyst to work really hard if anything with downtown relevance is to be culled from them. They also often state the impacts in terms of variables that may be very pleasing for economists or funders or those giving projects government approvals, but do not touch upon downtowner economic concerns about district entertainment venues. Far too often, they use questionable estimates of arts audience expenditures. This variable is a critical starting point for the I-O models and a subject of immense interest for downtowners. The consequences of the questionable estimates follow the old adage: garbage in, garbage out. Studies that use such problematical data are of little use for their arts venue clients, even less for downtowners.
Real Estate Impacts. Other studies focus mainly on the entertainment venue’s impacts on nearby real estate. In contrast to the I-O model based studies, they tend to have significant geographic relevance and analytic value for downtowners. They are among the most useable by downtowners because they speak to major downtowner concerns and do not have a problem with their geographic focus. However, the real estate focused analyses frequently have impact attribution problems, e.g., how much of the impact is due to the arts venue and how much to other forces and agencies present in the area. It isn’t so much that there are methodological barriers to overcoming this problem as that the issue is so often simply ignored. Also, they too often overlook impacts related to audience growth and expenditures that are so important to downtowners. On the plus side, the needed real estate data are usually readily available and not that expensive to obtain.
Comprehensive Approaches. Some entertainment venues, e.g., MASS MoCA in downtown North Adams, MA and downtown Chicago’s Millennium Park, have had their impacts assessed by multi-dimensional approaches developed in academia, e.g., Williams College and Texas A&M. Their studies have yielded the most useable information for downtowners about an entertainment venue. For example, the analyses done by the Center for Creative Community Development (C3D) at Williams College of MASS MoCA’s economic impacts on its host city combines:
- The output of a county focused I-O model that is somewhat useful for the business people in North Adams interested in knowing how the spending of the museum and its guests work their way through the regional economy they are part of
- An analysis showing that the museum has made North Adams a more desirable place to live, with property values rising with increasing proximity to the museum
- An analysis of the museum’s impacts on the opening of more new businesses, higher employment and higher salaries in the town
- The mapping of the museums visitors and graphically displaying what is the museum’s trade area (1).
However, other impact studies done for some very large and well-known entertainment venues have combined an I-O analysis with some real estate analysis, but they have not had similar methodological strength, analytical depth or potential utility for downtowners.
KISS. While C3D utilized two rather sophisticated research techniques – the I-O model and an hedonic analysis to model neighborhood improvement through property appreciation — it also utilized other, simpler, types of data, such as counts of museum visitors, the block groups of visitors and their associated demographic data, and the data reported in the Census Bureau’s Zip Code Business Patterns about the number of firms, their number of employees, and payrolls. The visitor mapping is, in effect, an identification of MASS MoCA’s trade area that includes tourists as well as local residents. The ability of MASS MoCA to bring many visitors in from places well beyond its residential trade area is certainly an “economic impact” of immense interest to downtowners. Such analyses demonstrate the value of keeping in mind the Keep It Simple, Stupid principle in downtown entertainment niche impact studies.
Most of These Impact Analyses Are Done to Achieve the Objectives of Other Organizations and Consequently Often Lack Downtown Perspective or Relevance. Downtown entertainment niches can contain a wide variety of constituent venues, e.g., stadiums, arenas, PACs, theaters, cinemas, restaurants, bars, night clubs, coffee shops, museums, concert halls, parks, other outdoor and indoor public spaces, etc. Most of the impact studies have been done for the venues that need very substantial political support and/or very significant financial donations/ subsidies/ incentives: e.g., stadiums and arenas, arts venues, parks and other public spaces. A prime objective of these studies is to persuasively demonstrate their positive impacts on the local economy and community. This objective is commonly joined to the expectation that such evidence will spark greater financial support and/or stronger political backing or project approvals. Needless to say, the impact outcomes reported in the publicized studies are, unsurprisingly, habitually positive. Their sponsors apparently are getting what they need and pay for.
It is notable that far fewer impact studies are done on the for-profit entertainment niche elements, e.g., restaurants and watering holes, nightclubs, cinemas, theaters, etc. That should change because they are so often powerful contributors to a downtown entertainment niche. For example, a restaurant niche in one Little Italy on the east coast has over $80 million in annual sales and is a very strong tourist magnet: 20.2% of its patrons live 20-40 miles away and another 28.5% live 40+ miles away (2). This study was based on an analysis of patrons’ residential zip codes that was very similar to C3Ds analysis of MASS MoCA’s visitors.
And so….Some useful pieces of information for downtowners still can sometimes be gleaned from these studies. Also, downtowners and their EDOs would probably benefit from knowing what an entertainment venue impact study that meets their needs might look like. Consequently, the remainder of this article aims at:
- Outlining a “downtown perspective” that frames the rest of the analysis presented below
- An overall assessment of these studies
- Identifying, as the discussion proceeds, the types of useful information for downtowners that can be culled from the existing studies of the impacts of downtown entertainment venues, even if they lack a downtown perspective
- Outlining an approach for assessing the economic impacts of entertainment venues that is based on a downtown perspective
- Identifying, as the discussion progresses, the types of data that can be used in such analyses. Many are relatively easy to collect. Downtown EDOs may already be gathering them, but do not realize they are measures of economic impact.
A Stab at Describing a Downtown Perspective for Such Impact Studies
Though they may be located in a downtown or large commercial district, the organizations that own/operate arts venues, parks, other public spaces, arenas and stadiums rightfully and understandably may want to learn about and publicize their economic impacts in a larger geographic area. Their impact studies consequently treat them as the impacting agents and seek to show that their influences are strongly positive in a whatever geographic unit – city, county, region –is needed to meet these objectives and/or required by an analytical tool.
In contrast, downtown leaders, EDOs and business operators start with concerns about how their specific and smaller geographic area will be impacted by these entertainment venues. The downtown geographic focus is critical. Downtowners also have the perspective of impact recipients. A district may or may not benefit more by having a significant entertainment venue locate within it than if it had located elsewhere in the region. The downtowners’ support for locating an entertainment venue in their district or for maintaining or enhancing the strength of those that are already there – almost always readily obtained — is based on expectations that their impacts will be significantly positive for the downtown’s businesses, property owners and/or residents.
Most important are the themes that usually characterize the downtowners’ impact expectations and provide the rationale for their support. Readers are invited to think about the downtown entertainment venue projects they may have been involved with or read about. Odds are the downtown advocates for those projects raised the following impact themes. These themes imply the use of certain variables and data:
- Downtown Customer Spending Power and Merchant Revenues Will Increase. This promised increase in the number of downtown visitors with stronger spending power is often the most important factor for downtown leaders and business owners favoring entertainment venues in their districts. This theme can be further decomposed into the following points:
- The entertainment venues will bring more people downtown. That means that simple audience counts are an important variable and way to measure this economic impact
- The audience created increase in downtown visits will translate into more money being spent in the district to the benefit of the owners of local retail shops, restaurants, bars, hotels, etc. This means that reliable data on audience downtown spending and data on downtown sales revenues from the arts audience(s) are two more important economic impact variables. Getting reliable about both audience spending and retail related sales can be difficult
- Not only will there be more visitors, but they are likely to be those with more disposable income to spend. Data on the audience’s household incomes compared to those of non-arts audience downtown visitors, and preferably over time, is a way to measure this impact
- How the Downtown Works. The increased customer traffic and venue operating hours will make the downtown more active and attractive during both the day and evening hours:
- There will be more pedestrian traffic and events, which can be measured by pedestrian counts on sidewalks adjacent to the arts venue and by counts of the number of events the venue has added
- It will induce the merchants nearby to lengthen their operating hours past 6:00pm, when many arts venue audiences arrive. This can be easily measured in many ways, including simple field observations or a quick call.
- There will be a consequent increased sense that the downtown is vibrant and exciting. This can be measured by a traditional opinion survey or a content analysis of what is being said about the downtown in selected media, both traditional and electronic
- Strategic District Properties Will Be Improved. The specific properties occupied by the entertainment venues — that are often significant in their size , strategic location, historical importance and/or architectural merit – will be redeveloped, through new construction or renovation, with consequent increases in market value, rents and attractiveness. The latter requires opinions, so some sort of survey or content analysis would be required. Moreover, the real estate improvements can also mean fewer blank walls and other pedestrian discontinuities, less intrusive vehicle parking, or better utilization of mass transit assets. The reduction in the linear feet of pedestrian discontinuities is one relatively easy measure to employ. Increased transit boardings and debarkings would be another simple and useful measure
- The District Will Be More Appealing to Individuals. The strong entertainment venues will make the downtown, overall, a more appealing place to live and work as well as visit. Counts of increased residents, non-arts visitors, retail customers, etc. as well as of rising rents and property values can be used as indicators of greater appeal if some assumptions are made about the causal link. Still, one can argue that “appeal” is a psychological factor and one better measured through opinion surveys that explore why people moved into the downtown or decided to visit it. Then, it is the individual visitor or resident who establishes the causal link between the venue and their actions, not an analyst postulating it
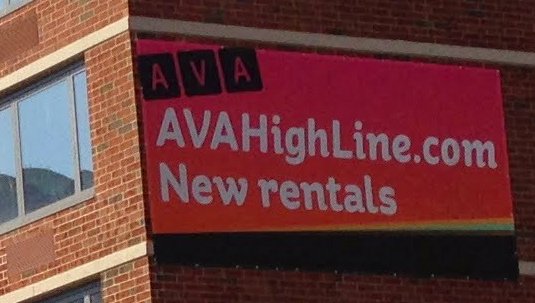
Figure 1. A sign on a new apartment building abutting High Line Park
- The District Will Be More Appealing to Businesses. The locational desirability and market values of nearby properties also will increase because of the new venues, their physical appeal and the additional customer traffic they draw. This, in turn, will attract new commercial and residential tenants and spark new development projects. Here, too, there are behavioral indicators such as rising rents and greater investments in downtown properties. A good and easy to collect tell about a venue’s appeal are the significant buildings and businesses that coopt its name in their addresses or advertising. For example, in NYC, all the nearby office buildings that use Bryant Park in their addresses, the Bryant Park Hotel and all the new residential buildings along the High Line Park that have the park in their names or advertisements (see Figure 1). Better, yet, are the landlords who report that their vacancy rates are down and rents are way up because of the entertainment venue that is across the street or down the block, as the owners of the Grace Building have reported about Bryant Park (3). Another good data gathering tool are surveys of recent new commercial tenants that investigate the reasons why they selected their new locations.
One impact theme that is seldom raised among downtowners is how many of the dollars spent by the entertainment venue will be captured by other downtown businesses. Their focus is usually on what the expenditures of the audience will bring in. Probably this is because, for one reason or another, the expectation is that this arts venue revenue stream will not be all that important. Although contrary to basic economic development tenets, another impact theme that is not often heavily noted by downtown advocates of an entertainment venue is the jobs in the region the venue would directly or indirectly provide – except as these workers might be downtown customers.
Implicit in this collection of impact themes is an understanding of the downtown as a distinct socio-economic system based in a very specific geographic area that is strongest when it:
- Contains, in a compact walkable area, a wide range of economic functions and activities, e.g. retail, entertainment, professional and personal services, education, healthcare, etc.
- Attracts significant numbers of residents, workers and visitors who engage in multi-destination, multi-purposed visits and walk from one destination to another
- Makes walking between destinations and the use of public spaces safe, interesting and attractive. This facilitates significant levels of pedestrian traffic and high levels of multi-destination trips
- Provides commercial and residential spaces that are attractive to tenants and tenant prospects
- Has mass transit assets to take people to and from the downtown
- Facilitates district business people to make sales and have their assets appreciate in value.
An Assessment, From a Downtown Perspective, of Economic Impact Studies Done on Downtown Arts Venues That Use I-O Economic Models (Multipliers).
Since the early 1990s, there has been a rising tide of studies of the economic impacts of arts and cultural institutions that rely on using I-O economic models (4). Such a model “traces how many times a dollar is re-spent within the local economy before it leaks out, and it quantifies the economic impact of each round of spending” (5). They usually start with two key data points: the annual expenditures of the arts venue being studied and an estimate of how much the venue’s audience spends within its geographic study area. As the data in Table 1 demonstrate, see below, the venue’s direct expenditures tend to be greater than the related expenditures of its audience members. The data from 15 museums studied by C3D, shows that the museums themselves, on average, accounted for about 64% of the direct expenditures. The Table also shows data collected from surveys of arts and culture organizations and onsite surveys of their audiences in139 study regions across the nation by the arts advocacy organization, Americans for the Arts (AftA). Within each of these study areas there are usually several arts organizations. The AftA surveys indicate that, on average, about 55.7% of the direct expenditures are accounted for by the arts venues. A lot of the 8.5% difference between these two data sources probably can be accounted for by the fact that AftA counts the expenditures of both resident and non-resident audience members, while C3D’s estimates are based only on AftA data for non-residents reported in the study area fitting the population of the community in which the museum is located.

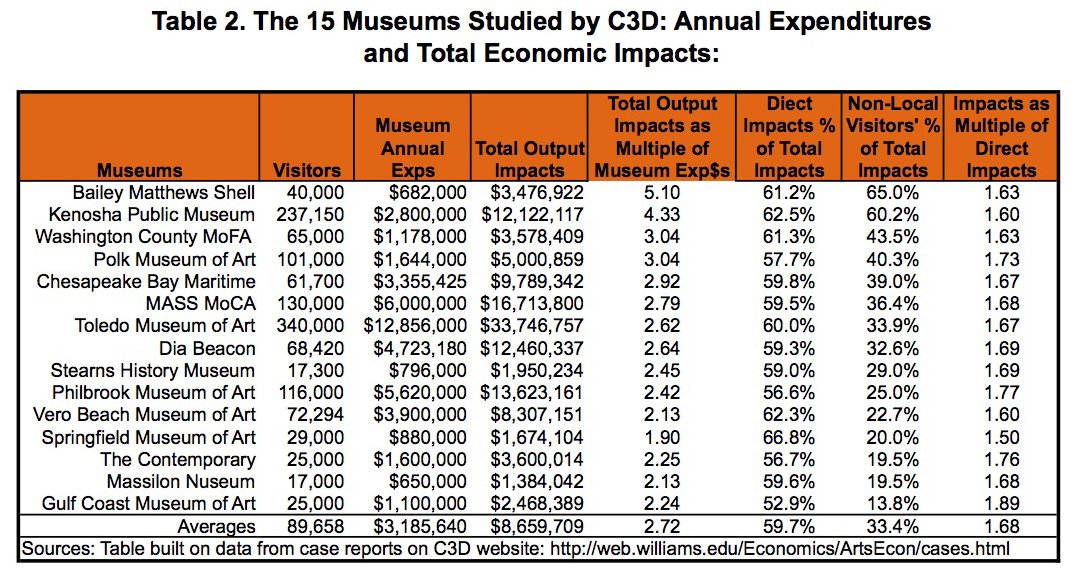
These models are attractive to impact analysts and report sponsors because, by the very nature of their stricture, they should be able to identify much greater impacts than other analytical approaches. They have a longer causal chain aimed at including ripple effects. They not only look at the “direct impacts” in terms of the total annual direct expenditures of the venue and its audience, but also their “indirect impacts”, e.g., how these expenditures are “re-spent“ by recipient companies (excluding wages), and also the “induced impacts” that look at the growth in household incomes and jobs that are created by the direct and indirect impacts. Table 2 shows, for the 15 museums studied by C3D, how the I-O models can demonstrate a very strong economic clout that goes well-beyond an arts venue’s own expenditures. The total impacts of these museums, for example, averaged being about 2.72 times greater than their annual expenditures, with the highest having a multiple of 5.1.
Of course, the arts venues’ audiences’ related off-site expenditures being included in the analysis significantly increases the magnitude of the computed total impacts. The 15 museums’ non-local visitors (i.e., tourists), on average, accounted for about 33.4% of their total impacts’ dollar values, though they ranged from a low of 13.8% to a high of 65%.
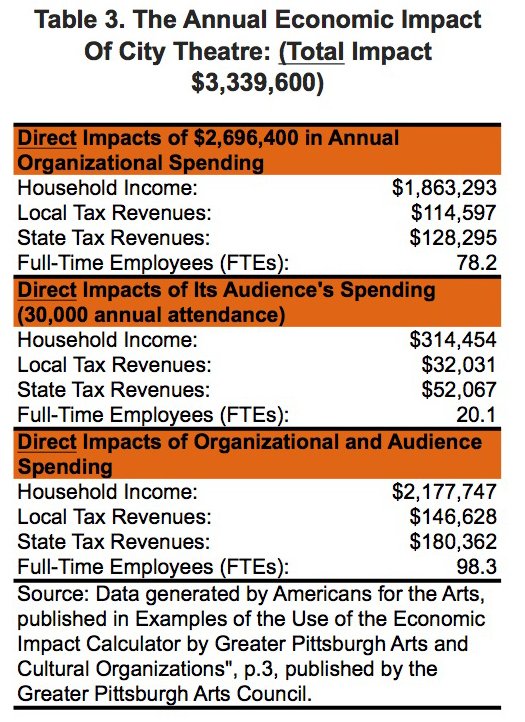
The Variable and Report Language Problems. Quite frankly, it is doubtful that downtown leaders will willingly give much attention to reports and presentations that use terms such as direct, indirect and induced impacts or outputs or economic activity. Its also doubtful that this type of vocabulary will help persuade arts venue funders, be they in government, foundations or private businesses. Table 3, below, shows the AftA’s estimates of the impacts of the City Theater on the economy of Greater Pittsburgh (Allegheny County). Again, the two key initial impacting variables studied are the annual expenditures of the arts organization and the expenditures of the people who attend its events. However, the variables selected to represent and measure the effects are household income, local tax revenues and full-time job equivalents. This vocabulary is less jargony, more tangible and speaks directly to important business and political concerns.
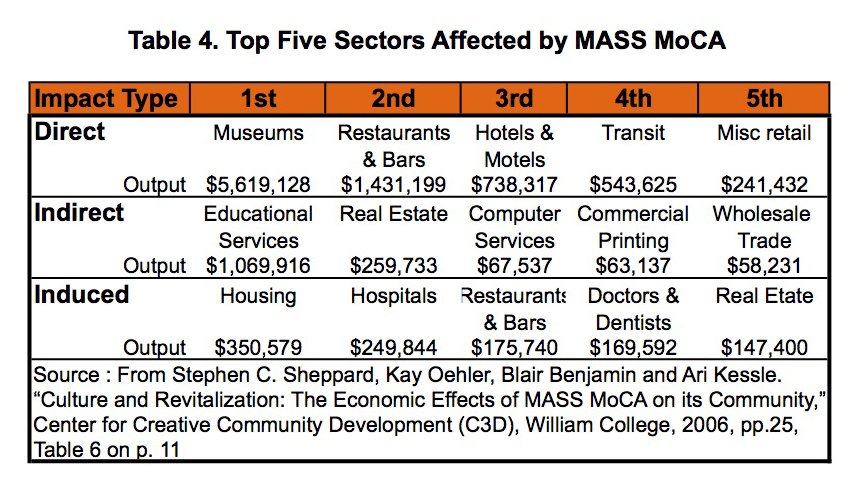
Nonetheless, for many downtowners, it still does not tell them what they most want to know. How does the arts venue bring people and their dollars into the district? How does it add to the revenues of their businesses? The vocabulary used by the C3D team in their assessment of MASS MoCA’s impacts on North Adams, comes much closer to meeting downtowner needs because it shows the impacts broken down by industry and type of impact. Furthermore, it limits the number of industries presented to those with significant impacts and does not give the complete and long list of industries an I-O model analyses. These data can help downtowners know more about how the studied arts venue is affecting a primary economic market in which they compete, the county or region. Such data can alert the downtown firms in these positively impacted industries that there are more dollars they can compete for as a result of the arts venue, but these data cannot specify how many dollars will be captured by downtown firms.
Some research suggests it’s only a very small portion. For example, a study done in 2011 on LCPA’s Fashion Week (that really lasts about a month) by students at the Fordham University Graduate School of Business. It found that about 10% of the spending generated by the event goes to Lincoln Square neighborhood businesses (6). The Fashion Week events, however, differ significantly in two respects from other LCPA events: they are relatively short, lasting under 30 minutes, and most occur during the daytime. Consequently, their audiences are likely to be less time-pressured and probably more likely to stroll around the neighborhood and to spend money in its shops, eateries and watering holes. The audiences for other LCPA events probably spend even less than 10% of their event related expenditures in the neighborhood, because they lack the time to roam the neighborhood.

Further support for the limited neighborhood impact hypothesis is provided by looking at the characteristics of the annual expenditures of arts organizations. Table 5 shows the annual expenditures of the Paramount Theater in Rutland, VT. Performance expenses, the payroll for its eight employees, occupancy costs and depreciation account for about 91% of the Paramount Theater’s annual expenditures. Given the theater’s programing, that is very heavy on individual and small group performances, most of the performance costs probably go for paying out-of-town talents. The needed sets and costumes are probably produced by firms that need low-rents and sometimes large spaces; their location in downtown Rutland is probably iffy. The theater’s staff is small. Even if they all lived downtown, their economic impact would be marginal. Their daytime local expenditures are also likely to be relatively small. Banking and professional services are likely to be found in downtown Rutland, but they only account for about 3.3% of the Paramount’s expenditures.
If the biggest source of an arts venue’s economic impacts, its direct annual expenditures, is highly unlikely to end up in the tills of nearby downtown businesses, then even if an I-O model could be built for a downtown, it would not provide very much additional illumination.
For the Downtown EDOs that do want to know about the impacts of an arts venue’s expenditures on other downtown businesses, the best way to research this issue is to do a simple survey of their downtown businesses operators. The questionnaire should be very short and not ask questions that require specific answers in dollars, if a decent response rate is to be successfully achieved. The more work you require your respondent to do – to answer a lot of questions or to provide very specific answers that really requires them to do research or makes them worry about confidentiality – the more likely they are to opt out of the survey. DANTH has done many surveys of small and medium sized businesses and it quickly became apparent that their owners/operators close up when asked to reveal specific data about their firm’s sales revenues or expenditures.
Answers in dollars probably would not be any more actionable for downtown EDOs or their members than those that are ordinal, i.e., that rate things in rank order and for which ordinary words can be used to do the ranking. For example:
- None, some, a lot
- Not significant, somewhat significant, very significant
Sometimes, the preciousness of numerical precision or the magic of impact multipliers makes us captives of otherwise questionable research techniques because they can generate data in discretely measured units, such as dollars or miles, or that are scaled. We then are prone to ignoring the simpler level of data needed for our decision-making, which often also can be easier and cheaper to obtain.
ENDNOTES
1. Stephen C. Sheppard, Kay Oehler, Blair Benjamin and Ari Kessle. “Culture and Revitalization: The Economic Effects of MASS MoCA on its Community,” Center for Creative Community Development (C3D), William College, 2006, pp.25
2. From a 2011 DANTH, Inc. project report.
3. See for example Howard Kozloff “The Payoff from Parks,” Urban Land August 29, 2012, http://urbanland.uli.org/economy-markets-trends/the-payoff-from-parks/
4. See for example: Rosemary Scanlon and Richard Roper, “The Arts as an Industry: Their Impacts on the New York-New Jersey Metropolitan Region.” The Port Authority of New York & New Jersey. October 1993, pp.77.
5. Americans for the Arts, “Arts & Economic Prosperity IV: National Statistical Report,” p. A6
6. Eric Wilson, “Fashion Week’s Impact, by the Numbers,” New York times, September 6, 2011 http://runway.blogs.nytimes.com/2011/09/06/fashion-weeks-impact-by-the-numbers/