For many years I have thought that older adults — those over 50 — represented a valuable under leveraged asset for many downtowns in cities with populations roughly in the 20,000 to 100,000 range. Given their increasing population size and financial power, I have written an article advocating the development of downtown older adult member communities arguing that they would facilitate much needed greater functional diversity and activation. You can read that article below.
I am very happy to share this article on downtown multifunctionality/ functional diversity that was recently published in the JURR, a British journal focused on urban renewal and regeneration. It reflects my most recent thinking on this subject, as well as my efforts to add some analytical heft to it while also getting more people to find it of interest and importance.
Here’s the abstract: “In the large downtowns in the US, the adaption rates and impacts of remote work have been strong and sparked efforts to make these districts far more multifunctional, especially by adding lots of new housing. While comparable city centres in Western Europe have not seen remote work have similar impacts on office occupancy, multifunctionalism has long been heralded as a factor that makes them strong. For example, it underpins their two key competitive advantages of dense agglomeration and the generation of many multipurpose trips. While multifunctionalism is a familiar concept and is often mentioned in relevant publications, there is amazingly little written about it theoretically, and little to no empirical research done on it. I took on that topic in a recent paper in which I noted that how downtown multifunctionality is ‘packaged’ in the physical containers in which the venues of these functions are activated, and how they physically relate to each other, are very often the key factors in determining whether efforts to make a downtown more multifunctional will succeed. I also argued that a function must have very magnetic destinations active in these containers. This paper focuses just on the topic of packaging functions and is an expansion of my prior analysis that covers much new ground.”
I am proud to share with you my article “How Our Downtowns’ Three Most Important User Groups Can Help Their Sustained Recoveries” that was recently published in the IEDC’s Economic Development Journal. It focuses on downtown workers, residents and visitors and covers our largest downtowns as well as those of more modest size. It presents several analytical conclusions that counter conventional wisdom. For instance, while the media have focused on the reduced presence of downtown workers in our largest downtowns, the drop in downtown visitors was far larger, and smaller downtowns were less impacted by remote work because they are not usually the primary locations for their cities’ office prone workers.
The article relies heavily on data from the CCD’s Downtowns Rebound project led by Paul Levy, Placer.ai, OnTheMap, and my field experiences, as well as a dataset created by Bill Ryan on all the cities with population between 25,000- 75,000 in seven Midwest states.
I have really had it with the Doomers, those who argue that our large downtowns are doomed to failure and diminishment.[1] It’s time to call them out for being the downtown ignorant Chicken Littles that they are.
Their Covid crisis instigated doom loop analysis has been a considerable worry for many municipal business and political leaders, since it predicts not just the decline, but the end of our large downtowns’ ability to be thriving business districts. It also has been almost as good a story for grabbing public attention for many media outlets as fires, riots, and other serious calamities. Of course, it also has been raw meat for some authors who seek greater notoriety. The legitimacy of this argument seems to mistakenly be seen as deriving from the fact that academics and wannabe urban pundits have been its leading proponents and some even used real data analyzed by sophisticated statistical tools. However, the most worrisome parts of the argument are really based not on any data or fancy statistical tools, but on the Doomers conclusions and assumptions. The Doomers thinking displays an enormous ignorance about what downtowns are really like and how they operate. The media writers and their editors who bought the Doomers’ analysis are little better.
The Conclusion of a Downward Spiral. Doomers cite the very low occupancy rates found in the office clusters in our largest downtowns – too often based often on questionable data, mind you — and predict consequent enormous losses in lease revenues and building values. This they then argue will mean the failure of lots of office buildings. Investing in downtown real estate and leasing downtown spaces consequently will be much less attractive, and this will have very adverse effects on other downtown sectors such as retail and personal services. City tax revenues will also drastically fall, with a consequent reduction in essential services, precisely when quality of life problems are surging. Overall, these downtowns will thus become much less attractive in a continually degrading manner.
Frankly, much of this part of the Doomers analysis is valid. Major downtown office sectors have undeniably been hit hard by the pandemic, and many outmoded buildings are indeed doomed. But that has happened several times in the office sector since the 1980s, if not as strongly. Quality of life problems have surged both in frequency and visibility during the crisis. However, the Doomers turn the current office sector downturn into a unique event by making an unwarranted analytical leap, based on little to no probative evidence: they claimed that these downtowns would fall into an unstoppable downward spiral, AKA the doom loop. They did not entertain any possibility of a recovery of any kind such as:
The downtown’s office sector does indeed shrink, maybe even by 20% to 30%, but then it stabilizes at this new equilibrium point that is still a very consequential 70% to 80% of its prior size. But downtown growth is now engined by other sectors such as housing, personal services, entertainment and culture.
After stabilizing, the office sector starts to grow again.
The Doomers’ data have no probative value for determining whether the doom loop scenario or one of the recovery scenarios is the more probable outcome.
Their major justification for predicting the doom loop seems to have been that quality of life issues — e.g., rising crime rates, more homeless – were occurring along with fewer downtown visits and lots of business closures were occurring early in the crisis. Yes, in the past these issues did cause downward spirals in many downtowns. What is interesting is that these problems often emerged in the 1970s and 1980s in fairly large downtown office clusters that stayed successful in spite of them. Ironically, the fortress designs of these clusters often induced the very fear of crime they were meant to protect against. In time, many districts overcame these problems and the downtowns office sector became more prosperous than ever before! Downtown Manhattan and Charlotte’s CBD are two examples that come to mind.
The Doomers choice of the gloomy scenario also shows an ignorance about many characteristics of our large downtowns and it keeps being eroded by hard evidence of downtown recoveries, some of which appeared early in the crisis:
Historically, large downtowns have proved to be amazingly resilient. They survived the Great Depression, and some like Midtown Manhattan even had trophy projects like the Empire State Building and Rockefeller Center developed during that very stressful era. Many also came roaring back after the mid 1990s after having struggled during the 1970s and 1980s.
Downtowns in some states, such as Texas, have long had their office sectors go through serious boom and bust periods because of overbuilding, exhibiting a kind of cyclical resiliency.
Back around the Great Recession the growing appeal of open offices was supposedly making many older office buildings outmoded, much as remote work is said to be doing today. That was supposedly causing great havoc within the real estate industry. If memory serves me, office growth soon returned with a happy vengeance. The office sector, just like other sectors, will experience periodic serious disruptions caused by capitalism’s process of creative destruction. This process is one of both mass disruption and strong recovery.
Nonresident office workers only account for a relatively small proportion of downtown visits. Almost two-thirds of these visits are accounted for by visitors who neither work nor live in a downtown. These visitors were quick to stay away from our downtowns as Covid became a national emergency, and accounted for a far greater proportion in the drop of downtown visitation than did the office workers, BUT they were also the quickest to return in very substantial numbers.[2] This quick return indicates that the causation of this decline in visitor visitation was situational in nature, not structural. In contrast, the slow return of office workers is consistent with structural causal factors being present. By October 2021, data from Placer.ai was already showing strong signs of recovering downtown visitation. Still, Doomer gloom continued to be published.
Office workers also account for a relatively small portion of a downtown’s retail sales. Tourists and residents are the big retail shoppers and spenders. Many downtown retail problems were existing precrisis, caused by the strong wave of creative destruction that industry has been experiencing for about a decade.
So the ability of a declining office sector to hurt retail sales and decimate downtown pedestrian activity is far more modest than the Doomers suggest.
Downtown return to office rates (RTOs) have risen from about 30% early in the crisis to a median of 65% in our large downtowns. That’s not evidence of a downward spiral, but of a significant partial recovery, though the extent of the final recovery is still uncertain.
Midtown Manhattan, once thought to be a potential victim of an office generated doom loop recently was the “hottest office market” in the US in the first half of 2023 that had “far and away” the most absorption of office space.[3]
In downtown San Francisco, the process of wringing out excessive values from troubled office buildings seems to have started, with prior owners and bankers taking their losses and the new owners attracting new tenants with lower and more affordable rents.[4] This process promises to help increase downtown office occupancy rates, as well raising office worker foot traffic and consumer spends.
Greater downtown visitation is known to help reduce the fear of crime, and drive bad uses out of the area. This is something about which the Doomers appear to know nothing. A recently released terrific report by a Paul Levy led team at the Center City District in Philadelphia found that: “The cumulative average of visitors across the (nation’s largest) 26 downtowns by the end of Q2 2023 back at 79% of Q2 2019 levels; workers of all kinds back at 66%; and residents at 120%.”[5]The direction of downtown visits is obviously strongly upward, not downward. That will help make these areas seem more activated and alive, while helping to reduce the fear of becoming a crime victim. The quality of life conditions in these downtowns are not on any definitive downward spiral, though serious issues certainly remain unresolved.
The title of the CCD’s report, Downtowns Rebound, sends a very important message about our large downtowns. They may not have fully recovered, but they are definitely rebounding. There’s no downward spiral. They are not doomed or dying.
Downtown Doomer proponents seem to mistakenly identify the process of creative destruction that downtown office sectors are going through as a downward spiral to doom.
What does seem to be in a genuine doom loop is the doom loop argument itself!
The Assumption That the Economic Health of All Downtowns is Dependent on the Strength of Their Office Clusters.
The focus of the Doomers is on downtown offices and, in their eyes, the failure of that sector drags the rest of the downtown into a downward spiral with it. Such an analytical connection is perhaps easy when the terms Central Business District or CBD and downtowns are frequently used interchangeably, and CBDs are seen as dominated by large office clusters.
In fact, most downtowns are far more complicated and have three sets of major functions, as displayed in Figure 1: Central Business Functions, Central Social Functions, and Central Support Functions.[6] The Central Social Functions (CSFs) are given short shrift by the Doomers, if they are noticed at all, but they are essential in many ways. First, strong CSFs can help assure that downtowns will keep appearing well activated and magnetic, in spite of any diminished office worker presence.[7] In turn, that helps assure that quality of life problems will not push an office sector downturn into the feared death spiral.
Second, in many small and medium sized downtowns, large office clusters are not their strong points, but CSF venues such as restaurants, bars, hotels, churches, public spaces, arts and cultural venues are.[8] Some of our largest downtowns, if admittedly too few of them, have significant amounts of the venues associated with CSFs such housing, retail, public spaces, entertainment and culture. The CCD in Philadelphia is a great example of this. But the fact that most visitors to our largest downtowns, both precrisis and today, are not coming there to work, means they are coming to shop or visit many CSF type venues, and these venues have a significant presence. Residents are also frequent visitors to CSF venues. Indeed, their presence help make living downtown attractive. That strongly suggests that should a downtown have a failing office sector, it could be offset to a significant degree by developing and growing venues associated with CSF functions. That is contrary to the Doomers’ postulation that if a large downtown’s office sector is badly hurt, the whole downtown must not only hurt, but fail.
The leisure, entertainment and hospitality sectors are filled with CSF venues. The CCD study found that the top three cities in terms of overall job recovery—San Antonio, Nashville and San Diego—are also the three cities with the highest share of leisure and hospitality employment. That’s a very impressive example of downtown resiliency given that in the early part of the crisis they probably suffered the largest employment losses. In these downtowns, non-office CSF functions and venues have a lead economic role. Doomers do not acknowledge the possibility of this type of downtown.
In contrast are the type of downtowns the Doomers focus on with employment largely in office prone sectors – e.g., information technology, finance, insurance, and professional and business services, They have had a lower rate of job recovery, if still a substantial one that the Doomers seem to ignore. One explanation for this may be that their major sectors have high proportions of jobs that can be done remotely.[9] An issue that has emerged in these downtowns is can they become more multifunctional, as evidenced most frequently by discussions about adding more housing to the downtown. Some serious efforts are underway in several of these, e.g., in Chicago and Washington, DC. Doomers when they opine on this argue such efforts are likely to be too small and ineffective or unlikely to happen.
[1] There are many Doomer analysts/authors, here is just one well know Doomer article: Gupta, Arpit and Mittal, Vrinda and Van Nieuwerburgh, Stijn, “Work From Home and the Office Real Estate Apocalypse” (October 5, 2023). Available at SSRN: https://ssrn.com/abstract=4124698 or http://dx.doi.org/10.2139/ssrn.4124698. Its first draft was in May of 2022. In the media, even the Wall Street Journal, The New York Times, and The Washington Post have had Doomer articles.
[8] N. David Milder, “How Our Downtowns’ Three Most Important User Groups Can Help Their Sustained Recoveries.” IEDC’s Economic Development Journal. Forthcoming.
15- Minute Neighborhoods/Cities are a hot topic these days, with many eyes on Paris and folks wondering if this concept would work here in the US. The leaders at CNU have given it serious and interesting attention and thought. It is a concept worthy of a close look to clarify its meaning and viability. Given that I want to analyze a complex concept in as few words as possible, I will avoid mentioning who said what when and where in previous published discussions about 15-minute neighborhoods/cities (hereafter referred to as 15MNs). As a curmudgeon and a contrarian, I will first present a contrarian view of what 15MNs are, their components, and how they should be defined. Then I will present the thinking that fostered my view of them. This will be followed by a case study of the community I live in, Kew Gardens (KG), NY. It is smaller than the area covered in a 15 minute walk shed, yet it has loads of things to do and buy. It also was built as a planned suburb, and today maintains many of the characteristics of one. NYC has several other neighborhoods that started out as suburbs, such as Forest Hills Gardens.
My intent is not to be definitive, but to spotlight some analytical and factual issues that now surround the concept, to provide some possible solutions, and to spark some additional discussion and amicable debate.
A Contrarian View of 15MNs
The Component Parts. 15MNs are composed of 1) a basic Core Area and 2) many larger Associated Access Areas.
The Core Area. Is fundamentally a residential area defined by a 15 minute walk shed from some central point, with supportive services that meet many human needs and desires, but certainly not all.
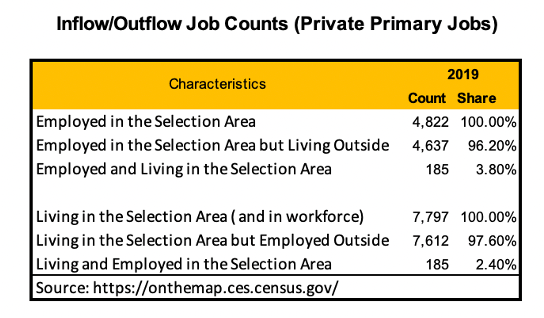
Who lives there will be strongly influenced by where people work. However, the people who will work there and do not live there are also very important because they so strongly impact local shops and businesses. Most people do not work in the community where they live, and that will probably be true of any 15MN. For example, here in Kew Gardens, 7,787 residents had jobs in 2019, but only 185, 2.4%, worked in KG. Most of KG’s residents work in Manhattan, with about 20% working in the Midtown CBD that’s about seven miles away (see map above). However, about 4,600 people come into KG to work there each weekday. Accordingly, meeting the needs and desires of these workers in the core area must also be considered because they account for such a large part of that area’s critical daytime population. These workers also will usually make pedestrian trips while in the area of 10 minutes or less.
The strengths and magnetism of the core areas will vary based on the range of needs and desires addressed and on how well that is done. The core thus serves as a kind of container for the venues and places that meet some, and hopefully many, of the residents’ needs and desires. The number of needs and desires addressed in a core and the number of venues and places addressing each one will vary with the cores population density, and the wealth and tastes of its residents and other frequent users.
The Associated Access Areas. The access areas are places core area residents can go to within a 15 minute trip. Core areas thus also serve as a base for residents to access additional venues and places located well beyond its borders that additionally can meet its residents’ needs and wants. Each of these needs and wants will likely have their own travel sheds that are further fragmented by the transportation modes that are fastest and popular. Jobs are one example. Others are comparison retail – many malls have 15-20 minute drive sheds, a few 40 minutes – hospitals and specialty medical services, major entertainment and cultural venues, colleges and universities, etc. Some may be reached by micro transportation vehicles; others will require the use of cars or mass transit.
Rather than carrying over a specific transportation mode to define these access areas, I am carrying over the 15 minute travel time constraint because of its implicitly strong association with providing the opportunity for enjoying a higher quality of life. A better quality of life is perhaps the most fundamental argument in favor of 15MNs. The pandemic has shown how stressing and destructive of quality of life are long commutes. What is not only in a town but also easily accessed in a short nearby trip is often an important factor in decisions people make about where they want to live.
Where the 15MN is located can make an enormous difference on what it can offer its residents. For example, a 15 minute car ride may theoretically buy 10 miles of distance and make every city a 15-minute city, but in places with very dense and slow moving traffic such as LA, NYC, Chicago, Philadelphia, Atlanta, Dallas and Seattle that will not be the case. This is particularly important regarding the ability of 15MNs to provide 15 minute access to large clusters of office jobs in their downtowns. In less congested cities, this will be less of an issue. Also, some cities, like NYC are polycentered with several downtowns, so this might increase the chances for 15MIN-jobs hook ups. In other words, some 15MNs will have this important jobs access, while others will to a lesser extent, or not at all.
The 15 minute access areas are critical because they can significantly impact the desirability of living in a particular 15MN’s core area.
Some Basic Givens
15MNs should not be viewed as complete or even mostly economically self-sustaining entities, i.e., small autarkies. Even the slightest implication of that will severely weaken the persuasiveness of the concept. Autarky lacks viability at the national level and is even less so at the local level. However, 15MNs should offer a lot of what people need for everyday living like shelter, food, entertainment, safety and especially a sense of community.
Nor should they be seen as isolated geographic units with no really important ties to their cities, regions or states. Even famous island nations have strong ties to other geographic units. Viable 15MNs also will be stronger if they are well connected to their neighboring communities and their regions. This is especially true because of jobs. Since large downtowns are often very large office employment nodes, how 15MNs are connected to them can be an important factor in determining their magnetism.
15MINs CANNOT BE DEFINED BY JUST ONE TRAVEL MODE. Work is an absolutely essential part of people’s lives. Pre pandemic, about 5% of our labor force worked from home (WFH), and recent estimates are that 20% to 30% will do so post pandemic. Also, the average commuter trip in the US is 27.6 minutes, with only about 29% of commutes by all modes lasting 15 minutes or less. One might reasonably argue that unless advocates of 15MNs can provide an adequate way of dealing with the work issue, its chances of success will be diminished. Proximity to large employment nodes may determine if a 15MN can claim to offer 15-minute access to jobs. For example, here in NYC, a 15MN in Long Island City, Astoria or Williamsburg would be more likely to provide such access than those in Forest Hills, Kew Gardens or Prospect Heights when door to door trips are considered, not just the length of a bus or rail trip. Long Island City is of special interest because it is and has long been an important employment node, and has had huge recent residential growth.
Many cities such as NYC and LA are really polycentered, with one very dominant downtown, and others dispersed across the city. In NYC these downtowns include: Midtown and Downtown in Manhattan; LIC, Jamaica Center, Flushing, and Rego Park/Elmhurst in Queens; Downtown Brooklyn, and Fordham Road in The Bronx. 15MNs within 15-minute trips of them may offer stronger job access.
Residential uses are the foundation stones of 15MNs. On them and their supporting functions a community can be built. Since community building is easier and stronger when people meet and interact, the area’s built environment must facilitate and support such interactions. This means walkability, public spaces and third places are important assets. It also means that the 15MN’s core area should be geographically defined by a 15 minute walk shed from its central point.
Given this residential orientation, our national trend of residential tribalism, and their relatively small size, will 15MNs have a propensity to be racial and ethnic enclaves? Are such enclaves always problematical, e.g., our Chinatowns, Koreatowns, Little Indias?
A 15MN’s core cannot possibly meet every need and desire residents might want. Such an outcome has so strong a prima facie improbability that nothing more needs to be said.
When talking about how 15MNs meet resident needs and desires, we should be clear about whether we are talking about what the average or strongest and most magnetic among them might have, or what might be asserted as needed for them to be deemed 15MNs. I think, in this regard, there has been a lot of confusion about what makes a 15MN and what makes a great one.
While not all human needs and desires will be met within a 15MN’core area, many more probably can be accessed from the 15MN core within the 15 minute travel time of some mode of transportation other than walking. Consequently, 15MN cores function as 1) geographic containers for some –and hopefully a lot – of the venues and places that meet the needs and desires of the local residents, businesses and workers, and 2) a as an operational base from which core resident needs and desires can be met more fully in “access areas” defined by 15 minute travel sheds that cover larger areas because the travel modes employed have greater speed than walking. A 15 minute walk shed covers about 1.88 square miles, a 15 minute auto travel shed theoretically can cover 335.1 square miles. Yes, this may mean that traveling by rail, bus, and car are still associated with 15MNs. This is especially likely to be true with regard to comparison retail, jobs, education and health care services, etc.
15MNs will not have just one set of defining functions and activity opportunities. One set would mean just one type of 15MN, when many types are conceivable, and people will probably chose which 15MN to live in based on how the 15MNs functions and opportunities met their specific set of lifestyle needs and wants. Just as there are different types of residences, there can be a wide variety of 15MNs
15MNs cannot be exhaustively defined by the 15-minute travel shed of just one transportation mode, walking. To do so will be counter to the strong probability that the residents of any 15MN will be very multimodal, and not only walking and riding bikes and scooters, but also using buses, subways, commuter rail, and yes, even cars.
However, 15 minutes is an essential part of the concept because of its association with the possibility of having a better quality of life. Its presence acts as a constant, like the speed of light in Einstein’s E=MC2 equation, that serves to focus attention on geographic areas in which travel times are far from burdensome, so movement within these areas can be relatively easy.
A Sample of Urban 15MN Core Venues and Places
Having argued strongly above that 15MNs cannot meet all the needs and wants of its their residents, I want to illustrate that in dense urban areas they nevertheless can meet a wide variety of them. I am not claiming that the situation depicted below should or will be replicated elsewhere, and there are obvious conditions associated with it such as population size and density, household incomes, and infrastructure amenities.
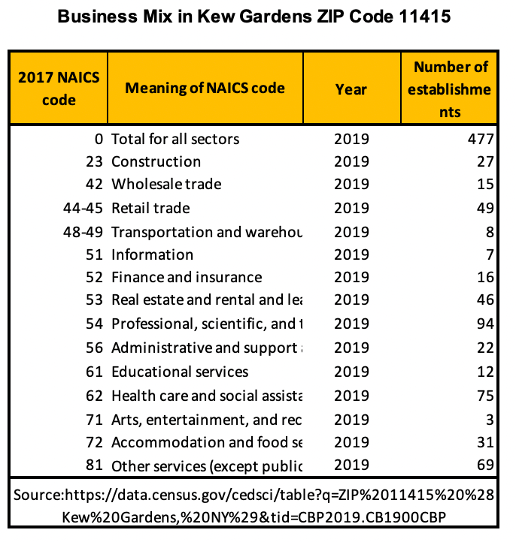
To do so I have selected the Kew Gardens zip code to look at. With an area of about .57 square miles, it is considerably smaller than the 1.88 square miles a full 15 minute walk shed covers. It’s population is comparatively large,19,341, exceeding that of about 85% of the nation’s incorporated places, and dense at 34,042 persons per square mile. There are over 9,000 housing units. The median HH income is about $70,900, with 32% having incomes of $100,000+. Fifty percent of adults have a BA or higher degree. The largest racial/ethnic groups are: White 48.4%; Hispanic 25.1%, Asian 16.2%, and Black 6.2%.
The neighborhood borders a 538 acre park and has a strong cinema that draws from well beyond the community, commuter rail and subway stations, and an exit on a major limited access highway.
In 2019, there were 477 business establishments in the zip code, of which 49 were retail, overwhelmingly independents and small chains. Thirty-one were in accommodations and food services, with a vast proportion restaurants and takeout places. There are a large number of professional services because of important city offices and courts in the area. There are also numerous other Central Social Functions types of venues such as hair and nail salons, martial arts studios, childcare and senior care facilities.
Jobs are where this neighborhood sees the overwhelmingly majority of its residents, 97.6%, leaving the area, and 96.2% of those employed in Kew Gardens are not living there. Pre-crisis 53% used public transit to get to work, 35% autos, 6.1 % biked or walked, and 3.8% worked from their homes.
Having a large number of people living and working in an area is seen as increasing the multifunctional strength of large employment centers, such as our large downtowns with large inventories of office space. However, it is not easily achieved. For example, as can be seen in the nearby table, some of our major employment nodes do indeed have over 40% of their residents also working in the area, but they only account for about 4.2% of all 230 employment nodes studied. In contrast, 60% of the nodes were below 20%.
That suggests that it will not be easy for 15MNs to grow their live-work numbers. The growth in remote work might help some in this regard, but that will happen most easily in suburban locations that are attracting nesting Millennials who also hold jobs attached to offices in large downtowns.
KG is Probably Far From Alone and That Raises the Issue of Making Our Organic 15MNs Better. New York City probably has several hundred neighborhoods. Manhattan alone has 53, according to the city planning department. Many of them have organically developed in a fashion similar to KG, and be de facto 15MNs.
For them the issue is not really one of creating a 15MN, but how they can be made better. In thinking about that, we need to consider not only their core areas, but also how their access areas can be expanded or better penetrated. The latter is essentially a transportation issue. My bet is that the growing use of e-bikes and e-scooters will facilitate that faster in the three to five mile range than any expansion of mass transit.
Some Suggested Take Aways
Our densely populated cities may already have many organically developed 15MNs
A 15-minute walk shed can hold a large number of diverse businesses, residential units, and other assets that impact the local quality of life, but that is not necessarily the case. As with any neighborhood, 15MNs will differ in how many of these assets they have, as well as in their population size and density, household incomes, racial/ethnic mixes, etc.
Their magnetism will depend on their asset mix and how their specific asset mix meshes with the needs and desires of potential residents
Some of the needs and desires of 15MN residents can also be met outside of the core but within 15 minute trips by their favored transportation modes
The needs and desires of residents that are best met in venues and places that are designed to have regional drawing power – workplaces, comparison shopping malls, hospitals, colleges, major museums, etc. – typically will be the hardest to access even within 15 minute trips by the fastest transportation mode, unless the 15MN is geographically located close to them. Where the 15MN is located makes a difference.
Going to work will probably be the primary reason that 15MN residents leave their neighborhoods. 15MNs in polycentered cities that are with a 15 min travel times — door to door – of one of these downtowns will be better able to have easy access to workplaces and benefit from it as a magnetizing asset.