Contact: N. David Milder, Editor The ADRR — The American Downtown Revitalization Review 718-805-9507 [email protected]
THE CREATION OF THE AMERICAN DOWNTOWN REVITALIZATION REVIEW (THE ADRR)
There currently is no real professional journal for the downtown revitalization field. For many years, that has been strongly lamented by many of the field’s best thinkers. To remedy that situation, a band of accomplished downtown revitalization professionals are creating The ADRR. It will be a free online publication, appearing four times each year. The target date for the debut issue is now set for the June 1-15, 2020 timeframe, with the second issue aimed for the Sept 7-14, 2020 timeframe.
This ADRR is intended to be a lean and mean operation, based totally on the availability of free online resources and the time, energy and elan contributed by its authors, advisory and editorial board members, and its editor.
How to Subscribe to The ADRR
Those interested can now visit The ADRR’s website, www.theadrr.com , where, on the home page, they can sign up to become subscribers. This enrollment places the subscriber on a MailChimp mailing list so that they can receive New Issue Alerts (see below).
How Issues of The ADRR Will Be Distributed.
New Issue Alerts, containing the Tables of Contents of issues and links to their downloadable pdfs of articles are sent to subscribers via a MailChimp email blast and posted to the ADRR’s website. Each issue’s pdf files initially will be stored in a folder in ND Milder’s Dropbox account from which they can be downloaded. Subscribers can download only those articles they want to read and whenever they want to read them. The ADRR also can be found via Google searches.
The Content We Are Aiming For. Only manuscripts about major downtown needs, issues and trends will be considered for publication. They will be thought pieces and not just reports about a downtown’s programs and policies that its leaders want to brag about. Articles must have broad salience and their recommendations broad applicability within the field. The “voice” of The ADRR will be anti-puff, and very factual, evidence driven, though not dully academic. Discussions of problems and failures will be considered as relevant as success stories if, as so often is the case, something substantial can be learned from them. The ADRR will not avoid controversial issues.
Also, the focus of The ADRR will not be overwhelmingly on our largest most urban downtowns, but also provide a lot of content and relevant assistance to those in our small and medium sized communities, be they in suburban or rural areas.
Who Will Write the Articles?
Hopefully, they will be from people in a broad range of occupations – downtown managers and leaders, municipal officials, academics, developers, landlords, businesspeople, consultants, etc. — who have significant downtown related knowledge and experience.
Curated Articles and Wildflowers. Initially, the ADRR will solicit articles to prime the content pump. Once The ADRR is up and running some articles will continue to be solicited on topics deemed a high priority by the editorial board members. Each board member can select a topic to curate an article on and seek the author(s) to write them. However, there still will be a continual traditional general call for submissions (wildflowers) focused on subjects selected by their authors. All submissions, curated or wildflower, must demonstrate sufficient merit to warrant publication in The ADRR. All submitted articles will be reviewed by board members. We hope to see many submissions!
Article Length and Author Responsibilities.
There will be short reads and long reads. Articles of 1,500 to 5,000 words will be considered. Multi-part articles of exceptional merit and salience will also be considered. What counts is their quality, not their length. Authors must have their articles thoroughly proofread prior to submission. Poorly proofed manuscripts will be rejected. Guidelines for submissions may be found on The ADRR website.
Publication Schedule:
Published four times per year, with a minimum of 5 articles in each issue. Given that this is an online publication, from a production perspective, the number and length of the articles is not a particular problem. However, from an editorial and content management perspective, the number of articles and their lengths can quickly become burdensome.
How It Will Be Organized.
The ADRR will be published by an informal group for its first year, with no person or group having ownership.
Editor. During the ADRR’s first year, N. David Milder has volunteered to serve as its editor.
The Advisory/Editorial Board :
Jerome Barth, Fifth Avenue Association
Michael J Berne, MJB Consulting
Laurel Brown, UpIncoming Ventures
Katherine Correll, Downtown Colorado, Inc.
Dave Feehan, Civitas Consulting
Bob Goldsmith, Downtown NJ, and Greenbaum Rowe
Stephen Goldsmith, Center for the Living City
Nicholas Kalogeresis, The Lakota Group
Kris Larson, Hollywood Property Owners Alliance.
Paul R. Levy, Center City District, Philadelphia
Beth Anne Macdonald, Commercial District Services
Andrew M. Manshel, author
N. David Milder, DANTH, Inc
John Shapiro, Pratt Institute
Norman Walzer, Northern Illinois University
Articles in our first issue that will be published in June 2020
Michael Berne, MJB Consulting, Working Title, ” Bringing Downtown Retail Back After COVID-19”
Roberta Brandes Gratz, “Malls of Culture.”
Andrew M. Manshel, “Is ED Really a Problem?”
N. David Milder, DANTH, Inc., “Developing a New Approach to Downtown Market Research Projects – Part 1.”
Aaron M. Renn, Heartland Intelligence, “Bus vs. Light Rail.”
Michael Stumpf, Place Dynamics, “Using Cellphone Data to Identify Downtown User Sheds”.
The Spotlight: “Keeping Our Small Merchants Open Through the COVID-19 Crisis”
Katherine Correll, Downtown Colorado, Inc.
David Feehan, Civitas Consulting
Isaac Kremer, Metuchen Downtown Alliance
Errin Welty, Wisconsin Economic Development Corporation.
Many downtown retail growth strategies are doomed because
they try to avoid some key facts. One is that, except in the very rarest of
rare situations, downtown retailers, be they new or old, large or small, must compete
for and win sufficient market share to prosper. Another, and closely related
fact, is that beneath the venerated
“leaked” sales to merchants located beyond the downtown’s trade area, and the
45% of GAFO sales now being e-leaked to online merchants, is a group of
shoppers who are either weakly bonded or completely unbonded to merchants in
either the downtown or its larger trade area. They are “up for grabs shoppers”
who are very likely to buy fewer things, or to be won over by strongly magnetic
brick and mortar merchants located beyond the trade area, or by online
merchants, or—and this is very important – by new retailers opening in the
downtown or elsewhere in the trade area.
Some Implications
The existence of such shoppers has important implications:
The up for grabs shoppers are always there,
though their numbers may vary across retail sectors and over time.
For new and expanding downtown retailers, it
means that there very often will be between 15% to 60% of the shoppers in their
retail sector who are up for grabs and likely to give them a look. That indicates
the local competition is weak. If the
new/expanding retailers are capable, they will have a very good chance of
winning the dollars and loyalties of these shoppers.
For many existing retailers, the up for grabs
shoppers can indicate – if they learn about them — that a good percentage of
their customer base may be prone to desertion and signal a need for the
merchants to improve their operations.
For downtown economic strategists and leaders,
it means that any successful new retailer brought into town is likely to win
customers away from merchants located beyond the trade area, or from online
merchants, and/or from brick and mortar merchants currently located in the
downtown or elsewhere in the trade area. The existence of substantial numbers
of up for grabs shoppers also is a sign that downtown EDOs need to create
effective programs to help existing merchants improve, or to be prepared to
recruit more capable merchants who can better satisfy consumer needs and wants.
Just looking at the shoppers leaking their
retail expenditures to beyond the trade area merchants is rather myopic – and a
denial of reality. This myopia is understandable given that it seems to allow for
the ill-conceived assumption of immaculate retailing that any new or expanding
downtown retailer competing for the leaked dollars will not take any sales away
from other downtown merchants. The existence of any sizeable number of
up-for-grabs shoppers in the relevant retail sector means that is a highly
unlikely prospect.
Some Examples
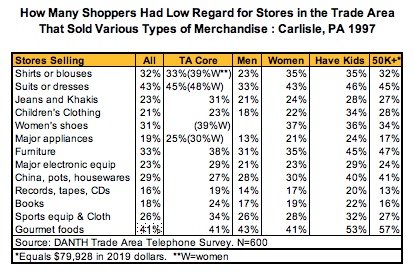
DANTH, Inc. first addressed up-for-grabs shoppers in a number of telephone
surveys we did back in the 1990s when we asked respondents whether various types of retail stores they
could visit within a 20-minute drive
from their homes, were excellent, good, fair, or bad. Responses of fair and bad
were treated as indicators of weak bonding with the relevant retailers. Their
retail expenditures consequently may be considered as up-for- grabs and more
prone to being captured by new or expanding retailers, be they brick and mortar
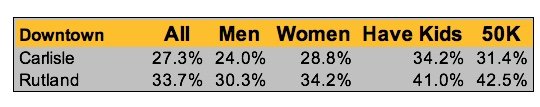
or online. Above are two tables showing
the responses to surveys done of the shopperss in the trade areas of Rutland,
VT, and Carlisle, PA. For example, about
44% of the expenditures for suits or dresses by shoppers in Rutland’s trade
area were up-for-grabs, as were about 43% of those expenditures by shoppers in
Carlisle’s trade area.
For all the retail store types, the average number of loosely bonded shoppers in Carlisle’s trade area, 27.3%, was somewhat lower than that in Rutland’s trade area, 33.7% — see the table above. This may be because Carlisle is in a denser region, with higher household incomes, and with many more retail choices. Downtown Rutland is located in the Rutland Micropolitan Statistical Area that is composed of Rutland County. The median household income in 2017 in the county was about $52,000, and about 19% of the households had an annual income of $100,000+. The county has a population of about 61,000, and Rutland City is by far its largest retail center. In contrast, Downtown Carlisle is on the western edge of the Harrisburg–Carlisle MSA that had a population of about 560,000. Carlisle is located in Cumberland County where the median household income in 2017 was over $82,000, and about 27% of the households had an annual income of $100,000+. Moreover, back in 1997, in the downtown Carlisle trade area there were 12 major malls occupying a total GLA of about 3.5 million SF.
It is also interesting to note that, even with all that retail
within an easy drive, on average, 27.3% of the shoppers in Carlisle’s trade
area were up-for-grabs. Moreover, that number was even higher for some
important markets segments: shoppers with children and those with annual
household incomes over $50,000 (about $80,000 in 2019 dollars). The same
pattern among market segments was even stronger among Rutland’s shoppers.
Some Types of Up-for-Grabs Shoppers
Up for grab shoppers can be present in many market segments
and to varying degrees. For example, the numbers/percentages of loosely bonded
shoppers in the upper income 4th and 5th quintiles are of
particular interest because they account for a very disproportionate amount of consumer
expenditures across all sectors, especially retail. As can be seen in the above
table, nationally, shoppers in the highest income quintile (the 5th 20%
group) accounted for about 38.9% of all consumer expenditures in 2017, about
equal to the combined total of the 3rd and 4th quintiles.
The 5th quintiles shares of all expenditures on food away from home,
home furnishings, and apparel were at about that level. However, they also accounted
for 52% of all entertainment fees and admissions, making them an absolutely
critical market segment for most downtown entertainment niches.
In rural towns and cities, such as Rutland, VT, Scotts
Bluff, NE and Laramie, WY, where trade area populations are not large and
household incomes are relatively modest, one might expect the more affluent
shoppers will be among those most detached from local merchants. These
downtowns usually do not have a strongly varied retail environment and local
merchants are prone to catering to the more numerous middle income shoppers.
Underserved, and possibly ignored, these more affluent consumers tend to shop in
distant towns and cities having more robust retail assets, and they are
increasingly buying from online retailers.
Very often, a large proportion of leaked retail expenditures
come from the 20% to 30% of the
households with the highest incomes in the trade area. Unless a sufficient
bolus of the types of retail they prefer open in the downtown or trade area, it
will be very difficult to recapture those leaked dollars. Traditional leakage
analyses, by themselves, cannot identify such situations. However, an analysis
of the up for grabs shoppers can help
answer the critical question that
leakage analyses raise, but cannot answer: how many of the leaked
dollars can be captured by new or improved local merchants?
Lower income shoppers also can be up for grabs. The local
retail structure also may not have the stores with the price points and/or
merchandise they need. Evidence of this comes from the enormous growth in
recent years of dollar store chains and their ability to take significant numbers
of low-income shoppers away from huge, well-established retailers such as
Walmart, as well as from local small merchants.
It should be noted that an important element in the
discussions of upper and lower income shoppers presented above is the existence
of what might be termed a gap between the types of stores these shoppers need
and/or want and those that exist in the downtown or trade area. A useful
estimate of the monetary values of such gaps can be made by multiplying the
number of dissatisfied shoppers by sector in the relevant income groups with
estimates of the retail expenditures by sector of households in those income groups.
However, such estimates do not carry along with them the assumption that all of
the potential gap expenditures are being leaked to beyond the trade area
merchants. Shoppers might also spend online, or simply reduce their spending
levels.
The discussions of these two income groups also helps
spotlight a frequent deficiency in downtown market analyses: the primary focus on
statistical means and medians.
Millennials, now our largest generation, seems very prone to
being weakly bonded to product brands. One might reasonably hypothesize that
also will probably be the case for retailer brands. For example, in 2017, a study found that “67
% of millennials changed brands in the last year” and called this “a clear lack
of brand loyalty among 18-34 year olds.” The two major factors driving
disloyalty were product quality (49%) and product availability (44%). These findings suggest that the number of up
for grabs shoppers is likely to grow in importance in coming years as the
economic importance of the millennials grows. See: “Millennial Research:
Factors Driving US Millennials Brand Disloyalty”, Posted on January 20, 2017 by
B. Smith to https://www.customerinsightgroup.com/loyaltyblog/brand-loyalty/millennial-research-factors-us-millennials-brand-disloyalty
Here’s the Rub
In my experience, telephone surveys with about 500 to 600
respondents were the best way to obtain useful and reliable data about the up
for grabs shoppers in a downtown’s trade area. However, over the past two
decades, it has become harder and harder to conduct such surveys. Response
rates have dropped significantly as the public became more resistant to
answering surveys and responding to telemarketing efforts. Online surveys are
not a substitute, since their use really requires a panel of respondents from
which a valid sample of trade area respondents can be drawn. Few, if any, trade
areas have such panels.
As a result, for many years we stopped doing trade area
telephone surveys, yet the need for the types of data they could provide seemed
to grow with the upheavals in the retail industry and the need to get a good
grip on how many sales were going to online retailers. Today, in the face of
that growing need, the best available solution path appears to be one framed by
an analytical modesty that recognizes we will have to deal with survey data
that is far less accurate than we might like. For example, it may be necessary
to accept a 5% or 10% estimate error at
the 85% or 90% confidence level. These
can be maximized when the population being surveyed can be treated as finite. Furthermore, the solution path might utilize
several of these research tools:
Shopper Intercept Survey. The value of these surveys depends a lot on where and when the interceptions are made and the number of interviews that are completed. The more completions the better. That number will be determined by where the interceptions are made, the length of the questionnaire, the ease of answering the questions, and the respondents interest in revitalizing/improving the downtown. Given the need for brevity –- say 10 minutes to complete the questionnaire – it will be essential to carefully select the most important questions. In the past, we limited our use of shopper intercept surveys because they seemed limited in their ability to gather all the information that a telephone survey could. Furthermore, they could not reach the trade area shoppers who did not shop downtown and obtain information from them that might help explain why. That said, the need to get some useful data about these up for grabs shoppers has grown to the point that we are faced with the choice of either rejecting the use of any survey data or using surveys that may not have the error and confidence levels held as the acceptable standards in the past. One can argue, that if the conclusions drawn from a survey with a 7% or 10% error factor at an 80% or 90% confidence level are carefully structured, they still can be very useful analytically. The analyst is certainly in a better situation having access to such information than not having it.
Online Surveys. In a number of instances, some market segments may be known to be more important than others and merit special attention. The size of such a market segment and viable ways of contacting its members also may be known. That means that huge proportions of the relevant population, possibly even every member, can be invited to participate in an online survey. In these situations sampling is either not an issue or not a significant one. This is often very true of important segments in a downtown’s daytime population: people employed in the downtown, seniors in downtown housing and senior centers, high school students, patrons of downtown cultural venues, users of downtown transportation centers, downtown residents, etc.
Nominal Group Process (NGP). We like this small group process because its structure prevents the discussion being dominated by a few participants and assures a useful information product will be produced at the end of the session. The NGP is able to handle 100 to 150 participants grouped in 10 to 12 tables and then the results often can be stated in quantitative terms. However, the qualitative inputs generated by participants are usually the primary useful products.
Focus Groups. These small groups can be useful, but too often are not. They best provide qualitative information, Using them to predict market segment behaviors is ill founded, since the number of participants is usually too small to constitute a useful sample and their characteristics and recruitment are unlikely to be representative of the relevant population. If not well-led and/or are too large , focus groups can be dominated by a few individuals. However, the qualitative information they often can produce can give the analyst an understanding that simply cannot be provided by just the numerical data. They can be invaluable for generating viable explanatory hypotheses.