I am very happy to share this article on downtown multifunctionality/ functional diversity that was recently published in the JURR, a British journal focused on urban renewal and regeneration. It reflects my most recent thinking on this subject, as well as my efforts to add some analytical heft to it while also getting more people to find it of interest and importance.
Here’s the abstract: “In the large downtowns in the US, the adaption rates and impacts of remote work have been strong and sparked efforts to make these districts far more multifunctional, especially by adding lots of new housing. While comparable city centres in Western Europe have not seen remote work have similar impacts on office occupancy, multifunctionalism has long been heralded as a factor that makes them strong. For example, it underpins their two key competitive advantages of dense agglomeration and the generation of many multipurpose trips. While multifunctionalism is a familiar concept and is often mentioned in relevant publications, there is amazingly little written about it theoretically, and little to no empirical research done on it. I took on that topic in a recent paper in which I noted that how downtown multifunctionality is ‘packaged’ in the physical containers in which the venues of these functions are activated, and how they physically relate to each other, are very often the key factors in determining whether efforts to make a downtown more multifunctional will succeed. I also argued that a function must have very magnetic destinations active in these containers. This paper focuses just on the topic of packaging functions and is an expansion of my prior analysis that covers much new ground.”
I am proud to share with you my article “How Our Downtowns’ Three Most Important User Groups Can Help Their Sustained Recoveries” that was recently published in the IEDC’s Economic Development Journal. It focuses on downtown workers, residents and visitors and covers our largest downtowns as well as those of more modest size. It presents several analytical conclusions that counter conventional wisdom. For instance, while the media have focused on the reduced presence of downtown workers in our largest downtowns, the drop in downtown visitors was far larger, and smaller downtowns were less impacted by remote work because they are not usually the primary locations for their cities’ office prone workers.
The article relies heavily on data from the CCD’s Downtowns Rebound project led by Paul Levy, Placer.ai, OnTheMap, and my field experiences, as well as a dataset created by Bill Ryan on all the cities with population between 25,000- 75,000 in seven Midwest states.
I have really had it with the Doomers, those who argue that our large downtowns are doomed to failure and diminishment.[1] It’s time to call them out for being the downtown ignorant Chicken Littles that they are.
Their Covid crisis instigated doom loop analysis has been a considerable worry for many municipal business and political leaders, since it predicts not just the decline, but the end of our large downtowns’ ability to be thriving business districts. It also has been almost as good a story for grabbing public attention for many media outlets as fires, riots, and other serious calamities. Of course, it also has been raw meat for some authors who seek greater notoriety. The legitimacy of this argument seems to mistakenly be seen as deriving from the fact that academics and wannabe urban pundits have been its leading proponents and some even used real data analyzed by sophisticated statistical tools. However, the most worrisome parts of the argument are really based not on any data or fancy statistical tools, but on the Doomers conclusions and assumptions. The Doomers thinking displays an enormous ignorance about what downtowns are really like and how they operate. The media writers and their editors who bought the Doomers’ analysis are little better.
The Conclusion of a Downward Spiral. Doomers cite the very low occupancy rates found in the office clusters in our largest downtowns – too often based often on questionable data, mind you — and predict consequent enormous losses in lease revenues and building values. This they then argue will mean the failure of lots of office buildings. Investing in downtown real estate and leasing downtown spaces consequently will be much less attractive, and this will have very adverse effects on other downtown sectors such as retail and personal services. City tax revenues will also drastically fall, with a consequent reduction in essential services, precisely when quality of life problems are surging. Overall, these downtowns will thus become much less attractive in a continually degrading manner.
Frankly, much of this part of the Doomers analysis is valid. Major downtown office sectors have undeniably been hit hard by the pandemic, and many outmoded buildings are indeed doomed. But that has happened several times in the office sector since the 1980s, if not as strongly. Quality of life problems have surged both in frequency and visibility during the crisis. However, the Doomers turn the current office sector downturn into a unique event by making an unwarranted analytical leap, based on little to no probative evidence: they claimed that these downtowns would fall into an unstoppable downward spiral, AKA the doom loop. They did not entertain any possibility of a recovery of any kind such as:
The downtown’s office sector does indeed shrink, maybe even by 20% to 30%, but then it stabilizes at this new equilibrium point that is still a very consequential 70% to 80% of its prior size. But downtown growth is now engined by other sectors such as housing, personal services, entertainment and culture.
After stabilizing, the office sector starts to grow again.
The Doomers’ data have no probative value for determining whether the doom loop scenario or one of the recovery scenarios is the more probable outcome.
Their major justification for predicting the doom loop seems to have been that quality of life issues — e.g., rising crime rates, more homeless – were occurring along with fewer downtown visits and lots of business closures were occurring early in the crisis. Yes, in the past these issues did cause downward spirals in many downtowns. What is interesting is that these problems often emerged in the 1970s and 1980s in fairly large downtown office clusters that stayed successful in spite of them. Ironically, the fortress designs of these clusters often induced the very fear of crime they were meant to protect against. In time, many districts overcame these problems and the downtowns office sector became more prosperous than ever before! Downtown Manhattan and Charlotte’s CBD are two examples that come to mind.
The Doomers choice of the gloomy scenario also shows an ignorance about many characteristics of our large downtowns and it keeps being eroded by hard evidence of downtown recoveries, some of which appeared early in the crisis:
Historically, large downtowns have proved to be amazingly resilient. They survived the Great Depression, and some like Midtown Manhattan even had trophy projects like the Empire State Building and Rockefeller Center developed during that very stressful era. Many also came roaring back after the mid 1990s after having struggled during the 1970s and 1980s.
Downtowns in some states, such as Texas, have long had their office sectors go through serious boom and bust periods because of overbuilding, exhibiting a kind of cyclical resiliency.
Back around the Great Recession the growing appeal of open offices was supposedly making many older office buildings outmoded, much as remote work is said to be doing today. That was supposedly causing great havoc within the real estate industry. If memory serves me, office growth soon returned with a happy vengeance. The office sector, just like other sectors, will experience periodic serious disruptions caused by capitalism’s process of creative destruction. This process is one of both mass disruption and strong recovery.
Nonresident office workers only account for a relatively small proportion of downtown visits. Almost two-thirds of these visits are accounted for by visitors who neither work nor live in a downtown. These visitors were quick to stay away from our downtowns as Covid became a national emergency, and accounted for a far greater proportion in the drop of downtown visitation than did the office workers, BUT they were also the quickest to return in very substantial numbers.[2] This quick return indicates that the causation of this decline in visitor visitation was situational in nature, not structural. In contrast, the slow return of office workers is consistent with structural causal factors being present. By October 2021, data from Placer.ai was already showing strong signs of recovering downtown visitation. Still, Doomer gloom continued to be published.
Office workers also account for a relatively small portion of a downtown’s retail sales. Tourists and residents are the big retail shoppers and spenders. Many downtown retail problems were existing precrisis, caused by the strong wave of creative destruction that industry has been experiencing for about a decade.
So the ability of a declining office sector to hurt retail sales and decimate downtown pedestrian activity is far more modest than the Doomers suggest.
Downtown return to office rates (RTOs) have risen from about 30% early in the crisis to a median of 65% in our large downtowns. That’s not evidence of a downward spiral, but of a significant partial recovery, though the extent of the final recovery is still uncertain.
Midtown Manhattan, once thought to be a potential victim of an office generated doom loop recently was the “hottest office market” in the US in the first half of 2023 that had “far and away” the most absorption of office space.[3]
In downtown San Francisco, the process of wringing out excessive values from troubled office buildings seems to have started, with prior owners and bankers taking their losses and the new owners attracting new tenants with lower and more affordable rents.[4] This process promises to help increase downtown office occupancy rates, as well raising office worker foot traffic and consumer spends.
Greater downtown visitation is known to help reduce the fear of crime, and drive bad uses out of the area. This is something about which the Doomers appear to know nothing. A recently released terrific report by a Paul Levy led team at the Center City District in Philadelphia found that: “The cumulative average of visitors across the (nation’s largest) 26 downtowns by the end of Q2 2023 back at 79% of Q2 2019 levels; workers of all kinds back at 66%; and residents at 120%.”[5]The direction of downtown visits is obviously strongly upward, not downward. That will help make these areas seem more activated and alive, while helping to reduce the fear of becoming a crime victim. The quality of life conditions in these downtowns are not on any definitive downward spiral, though serious issues certainly remain unresolved.
The title of the CCD’s report, Downtowns Rebound, sends a very important message about our large downtowns. They may not have fully recovered, but they are definitely rebounding. There’s no downward spiral. They are not doomed or dying.
Downtown Doomer proponents seem to mistakenly identify the process of creative destruction that downtown office sectors are going through as a downward spiral to doom.
What does seem to be in a genuine doom loop is the doom loop argument itself!
The Assumption That the Economic Health of All Downtowns is Dependent on the Strength of Their Office Clusters.
The focus of the Doomers is on downtown offices and, in their eyes, the failure of that sector drags the rest of the downtown into a downward spiral with it. Such an analytical connection is perhaps easy when the terms Central Business District or CBD and downtowns are frequently used interchangeably, and CBDs are seen as dominated by large office clusters.
In fact, most downtowns are far more complicated and have three sets of major functions, as displayed in Figure 1: Central Business Functions, Central Social Functions, and Central Support Functions.[6] The Central Social Functions (CSFs) are given short shrift by the Doomers, if they are noticed at all, but they are essential in many ways. First, strong CSFs can help assure that downtowns will keep appearing well activated and magnetic, in spite of any diminished office worker presence.[7] In turn, that helps assure that quality of life problems will not push an office sector downturn into the feared death spiral.
Second, in many small and medium sized downtowns, large office clusters are not their strong points, but CSF venues such as restaurants, bars, hotels, churches, public spaces, arts and cultural venues are.[8] Some of our largest downtowns, if admittedly too few of them, have significant amounts of the venues associated with CSFs such housing, retail, public spaces, entertainment and culture. The CCD in Philadelphia is a great example of this. But the fact that most visitors to our largest downtowns, both precrisis and today, are not coming there to work, means they are coming to shop or visit many CSF type venues, and these venues have a significant presence. Residents are also frequent visitors to CSF venues. Indeed, their presence help make living downtown attractive. That strongly suggests that should a downtown have a failing office sector, it could be offset to a significant degree by developing and growing venues associated with CSF functions. That is contrary to the Doomers’ postulation that if a large downtown’s office sector is badly hurt, the whole downtown must not only hurt, but fail.
The leisure, entertainment and hospitality sectors are filled with CSF venues. The CCD study found that the top three cities in terms of overall job recovery—San Antonio, Nashville and San Diego—are also the three cities with the highest share of leisure and hospitality employment. That’s a very impressive example of downtown resiliency given that in the early part of the crisis they probably suffered the largest employment losses. In these downtowns, non-office CSF functions and venues have a lead economic role. Doomers do not acknowledge the possibility of this type of downtown.
In contrast are the type of downtowns the Doomers focus on with employment largely in office prone sectors – e.g., information technology, finance, insurance, and professional and business services, They have had a lower rate of job recovery, if still a substantial one that the Doomers seem to ignore. One explanation for this may be that their major sectors have high proportions of jobs that can be done remotely.[9] An issue that has emerged in these downtowns is can they become more multifunctional, as evidenced most frequently by discussions about adding more housing to the downtown. Some serious efforts are underway in several of these, e.g., in Chicago and Washington, DC. Doomers when they opine on this argue such efforts are likely to be too small and ineffective or unlikely to happen.
[1] There are many Doomer analysts/authors, here is just one well know Doomer article: Gupta, Arpit and Mittal, Vrinda and Van Nieuwerburgh, Stijn, “Work From Home and the Office Real Estate Apocalypse” (October 5, 2023). Available at SSRN: https://ssrn.com/abstract=4124698 or http://dx.doi.org/10.2139/ssrn.4124698. Its first draft was in May of 2022. In the media, even the Wall Street Journal, The New York Times, and The Washington Post have had Doomer articles.
[8] N. David Milder, “How Our Downtowns’ Three Most Important User Groups Can Help Their Sustained Recoveries.” IEDC’s Economic Development Journal. Forthcoming.
Non Resident Downtown Employees. Three plus years after Covid19 was declared a national emergency, it seems that most of our downtowns are now pretty far into recovering from its impacts, though their recoveries are not yet complete. Even so, fears of a Doom Loop emerged grounded mainly on the negative impacts of remote work on office demand, that in turn is based on some distortedly presented data from Kastle Systems on office building worker occupancy rates. Kastle reports on metro regions, not cities though they speak of cities, and the vast majority of their buildings are in the suburbs, not downtowns. Also, when they do have some presence in a downtown, they tend to be in the second tier buildings most likely to have been made outmoded by remote work, not the most attractive and successful ones. In Manhattan for example, Kastle is not in the higher quality buildings owned by the city’s 10 largest landlords that attract the most prestigious tenants and have the highest rents.[1] Flaming the Doom Loop fears was an academic study that showed how such a reduction in office occupancy in NYC and nationally would severely reduce property values by about 44%, with commensurate resulting reductions in municipal property tax revenues.[2] To date, such drastic reductions have not appeared to gain much traction in NYC or nationally.
The most reliable data on remote work is from WFH Research. It shows that about 41% of the workers it sampled work totally remote (12%) or in a hybrid mode (29%). Moreover, about 33% of the paid full days were worked from home in our largest cities. So yes, remote work has reduced the number of hours office workers are in our downtowns, but most are still working there. And the 33% is far less than the 60%+ hours worked at home early in the crisis. So office workers have slowly been contributing to the recoveries of their downtowns by working more often in their downtown offices, if not at precrisis levels.[3]
That said, the data strongly support the hypothesis that a significant amount of remote work is here to stay, and corporate execs and downtown leaders committed to achieving a 100% Return To Office (RTO) rate may be digging a ditch for themselves by fiercely fighting remote work. What they also probably overlook is that precrisis the office buildings in these large downtowns never had a 100% worker occupancy rate. An 100% rate would mean that workers were not sick, on vacation, doing their jobs by meeting externally with clients and suppliers, or working from home.
Consequently, it is really hard to understand those who continue to want a 100% RTO rate and the extinction of remote work, since evidence strongly indicates that quest is impossible to achieve, and it probably never even existed before Covid19. Certainly, one can question whether a recovery strategy primarily aimed at achieving precrisis office occupancy rates would be productive.
Furthermore, we don’t know clearly yet how that 33% reduction in paid days worked will translate into office demand. One might reasonably suspect that it makes a lot more buildings outmoded. Yet, there is a real possibility that the effects of remote work might be mitigated to a significant degree by higher SF/worker in offices reconfigured to be more attractive to workers and heighten a firm’s RTO rate. A current primary strategic challenge for our large downtowns is how to make up for the spending and pedestrian trips of the 41% of office workers who are now working at home to a significant degree. That is what downtown leaders should now be focusing. on, not raising RTO rates.
Downtown Housing. More housing is certainly one way of doing that, but it will take a lot of time, gobs of money, new regulations, and a lot of tough politicking to achieve. It will certainly not be easy.[4] That said, it definitely still should be done, but we now need another strategic thrust capable of producing meaningful shorter term benefits.
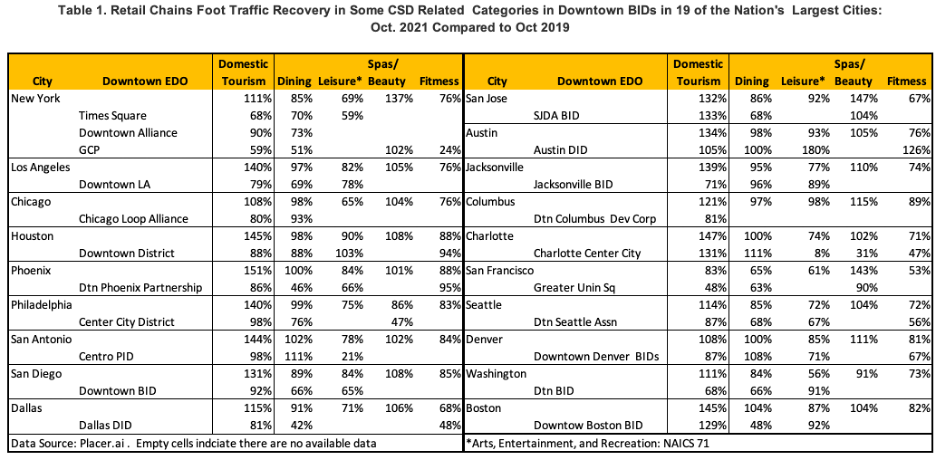
Downtown Visitors. To achieve more immediate results, another, and more practical, strategic thrust should be to increase downtown visitation by those who neither live nor work there. Data released by Philadelphia’s Center City District –see Figure 1 above –show that such visitors account for most downtown visitation and by a large margin.[5] Based on the data in Table 1 that shows domestic tourism was returning very strongly at the municipal level in 19 of our largest cities and in several of their downtowns—e.g., Austin, Boston, Charlotte, San Jose, and Philadelphia – as early as October 2021, my very strong suspicion is that researchers will soon report that this pattern characterizes many other large downtowns.
Foreign and business tourism are also recovering, but at lower rates that may take some time to regain precrisis levels, if they ever do. Business travel budgets, for example, are rebounding, though reflecting in part higher travel prices. Moreover, about 17% “of corporate travel will be replaced with virtual meetings, …suggesting a degree of permanence in the shift with companies recognizing the benefits of virtual meetings ranging from cost savings to lower carbon footprints.”[6] Still, foreign and business tourists had almost completely disappeared from our large downtowns early in the crisis, so their returns, even if at a level lower than might be desired, have been meaningfully contributing to downtown recoveries.
Strong Destinations Are Needed to Win More Visitors. My research and field visits over the past few years has led me to believe that many of our largest downtowns need to up their game when it comes to downtown visiors:
They have been living off of their laurels and too many of the attractions downtown leaders have seen as strong and unique have in fact lost their luster and a significant amount of their magnetism.
These old attractions/destinations now need a hard-headed assessment, and then where required they should be improved or replaced. People come downtown based on the strength and convenience of its attractions.
Improving the programming of public spaces may be one element of such a thrust. Improving the tenants of the small shops on side streets might be another. Right now many rely primarily on retail windows to make sidewalks interesting. Can other uses capable of doing that be brought in?
In many of these large downtowns these attractions’ ability to bring in visits by people living and working within between .25 mi and 1 mile of the core has significantly atrophied over the past 10 years or so. THESE RESIDENTS ARE NOW BEING UNDERSERVED, YET ARE WITHIN REASONABLE WALKING AND BIKING DISTANCES. They should be given priority attention.
[5] In Placer’s calculations: “Visitor” = shopper, tourist, convention attendee, concert attendees, someone visiting a doctor, etc. Resident = Their phone sleeps in the geography most nights per week. Non-Resident Worker = Their phone sleeps in a different geography at night, but routinely comes to the same location in the defined area 3-5 days per week. I want to thank Paul Levy for generously sharing these data with me.
As the readers of this blog probably know, I have spent a lot of time and effort on identifying the components of our Central Social Districts and analyzing what makes them succeed or fail. I’ve dug deeply into public spaces, movie theaters, housing, and various other components in cities large and small.
Recently, I was asked for one article that put it all together. I realized that I did not have one, so I consequently set out to write it. That article was recently published in The American Downtown Revitalization Review – The ADRR at https://theadrr.com/
Doing the topic justice meant that it would be long, about 30 pages, and more like a monograph than an article. Readers wanting a quicker take can just focus on the first six pages. However, if you are looking for more guidance about what to do and not do, you will need to dig deeper into the article.
Some of the important things I tried to do are to establish that some components are much easier and cheaper to establish than others, and which work better in different types of downtowns. I also tried to strip away a lot of the advocacy hype about some components that too often hides the challenges involved and obscures how progress needs to be evaluated, e.g., the arts venues, while spotlighting venues whose importance still goes widely unrecognized, e.g., libraries.
Here’s the article’s tease and link:
Strong Central Social Districts: The Keys to Vibrant Downtowns
By N. David Milder
DANTH, Inc.
CSDs and Some of Their Frequent Components. Since antiquity, successful communities have had vibrant central meeting places that bring residents together and facilitate their interactions, such as the Greek agoras and the Roman forums. Our downtowns long have had venues that performed these central meeting place functions, e.g., restaurants, bars, churches, parks and public spaces, museums, theaters, arenas, stadiums, multi-unit housing, etc. The public’s reaction to the social distancing sparked by the Covid19 pandemic, and the closure of so many CSD venues, was a natural experiment that demonstrated how much the public needs and wants these venues. They are the types of venues and functions that make our downtowns vibrant, popular and successful. To read more click here : https://theadrr.com/wp-content/uploads/2021/07/Strong-Central-Socia-LDistricts-__-the-Keys-to-Vibrant-Downtowns__-Part-1-FINAL.pdf