N. David Milder at DANTH, Inc.

Downtown Revitalization Specialist

Main menu

Skip to content
  • Home
  • About NDM
  • News
  • Downtown Curmudgeon
  • Reports
    • Long Island City (pdf)
    • Manhattan
    • Meredith (pdf)
    • Morristown (pdf)
    • Peoria (pdf)
    • Sherwood, WI (pdf)
  • Downtown Revitalization
  • Contact

Category Archives: Entertainment

Post navigation

← Older posts
Newer posts →

SOME THOUGHTS ON HOW TO STRENGTHEN DOWNTOWN PUBLIC SPACES IN OUR SMALLER COMMUNITIES

Posted on May 15, 2018 by DANTH

By N. David Milder

Introduction

For about 10 years now, I have been advocating in my blog, presentations at conferences and recommendations to clients that vibrant parks and public spaces are more critical than ever to the success of downtowns in our smaller communities. However, more often than I’d like, I’ve had some pushback from folks who argue one or more of the following points:

  1. They already have a public space, and nobody uses it. It’s deader than a doornail, more of a town liability than an asset.
  2. They’re a small town and their market area has a small population, so their downtown does not attract a lot of visitors who might use a public space.
  3. Their municipalities have limited finances, so it is extremely difficult to build a new public space or to significantly improve an existing one. Insufficient financial resources also mean that it is problematic to properly maintain existing public spaces or to provide the staff needed to facilitate the use of potential attractions, e.g., ping pong tables, boules courts, etc.

This article is premised on the belief that there are solutions to all of the above problems and that by incorporating knowledge of them into the designs and management of small-town public spaces, these spaces can be turned into successful and important downtown assets.

Setting Viable Aspirations for Use Levels

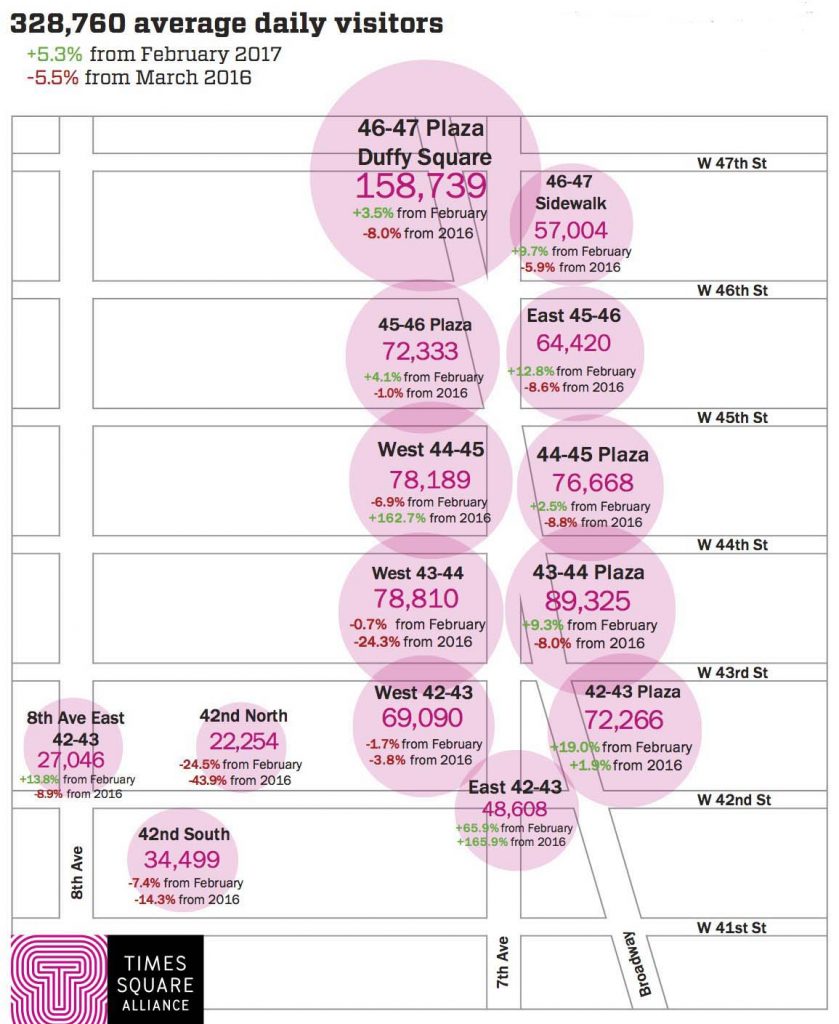
At the outset, it is essential to establish realistic expectations. These small-town spaces will never have the visitation levels of major urban public spaces where, for example, Bryant Park in New York can attract over six million visits annually and its neighbor, Times Square, draws over 300,000 pedestrians per day. On the other hand, if meaningfully activated, on days when they are not serving as the venues for events, the small-town parks and public spaces still can attract a significant number of visitors. Annual visitation levels for these small-town venues of 100,000+ are certainly possible and counts as high as 300,000/year have been achieved (1).

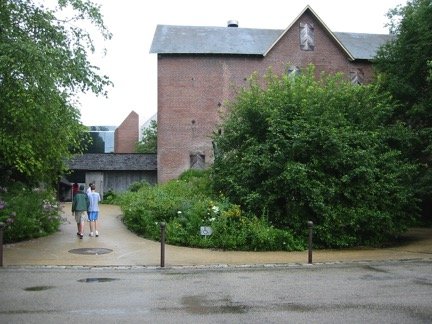
Town Green on a summer midweek afternoon, Guilford, CT

At most points in time during the weekday the small-town public spaces may have very few to no users, but this also even happens in large urban parks that still appear well activated, e.g., the Overlook section of Forest Park here in Kew Gardens, NY. However, at several times during the day — my observations suggest lunchtime, after school, and possibly 7:00 a.m. to 9:00 a.m. are the most likely times — a successful small-town public space can have a good chance of attracting platoons of users, some of whom are there with different subgroups, while others are alone. Altogether they may number no more than five or six people at a specific point in time, though their numbers on occasion can be substantially higher, e.g., 50 to 60.

Visitors Attract More Visitors. The presence of one small group of visitors helps attract other visitors, who may come at a later point in time. The existing visitors help validate in the eyes of passersby that the park has something worthwhile to see or do, encouraging them to visit as well. (This assumes the visitors’ behaviors are orderly).

To my knowledge, there, unfortunately, are no studies that show how many users a public space needs to project an image of being active, popular and worthy of a visit. But, my sense is that potential visitors make their own subjective judgments about visiting a park based substantially on who they see there and what they are doing.

Small town and market area sparse populations do not have to mean dead, inert and underutilized parks and public spaces if, on non-event days, those spaces attract several platoons of visitors at several times of the day.

Too Often, Public Spaces in Smaller Communities Focus on Just One of Three Necessary Functions

My field observations have led me to conclude that these venues can perform three important and essential functions:

  • Provide visitors with a green refuge for resting in peace and quiet.
  • Provide infrastructure assets and programs that stimulate visitors to engage in activities (i.e., to “perform”), many of which also will entertain people watchers visiting the venue. Some examples of such assets are ping pong tables, boules courts, model boat ponds, “reading rooms,” carrousel rides, ice rinks, chess tables, swings, spray pads, square dances, dance contests, etc.
  • To present events visitors can attend such as movies, plays, concerts, lectures, dance recitals, etc. Event attendees are almost always passive audiences (2).

The Pocket Park in downtown Washington Borough, NJ. This 4,000 SF park is the location for the town’s Farmers Market and several other events, but it has little appropriate seating or shade and no opportunities for visitors to engage in any activities. Its sole function is to serve as a location for events.

A Primary Focus on Events Limits a Public Space’s Potential Magnetism. One of the major problems of underutilized small-town public spaces is that their design and operation are focused on their being an events venue (see photo above). Such a narrow focus, of course, means that the space was probably easier to design. Operational costs are also probably minimized since the venue’s events are probably produced and funded by non-municipal organizations. Programming is offloaded. However, the number of their probable events means that the venue will be inactive on the vast majority of days in any year. For example, if the venue had a relatively robust schedule of events on fifty days, it still would have no events and be inactive on 84% of the days in a year.

The Critical Need for Appropriate Seating and Shade. Another major problem with many of the underutilized spaces is that they fail to provide the prime requisite for adequately performing the green refuge function: adequate seating and shade. If these spaces are to be sticky and keep visitors for any meaningful length of time, there must be comfortable seating for them. Tables and chairs, of course, also encourage visitors to eat their lunches and snacks in the public space. Food consumption and sale is a key to having a successful public space, no matter the size of the downtown or the community.

Too many of the small-town public spaces I’ve visited in the past 10 years lack such seating in adequately shaded areas. Even some of my favorites such as Mitchell Park in Greenport, NY and Central Park Plaza in Valparaiso, IN. (Happily, the situation in Valparaiso was corrected in the park’s second phase of development). On hot days, that can strongly discourage visits from anyone who is not a sun worshiper. What has been most surprising, is that even some well-known designers of public spaces have been among those failing to include anything approaching adequate shade in some of their project designs.

People Need Reasons to Visit Public Spaces on Non-Event Days. Those that provide infrastructure assets and programs that stimulate visitors to engage in activities give people the strongest reasons to visit. They substantially widen the variety of things visitors can do. Many of these attractions are there all day and every day, and they are not scheduled. These attractions also allow visitors to be active participants in the venue’s activities, rather than being just passive audience members. However, public spaces in smaller communities often lack such attractions. They have event programming, but not what may be called infrastructure programming. If a ping pong tables or chess tables were there, visitors might be stimulated to use them. Most often such attractions are not there reportedly because of a lack of financial resources to cover the costs of creating such attractions as well as the costs of the staff that would be needed to operate them, e.g., a carousel, an ice rink, a reading room, a bocce court. However, I suspect that the designers of these public spaces and/or the people who now manage them never considered providing such attractions and were unaware of their power and importance. Rectifying this situation may be the best way to strengthen downtown public spaces in our smaller communities.

A Good Location is Necessary, but Insufficient for Success, and, Importantly, a Location Can Be Improved

The location of a public space is extremely important for a number of reasons. Its visibility to downtown visitors drawn by its other attractions – retailers, eateries, services, government offices, entertainment venues, etc. — will influence how many visitors it will attract. Also, as Olmsted proved long ago about Central Park, and as more recent researchers have proved about other successful parks, parks can have positive impacts on real estate values on proximate properties and impact the desirability of commercial spaces. Where a park is located will determine what it can potentially impact. Far too many small and medium-sized downtowns have located public spaces where they are invisible to most downtown users and where they have a low potential for having significant positive economic impacts. Instead, they should be located, if possible, in what otherwise would be considered as worthy development sites, those that already benefit from significant flows of pedestrian and vehicle traffic and are proximate to other downtown assets.

The Center Street Alley in downtown Rutland, VT is a troubled public space because it is surrounded by buildings and has no visibility from surrounding streets.


 In downtown Downers Grove, IL, Fishel Park, and Its Veterans Memorial Bandstand are not visible from Main Street.

Very importantly, a public space’s location also will determine the pool of people who are its most likely users. In urban areas that pool is most easily defined by:

  • The people who live, work and study with a five-minute walk of the venue (about ¼ of a mile.
  • Those who visit this area to shop or complete medical or business chores or are staying overnight in its hotels.
  • Those who are walking or driving by the public space’s location.

In suburban and rural areas, whether we like it or not, the auto plays a much larger role in personal trips than walking. Based on my field observations, I would suggest that in suburban and rural small downtowns, the most likely users of their public spaces are to be found within a five-minute drive of the venue. Within that travel shed, I hypothesize that the propensity to visit the venue has the following hierarchy:

  1. Those who are within an easy five-minute walk, say .25 miles.
  2. Those with a doable ten-minute walk, say .50 miles.
  3. Finally, those who are more than .50 miles from the venue, but within a five-minute drive of the public space.

Learning from Bryant Park. This park in Manhattan has been widely acclaimed for its successful revitalization and popularity after decades of crime induced decline. Though it is located in the largest and strongest CBD in the USA, it’s history is relevant to all public spaces, be they in small rural towns or in large, dense urban areas.  It demonstrates a number of very important points related to activating public spaces.

Its Location Gives It Great Visibility and Access to a Huge Pool of Potential Visitors. The blocks surrounding this park are densely filled with high rise office buildings and a large number have ground floor storefronts. Its surrounding streets are jammed with cars and buses. The park’s management estimates that, on an average weekday, about 250,000 people walk by on the sidewalks of the four streets that surround the park; a significant number are probably tourists.

About 78,000 people are employed within a 5-minute walk just from the park’s 42nd Street and Avenue of the Americas entrance. Also, there are 29 hotels within 0.2 miles of the park. Times Square is within a three-minute walk, while the Grand Central Terminal, Macy’s and Rockefeller Center are both within roughly six-minute walks. This means that the park does not have to bring people into the area and its management can completely focus on the essential task of capturing users from the vast number of people who already are in the area.

A Strong Location Provides a Pool of Essential Potential Users, but the Park’s “Products” Are What Gets Them to Actually Make Visits. Bryant Park’s strong location is what gives Bryant Park access to a very large number of potential users, but it alone could not assure its success. Consider that the flow of pedestrian traffic near the park during its troubled days was probably lower than today’s, but still relatively very strong when compared to downtown locations in other cities. What turned the tide was not the new and renovated office buildings and hotels that have appeared since 1992 — they came after the park became a success– but what was happening inside the park, the new “products” it offered and how they were “packaged.” That’s what drew all the visitors into the park and encouraged them to stay. A superb location was not enough by itself, but it is still damned important.

A Location’s Pool of Potential Users Can Be Made Larger. Back in the 1950s and 1960s, before Bryant Park entered its period of steep decline, the area surrounding it was relatively healthy and successful. The park’s decline made the leasing of office and retail spaces proximate to it far more difficult. Pedestrians intentionally walked on the other sides of the streets from the park or avoided the entire area. The park’s resurgence rectified that situation. Pedestrians returned in abundance to its surrounding sidewalks. New office building and hotel projects wanted to not only be located close to it, but to claim the park’s name in their addresses. For example, the Bank of America Tower proudly proclaims its address to be One Bryant Park. However, the overall success of the commercial spaces near the park as well as the increasing strength of the Midtown CBD also had their own positive impacts on the size and composition of the park’s user pool (3).

The implications of this point can be very important for the success of small-town public spaces – redevelopment and the recruitment of residents, businesses, and nonprofits near these venues can significantly strengthen their pools of potential visitors.

Likely Pools of Potential Users in Smaller Towns.

As with Bryant Park, these pools will most likely be defined by the people who live, work, study and visit within a surrounding area, but that area will be more car trip defined than the densely urban Bryant Park’s. These pools will obviously also have far fewer potential visitors than Bryant Park’s, but then their expected user levels are also far lower.

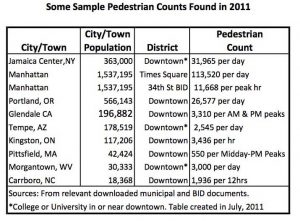
Residents. Many smaller towns have sparse residential development in their downtown/Main Street areas, though more and more are rightly trying to correct that situation. For example, I did a deep dive into successful public spaces in three smaller communities a few years ago (see the above table). Based on my observations and discussions with local officials, I concluded that none had a significant number of downtown residents, though Somerville was developing a substantial number of new units. This means that most residents probably live beyond an easy walking distance (0.25 miles) of any downtown public space or even a doable walking distance of 0.50 miles. Another challenge is posed by the fact that most adult residents who are in the workforce will be at their employment locations during the daytimes on all five weekdays. For example, here are the percentages of working residents whose jobs are located out of town in three smaller communities:

  • Valparaiso IN, population 32,000: 64.4%
  • Somerville, NJ, population 12,100: 93.6%
  • Greenport, NY, population 2,200: 80.3%.

Events held in a downtown public space on weekends are likely to attract the most adult residents because they are then most likely to be in-town and have free leisure time.

The types of residents who are most likely to remain in town on weekdays are retired seniors (the fastest growing age cohort in rural areas), school children, and at-home parents with pre-school children. Well designed and managed public spaces in smaller communities would do well to offer attractions that appeal to each of these demographic groups, who are likely to visit them at different times of the day.

As Andy Manshel argues so forcefully, in his upcoming book “What Works: Placemaking in Bryant Park. Revitalizing Cities, Towns and Public Spaces,( Rutgers University Press, Spring 2019),” finding successful attractions is largely a matter of trial and error, with much tweaking and recalibration, though greenery, suitable seating and easy access to food and drink are essentials. Below are some ideas about attractions that might be aimed at seniors, school-age children and parents with preschool children. They are offered as some possibilities that might be tried and tested while recognizing that there are probably many other possibilities that might be discovered by talking to members of these three potential park-user market segments:

  • Seniors: exercise paths for walkers, bicyclists and bird watchers; exercise classes; chess/checkers tables; a “reading room”; a putting green. Seniors are likely to appear in the morning and midday hours.
  • School-Age Children: playground equipment; bike paths; skateboard areas; soccer/football/baseball field; basketball courts; outdoor hockey rinks; summer camps; after-school supervised activity programs. School children are likely to appear after 3:00 p.m.

Childcare program in Memorial Park, Maplewood, NJ
  • Parents with Preschool Children: They have a long-demonstrated the need to get out of the house and socialize with their peers. For example, in Maplewood, NJ, and Englewood, NJ, they have turned tea shops and coffee houses into places for them to congregate. In NYC, this often happens in its parks, where the parents’ young children can also be safely entertained. For example, on any nice day just take a walk around any of the playground areas in Manhattan’s Central Park (where there may be nannies instead of moms) or in Forest Park here in Queens. Appropriate seating, amply shaded, and clean accessible toilets encourage the emergence of such social clustering. These parents usually will show up from late morning to late afternoon.

Given that the numbers of potential daytime residential users are likely to be relatively moderate, a downtown public space would do well to cultivate a structured corps of potential repeat users. This can be encouraged if downtown development officials take “location enhancement” steps such as, but not limited to, these:

  • Develop a community center in or adjacent to the public space that has daytime programs for seniors, kids after school and for parents with preschool children.
  • Locate senior housing within a very short walk of the public space that does not entail a need to cross a street. The attractions in the public space can also serve as a development incentive for such projects.
  • Invite any nonprofit that provides after-school programs for kids to use the public space.
  • Invite nonprofits that have summer day camp programs to use the public space.
  • If the public space has the needed playing fields, invite youth sports leagues to play on them.
  • Attract a coffee shop or tea house that can attract parents with preschool children to a location adjacent to the public space.

It is also helpful to avoid a kind of downtown revitalization snobbery. Chains like McDonald’s and Starbucks are often scorned by downtown activists, but in smaller downtowns, they are regularly strong magnets that attract the available daytime residential population segments. For example:

  • In Gering, NE, the downtown’s McDonald’s is its strongest customer traffic generator. It reported having consistent waves of seniors who are customers in the mid-morning and school children without adult supervision coming in after 3:00 p.m.
  • In Englewood, NJ, the downtown manager reported, back in the early 2000s, that the downtown’s Starbucks attracted a consistent group of moms with pre-school children in the early afternoons.

Encouraging their opening near a smaller town downtown public space should not be dismissed out-of-hand. Of course, independents that can perform the same functions should be also courted.


The Critical Downtown Workforce. Development density in smaller community downtowns is almost always the result of the agglomeration of businesses. This means that their downtown’s critical daytime population has a lot of people who work in or near the downtown. A very interesting research project done by Ryan and Jin of communities in Wisconsin shows just how significant are the numbers of workers who are located within acceptable walking distances and easy driving times of the centers of small downtowns (4). The above table provides Ryan-Jin data on four groups of smaller towns categorized by ranges of population size: 1,000 to 2,500; 2,500 to 5,000; 5,000 to 10,000, and 10,000 to 25,000. The top four rows of data show the number of towns in each category, the number of people employed within 0.25 miles of the downtown’s center, the number of people employed within 0.25 miles, 0.50 miles and 1-mile of the downtowns’ centers.

Morristown, NJ, has more people who work there than live there. Many visit The Green at lunchtime.

In a seminal article, Larry Houstoun’s analysis of data from the first ICSC study of office workers showed that they basically averaged trips that lasted 9-minutes to and from their lunchtime destinations (5). That trip time included time spent getting out of their buildings and then the time needed to walk from their building to their destination (and vice versa).  To bring the Ryan and Jin data more, if not fully, in line with Houstoun’s findings, I have translated those data into downtown employees who have an easy walk to its center, those who have a doable walk to its center, and those who are located beyond a doable walk, but still within an easy drive of the center. I have included the “easy drive” category because my projects in many suburban and rural communities – e.g., Englewood, NJ, Gering, NE, Sherwood, WI –have shown that their downtowns attract a lot of people who are within a 5-minute drive of their downtowns during weekdays.

Even the 143 towns with populations between 1,000 and 2,500 have significant daytime workforces averaging:

  • 400, who are within easy walks of any public space located near the center of their downtowns.
  • 354 who are within a doable 5 to 10-minute walk of such a public space
  • 406 who are beyond a 10-minute walk, but within a 5-minute drive of such a space (and who probably need another four or five minutes to get to and from their cars)

Among these smallest towns, the average workforce pool of potential users totals 1,160. The larger small towns, of course, have larger workforce pools of potential users.

Even though they are likely to be very proximate to the public space, converting them into actual visitors is very challenging simply because most of the time they are in the vicinity, they are busy working. Overwhelmingly, they are most likely to visit during their lunch breaks in the 11:30 a.m. to 1:30 p.m. time period. They will need to eat their lunches on their visits – indeed, if the public space is an attractive place to eat lunch, it will attract more of their visits, so they can eat there. This means that for the small town public spaces to capture significant amounts of workforce visits, it should have:

  • Quality food vendors in or adjacent to the space. They may be restaurants that do take out, fast food eateries, delis, food trucks, food carts, or kiosks. Whatever they are, they need to provide quality products at affordable prices. A public space in a good location will either have such food vendors nearby or be able to recruit them. But a public space poorly located in a fringe or low traffic area will neither have them nor be able to recruit them.
  • Movable seating and tables in the space where the workers can enjoyably and comfortably eat their lunches.

The workforce users of the public space can be critical pump primers for attracting additional users. Other downtown visitors, seeing them in the public space, may also be lured into visiting it and perhaps also easting their lunches there.

Tourism. Yes, tourism can provide some small town public spaces with a significant number of visitors. For example, Greenport, NY, only has a total of 2,200 year-round residents, who have relatively modest annual incomes. and a daytime downtown workforce of 399, but its Mitchell Park attracts over 300,000 visitors annually.  – day trippers from the county and beyond, second homeowners, overnight visitors at its hotels, B&Bs and marina as well as travelers passing through to use its ferries to get to Shelter Island, the Hamptons and the casinos in CT (6). Public space managers in small communities with a strong tourist flow should definitely think about ways to attract them.

That said, care should be taken to assure that the attractions the park/public space offers to attract tourists do not conflict with the attitudes and preferences of local residents. Strong, attractive parks/public spaces are usually important cornerstones of a community’s Central Social District. Nothing should be done to jeopardize that role. Indeed, strong park attractions aimed at local residents probably will also please many tourists.

Still, most smaller rural and suburban communities that I’ve visited do not have significant tourist flows, though their leaders may want to attract more out-of-towners. The focus then should be on local residents and folks who have jobs located in the community. If that is done well, then out-of-town visitors also may be attracted.

Strategically Important: Attractions That Do Not Require Much, if Any, Staff to Function

As Andrew Dane and I have written, there is a large financial toolbox available that small town leaders can use to create attractive public spaces (7). In these smaller towns, substantial financial support from the municipality definitely will be needed and essential for winning outside funding and the use of such important financial tools as tax increment financing. It probably will also be necessary to assure proper maintenance, though responsibility for programming may be given to a non-profit organization.

Recent reports suggest that parks and public spaces are now attracting increased support from philanthropic organizations and wealthy private donors (8). In Valparaiso, IN, for example, a local family recently contributed $3 million for the construction of Phase II of the downtown’s Grand Central Plaza Park.

Strategically, I would argue that the most pivotal challenge for smaller town public spaces is how to create and maintain attractions that stimulate visitors to engage in various types of activities, e.g. eating lunch or a snack, play chess or ping pong, birdwatch, ride a swing, read a magazine or book, etc. The opportunities to engage in such activities are essential if more visitors are to be attracted on non-event days.

For those concerned about how to finance the creation of these attractions and the staff then needed to operate them, there are several possible responses. First, select attractions that are relatively affordable to create and that do not require a lot of staff time, if any, to be operational. Moveable seating and tables, so visitors can eat lunches and snacks, need not be expensive to create and require no staff time to supervise.  The same for climbing rocks, adult or children’s swings and chess tables. Spray pads, popular across the nation, may need a little staff time to turn them on and off. (See photos below). These examples are not exhaustive. There are other possibilities.

Some attractions that small town parks and public spaces can have that are relatively affordable to create and do not require much staff, if any, to operate: climbing racks; spray pad; adult swings and chess/checkers tables.

Other attractions may be more expensive to implement and require staff to operate, e.g., a carousel or ice rink. Their operational costs can be covered by sponsorships and user fees. It probably will take some time to attract sponsors and meaningful numbers of users.

Finally, if paying for needed staff is a problem, then perhaps volunteers can be mobilized. Of course, the reliability of volunteers can be a problem. Involving civic groups – e.g., garden clubs, chess clubs, birdwatching groups — to provide them may be one way to alleviate the situation.

ENDNOTES

1) N. David Milder. “Three Informal Entertainment Venues in Smaller Communities: Bryant Park Series, Article 4.”  The Downtown Curmudgeon Blog. https://www.ndavidmilder.com/2014/12/draft-121414-three-informal-entertainment-venues-in-smaller-communities-bryant-park-4

2) N. David Milder.  “Bryant Park: The Quintessential Downtown Informal Entertainment Venue – Part 1.” Downtown Curmudgeon Blog. August 19, 2014. https://www.ndavidmilder.com/2014/08/bryant-park-the-quintessential-downtown-informal-entertainment-venue-part-1

3) For more about Bryant Park’s location see: https://www.ndavidmilder.com/2014/08/bryant-park-the-quintessential-downtown-informal-entertainment-venue-part-1 .

4) Bill Ryan and Jangik Jin. “Employment in Wisconsin’s Downtowns.” Center for Community & Economic Development. University of Wisconsin – Extension. Staff Paper, October 20, 2011. https://cced.ces.uwex.edu/files/2014/12/Downtown_Employment_Analysis112111.pdf

5) Lawrence O. Houstoun. “NINE MINUTES TO RETAIL: The Workplace-Marketplace.” Urban Land, December 1989, pp 25-29.

6) See endnote 1.

7) N. David Milder and Andrew Dane. “Some More Thoughts on the Economic Revitalization of Small Town Downtowns: Financial Tools.” Economic Development Journal of Canada, November 2014.  http://tinyurl.com/qcbnefh

8)  Alyssa Ochs. “Many Things: The Surprising Appeal of Funding Community Parks.” Inside Philanthropy. May 3, 2018. https://www.insidephilanthropy.com/home/2018/5/9/many-things-the-surprising-appeal-of-funding-community-parks


Posted in Central Social Districts, Economci Development, Entertainment, Entertainment niche, Informal entertainment venues, Parksmand public spaces, Planning and Strategies, Public Spaces |

Some of the Impacts of the Emerging Retail Paradigm on Downtowns

Posted on March 11, 2018 by DANTH

Part 1 of the A Closer Look at Some Strategic Challenges Generated by the New Normal for Our Downtowns Series of Articles

By N. David Milder

Introduction

As I have been arguing for about 10 years now, our downtowns, no matter their size or geographic location, will be facing a set of challenges and opportunities for the foreseeable future that are quite different from those that downtowns faced from the 1960s through the mid-2000s (1). Even as more and more downtowns are attaining great popularity and economic vibrancy, in many crucial respects they will be facing multi-faceted uncertainty and very strong forces that are ushering in significant changes. This situation will not be surprising to those who understand that downtown revitalization is a never-ending process, that even today’s successes do not vitiate the need to prepare for tomorrow’s inevitable new challenges.

Many of those changes will be behavioral, manifested in what visitors/users do downtown and the motivations for their visits. Perhaps even more disruptive – and often in positive ways – will be the changes in the ways downtown spaces, be they retail, office, residential, parking, roadways or parks will be used, and the physical changes needed to facilitate those use changes.

My observations suggest that many downtowners, who understandably are happily focused on their district’s success, are not preparing to deal with these challenges, often even though they may have already emerged in their districts. The objective of this article is to help make downtowners and their EDOs’ leaders become more aware of some of these emerging strategic challenges, so they can begin to take effective actions to respond to them.

We are seeing important changes in the ways that we shop and how we work, how retailers use their brick and mortar spaces and companies use office spaces. In a decade or two, we also will be interfacing with automobiles in entirely new ways and in anticipation of that fact, some steps should be taken either in the near future or right now. The New Normal for our Downtowns promises many large benefits, but also a lot of change and uncertainty.

The Impacts

The retail industry’s operational paradigm is undergoing a disruptive shift in a process that probably will not be completed for another decade. Today, its ultimate characteristics remain uncertain (2). Many downtown stakeholders and EDO leaders are aware of this situation and feel they cannot do much about it – after all, they think, that’s the job of the retailers. For them, the most salient characteristics of the changing retail paradigm are the reduced demand for retail spaces and the difficulty of recruiting retailers to fill vacant storefronts.  However, contrary to what many of them believe, downtowners can indeed take steps to enhance the retail shopper’s downtown experiences by attracting and strengthening their downtown’s Central Social District venues, as I have written about in many previous articles (3). In a future article, I will explore the need to better connect what is happening inside downtown shops with what is happening immediately outside on downtown streets and public spaces. Below I want to focus on a number of other issues that are integrally related to the state of today’s retailing that I think downtowners need to be more aware of and prepared to act upon.

The Decline of Strolling and Browsing Shoppers and Multi-Purpose Trips. Among downtown experts, if you peel away the layers of their understanding of how downtowns optimally work, you soon get to the notions of strolling/browsing shoppers and multi-purpose visits. The competitive advantage downtowns have long had over other types of commercial districts was their ability to enable visitors, on the same visit, to easily walk to a large number of different kinds of destinations, e.g., retailer, eatery, doctor, cinema, concert hall, public park, library, bank, real estate broker, government offices, rail or bus terminal, etc. While, retail destinations were just one type among many, in years past successful downtown retailers would be attracting a lot of users and accounting for a significant portion of their district’s pedestrian traffic. The importance of having a multi-functional downtown that sparks lots of multi-purpose trips is evidenced by the very successful malls (such as the Easton Town Center in Columbus, OH) that are designed to be multi-functional – they have residential, office, personal services, and strong entertainment components – and enable their visitors to have multi-purpose trips.

In the optimal downtown, visitors brought in for whatever reason would stroll down its streets, passing shop windows that might catch their eye and draw them inside. Once in the shop, they would browse through its aisles looking at its merchandise, often buying merchandise impulsively or unplanned.

The Internet, combined with many people leading time-pressured lives, has significantly disrupted shopper behavior so that the numbers of strolling/browsing shoppers and multi-purpose visits have meaningfully diminished. Research has shown that for several years now, “(q)quick trips make up more than half of all shopping trips” (4). Many shoppers, after first doing online searches, then make targeted, quick in-quick out visits to brick and mortar shops. They don’t stroll down the streets as much but travel straight to their retail destinations. Once inside the store, they go directly to the merchandise they previously researched online. They spend less time in the stores, do far less in-store browsing and make fewer impulse purchases. Others are “click and collect” shoppers who make their purchases online and visit the shop just to pick up their merchandise.

Americans’ concerns about convenience are understandable, given the time pressures so many of them face. Downtowns that do not try to make themselves appropriately convenient – there are right and wrong ways of doing it – are negligent in their development of an effective district customer service program.

These quick in and out shoppers are not new, but the Internet has stimulated their numbers to really burgeon – and that poses a number of problems for downtowns:

  • They are anathema to a lot of downtowners – they are not languorous strollers or browsers. Moreover, they likely to use cars and want to park in front of their destination stores. Retailers relying strongly on this market segment are likely to want drive throughs, curb cuts, etc. On the other hand, they have also helped induce retailers to adopt smaller store formats and “click and collect” programs.
  • They probably are producing a significant reduction in pedestrian trips, most visible and felt in downtowns that have significant, but not huge pedestrian flows of thousands per hour. That means the vast majority of them.
  • How can those trips be replaced? Having and maintaining a robust flow of pedestrians is more important than maintaining any specific kind of economic use. In most instances, stronger public spaces and other Central Social District venues are probably the most effective and viable responses – they are what drives most discretionary downtown visits these days.
  • The quick in and out shoppers also probably reduce the number of multi-purpose trips and the ability of downtown retailers to attract customers who will also visit other types businesses in the district. How can that be remedied? Again, stronger public spaces and other Central Social District venues are probably the most effective and viable responses.
  • These shoppers, while in their quick in and out shopping behavior mode, are likely immune to the magnetism of the quality experiential retail environments that are increasingly seen by retail experts as the secret sauce for brick and mortar stores to have a healthy flow of customer traffic. However, they can switch their shopping behavior mode at a later time.
  • While I haven’t seen any research on this, I strongly suspect that designated places near these shops for Uber, Lyft and taxis drop-offs and pick-ups would also probably appeal to these customers. Of course, customer accommodations such as these will not be easy to provide, in no small measure because they would be contrary to the way many downtown leaders want their districts to operate.
  • That said, downtown retailers probably cannot afford to write-off shoppers in a quick in and out behavioral mode. They probably represent too many sales dollars.
  • Moreover, a shopper may engage in the quick in and out behavior mode on one day and then prefer being in a languorous experiential shopping environment on an another. Target’s plans for its new stores tries to offer features that appeal to people in both the convenience and experiential shopping modes (5). Ticking shoppers off on their convenience-oriented trip may dissuade them from visiting the shop when they want the experiential retail setting. When, back in 2012, I last visited Rodeo Drive in Beverly Hills, it had short-term parking spots dedicated to shoppers picking up merchandise. Other districts may want to follow suit.
  • Because the Internet has in a very real sense increased the number of shopping trips that have a specific retail store destination in mind, it can be argued that some retailers may be satisfied with locations that traditionally have been considered less than top rank, e.g., on a side street. Moreover, at such locations, it may be easier to provide the short-term parking and drop-off/pick-up spots for on-demand car services than at the downtown’s 100% corner.

The Need to Repurpose Significant Amounts of Retail Space as Demand Declines.  The need of downtown landlords to find new uses for their vacant former retail storefronts is a growing trend and found in all kinds of downtowns. Given that so many downtown properties, especially those that are not in our largest cities, will not be owned by professional real estate companies, there is a strong probability that many local landlords will need help to identify viable new uses for their long-vacant retail spaces and perhaps, then, to attract appropriate tenants. In a very basic way, the repurposing of vacant retail stores has become an essential element of viable business recruitment strategies. The problems are that too many downtown EDOs don’t have a recruitment program and that too many have failed to see that many of their stakeholder landlords need help if they are to repurpose their problematic properties.

The reasons why so much retail space now needs to be repurposed are simple and well-known:

  • The US has far more retail space than we really need.
  • Retail chains have finally wised-up and are now opening far, far fewer stores. Those that they do open are about 25% smaller than those they opened a decade ago.
  • The Great Recession forced a great number of small independent retailers to close, mostly because their customers’ incomes had been reduced and/or threatened. Their closure rate was not greater than that of larger retailers, but their very large absolute numbers – 91% of all retail enterprises have fewer than 20 employees — created the public’s impression that they were hurt far more than other retailers (6).
  • Post-recession, successfully revitalizing downtowns, be they large or small, encountered vacancies caused by landlords asking for unaffordable rents from their small independent retail tenants.

Today, high numbers of retail vacancies in our largest, densest and most expensive downtowns are not uncommon. For example, in Q3 of 2017, Manhattan’s economy was doing quite well, but its 12 major submarket areas had an “availability rate” of retail space” – a.k.a. the vacancy rate – that averaged 18%, with a low of 7% and a high of 32% (). This strongly suggests that the landlords are asking for unreasonable rents, or much of this vacant retail space is outdated, or these spaces lack sufficient market support. The spaces that are outdated or lack market support probably should be repurposed.

Since the Great Recession, my discussions with suburban downtown managers and my own field observations have indicated that a lot of former retail spaces are being repurposed organically by market forces and rented to personal and professional services operations as well as eateries. In recent years, their storefront vacancy rates have fallen to more acceptable levels, but many suburban downtown leaders worry about maintaining a sense of vibrancy with a reduced retail drawing power. I have long argued that many of the operations in personal services pamper niches can keep store windows interesting and customer traffic levels significant. However, many of these suburban downtowns may want to bring in more Central Social District type operations such as craftspeople, childcare locations, senior centers to fill their storefronts.

Tellingly, at the Illinois Institute of Rural Affair’s (IIRA) 2018 annual conference, one of the featured presentations focused on: “opportunities for communities to create vibrant downtowns by repurposing former retail stores as entertainment, service or civic destinations which better meet the needs of today’s residents” (8). My impression is that many downtown leaders in larger towns also need assistance in properly repurposing their vacant retail spaces. This IIRA presentation also hits on essential points that leaders in downtowns of all sizes need to strongly consider: the repurposing of retail vacancies should not be just to fill an empty space but seen as an important opportunity to increase the district’s vibrancy and economic well-being as well as to improve the quality-of-life available to the people in the community.

The Reconfiguration of Retail Spaces as Their Mix of Functions Change.  There are a number of functions that can be part of a retail transaction process and that can be done in a brick and mortar downtown store:  e.g., sales, distribution, online order fulfillment, showrooming, customer service and relationship building, inventory storage, connections to the store’s other marketing/sales channels. A lot of the effort going into finding a new retail paradigm is really about determining which of these functions should be present and how they should be carried out. The decisions retailers make about these two issues are important because they probably will have large impacts on the type and amounts of brick and mortar spaces they will need. They also could have impacts on adjacent streets and sidewalks, e.g., if a retailer’s location generates a huge increase in truck traffic because it serves as an online order fulfillment center.

The photo below shows one of the interesting combinations of functions and partnerships that can occur.

Amazon package delivery lockers outside a 7-Eleven in Forest Hills, NY

 To accommodate “click and collect” shoppers, online retail giant Amazon has placed a set of package delivery lockers outside a 7-Eleven in a NYC neighborhood. This serves Amazon’s distribution needs while providing the convenience store chain with revenues from what was a dead space. Any reputable convenience store chain’s location is a potential site for such lockers.

Another example of a retailer’s interesting selection of functions is Bonobos, the online-birthed men’s clothing merchant. As of January 2018, it had opened 48 brick and mortar stores in major shopping locations around the country. While it carries lots of samples of its clothing, so customers can try them on, it has none in stock that customers can take with them after making a purchase. Their purchases are delivered to them from another central location. This retailer does not need a lot of on-site space for either storing merchandise or fulfilling orders. Many online-birthed retailers are adopting this “buy and send” approach in their brick and mortar shops.

Nordstrom has a pilot store, dubbed Nordstrom Local, that is very adventurous. It is small, only 3,000 SF, and targets upscale shoppers who can afford to participate in Nordstrom’s Trunk Club that specializes in designer clothing and providing highly personalized services. The customer interacts with stylists rather than salespeople. The only clothing in the store are those pieces that have been selected by the stylists and their customers for tying on. Customers are further pampered with coffee, juice and nail bars. Outside, space has been provided to accommodate curbside pickups. The stylists use an app to help customers select the clothing they will try on when they next visit. (9). It would not be surprising if Nordstrom soon uses artificial intelligence to let customers see what clothing items in various colors and sizes would look like on them, before selecting them for an actual try on.

The Nordstrom Local store on Melrose Place in West Hollywood. (Photo by Christina House / Los Angeles Times)

The online luxury retailer Moda Operandi offers another interesting example of how retailers may use brick and mortar locations, one that is similar in many respects to Nordstrom Local. Moda started online, but later opened a brick and mortar location on 64th Street, steps away from, though not on Madison Avenue. It is not among, yet very close to Mad Ave’s cluster of designer stores and amidst a large dense cluster of very wealthy residents. It is not a traditional store — it does not want to attract shoppers who are walking nearby. It is indifferent to pedestrian flows. It is an “appointment showroom,” where the retailer identifies the customers who will be asked if they want appointments. Those asked are filtered from Moda’s online customers who have made frequent and significant purchases. Moda knows from those purchases and their website navigation a lot about the customer’s preferences. On their appointments, Moda is able to show them a wide range of merchandise specifically selected to match their tastes. This all occurs in a very attractive, private, face-a-face setting. Moda probably sells a lot more merchandise, while the customer gets loads of privacy, recognition, and pampering as well as selections matching their preferences. Using e-commerce transactions to identify/qualify shoppers for personalized, pampering attention in brick and mortar stores may be one of tomorrow’s successful retail strategies (10).

Moda Operandi and Nordstrom Local have very strong personal service-based experiential strategies. Both are looking to have relatively small size physical presences in very well-to-do commercial districts, but that will have very high sales volumes per square foot of space. The retailing activity in their locations also is more invisible than customarily thought necessary for retail establishments. Their operational models rely on their ability to leverage pre-existing relationships – Moda through its online sales and Nordstrom through its Trunk Club – to identify customers to target for intense pampering and relationship building.

Nordstrom Local and Moda are changing the definition of what is a good downtown location for luxury retailers. Though they may be located in a downtown or neighborhood commercial district, strong pedestrian flows and strolling shoppers are irrelevant to their operational model. These locations are valued instead because they are convenient for wealthy customers to access and then receive their pampering. Also, there is a low probability their shoppers will arrive by bus or rail, travel modes that many of these shoppers consider completely déclassé.

What happens to districts like Rodeo Drive, Madison Avenue, Michigan Avenue, Newbury Street, etc. if a significant proportion of their major luxury retailers adopt a lot of the approach used by Moda Operandi and Nordstrom Local? For example, what will be the effects on who is walking on their sidewalks and the local demand for retail space. Will their retailing also become more invisible? Will they, too, have a greater need for stronger Central Social District venues to keep their sidewalks energized?

AmazonGo in Seattle. Photo by Kyle Johnson for the New York Times

The current temple for quick in – quick out shoppers is AmazonGo. Its opening in 2018 in Seattle grabbed a lot of media attention. Though relatively small, 1,800 SF, this convenience store broke new ground because its whole shopping experience uniquely involves several technologies. Check-out is automatic, not requiring a stop at a cashier or register. Shoppers need an Amazon account and the store’s app on their smartphones to enter. That allows their movements to be tracked as they move through the store and take items. When they leave the store, their account is automatically charged for the items they selected and left with.

Other large retailers, such as Home Depot and Walmart, have had self-check-outs for years, but they required the shopper to scan purchased items and then to make a credit card transaction. It took the cashier out of the equation but made the shopper do more to complete the transaction.Most shoppers did not use it. At AmazonGo the scanning and payments are automatic, the shopper needs to do nothing. Also, all customers must use the system. For years, big box stores and supermarkets have faced a lot of consumer blowback about their inconveniences – they are so large it takes a lot of time to get about and find items, checkout lines are too long, etc. Self-checkout was intended to make the shopping trip more convenient (11).

 AmazonGo is small enough to easily fit into the vast majority of our downtowns, any of them that can attract a reputable convenience store chain. Lockers for Amazon’s click and collect shoppers could easily be added on to them. The success of these stores will only reinforce convenience shopping. Of course, if you think about it, Amazon’s whole business model is based on appealing to the convenienceand value-oriented shopper.

A certainty: changes are coming to retailers near you!!! 

An uncertainty: what those changes will be.

Endnotes

 1. See for example: “The New Normal for Downtown Retailing.” Downtown Curmudgeon. Oct 29, 2009  https://www.ndavidmilder.com/2009/10/the-new-normal-for-downtown-retailing-i-introduction

2. See: N. David Milder. “Retail at the End of 2017: Apocalypse or Evolving Paradigm Shift”. .” Downtown Curmudgeon. Dec. 3, 2017. https://www.ndavidmilder.com/2017/12/retail-at-the-end-of-2017-apocalypse-or-evolving-paradigm-shift

3. See: N. David Milder. “The New Normal For Our Downtowns Cheat Sheet.” February 1, 2017. https://www.ndavidmilder.com/2017/02/the-new-normal-for-our-downtowns-cheat-sheet

4. IRI: Quick Trips Make Up More Than Half of All Shopping Trips” Convenience Store News.07/31/2017 https://csnews.com/iri-quick-trips-make-more-half-all-shopping-trips

5. Corrine Ruff. “Target’s ‘next gen’ store caters to 2 types of customers”. Retail Dive.  Nov. 13,2017.  https://www.retaildive.com/news/targets-next-gen-store-caters-to-2-types-of-customers/510740/

6. N.David Milder. “Nationally, How Small Retailers Were Impacted by the Great Recession.” Downtown Curmudgeon Blog. https://www.ndavidmilder.com/2017/01/nationally-how-small-retailers-were-impacted-by-the-great-recession

7. Cushman & Wakefield, MarketBeat Manhattan Retail Q3 2017

8. See conference program.

9. Ronald D. White. “Nordstrom’s newest store aims for a personal touch — and no clothing racks”. Los Angeles times. Oct. 6, 2017.  http://www.latimes.com/business/la-fi-nordstrom-local-20171006-story.html

10. A lot of this information is taken from my article on Madison Ave luxury shopping district https://www.ndavidmilder.com/2017/01/a-large-luxury-urban-retail-district-under-the-new-normal 

11. Jake Bullinger.” Amazon’s Checkout-Free Store Makes Shopping Feel Like Shoplifting.” The Atlantic , Jan. 24, 2018. https://www.theatlantic.com/business/archive/2018/01/amazon-go-store-checkouts-seattle/551357/

Posted in Central Social Districts, convenience, Downtown Merchants, downtown retailing, E commerce, Economci Development, EDOs, Entertainment, Formal entertainment venues, Informal entertainment venues, Luxury retail, New Normal, Pamper Niche, Pedestrian traffic, Planning and Strategies, retail chains, Small Merchants, Small Towns, time pressure, Uncategorized |

Let’s Get Real About: The Potential Audiences for Events at Arts Venues in Smaller Downtowns

Posted on August 15, 2017 by DANTH

The Arts As an Important Downtown Revitalization Tool — Redux. Part 3

By N. David Milder

Introduction

This is the third and final article in a series aimed at helping downtown leaders and stakeholders (downtowners) in our smaller communities to more accurately assess just how strong an economic engine the arts can be for their districts. The focus, this time, is on the potential audiences for the events their arts venues might put on. Audience preferences and behaviors are changing and create significant challenges for those programming arts venues. In part, this is due to the electronic consumption of arts products – e.g., books, films, concerts, recorded music, plays, operas, etc. Of course, some performing arts have long had electronic distribution via radio, recordings and some TV, e.g., all forms of popular music, country music, classical music, jazz and opera. (Texaco sponsored radio broadcasts of the Metropolitan Opera for 63 years!) However, Internet streaming and the use of personal electronic devices may have brought about paradigm-level changes in arts consumption, and its full impacts are still unclear.

Perhaps even more important determinants of changing arts consumption preferences are shifting demographics and consumer behaviors such as

  • The maturing of the huge Millennials age cohort and its arts preferences and spending patterns.
  • Our growing “minority” populations, especially Hispanics, and their arts/entertainment preferences.
  • Our long-term wage stagnation and the emergence of much more cautious consumer behaviors.

Together, they have created significant constraints on an arts organization’s ability to penetrate local consumer markets. They’ve strengthened arts venue admissions prices and convenience as determinants of personal decisions about whether or not to attend an arts event. Consequently, more and more arts organizations must choose between:

  • Charging higher and higher admission fees for high-quality events that only can be afforded by affluent households.
  • Assuming greater financial jeopardy by either lowering their prices or offering free access to a much broader audience demographically, or
  • Providing performance and exhibition events that are perhaps less attractive, but can be provided at an affordable cost for the arts organization to produce and at affordable prices for their audiences.

We may well be in the midst of a trend where in person attendance at arts events is becoming overwhelmingly for the wealthy, while the middle and lower income strata consume arts products primarily through electronic media.

Most towns with populations under 25,000 do not have large numbers of wealthy households that can most easily afford arts event admissions fees. Their arts venues must compete with arts/entertainment consumption opportunities available physically nearby as well as through electronic media. To compete effectively, they must provide sufficiently attractive events that are not financially threatening for them to produce, yet affordable for consumers. That can be quite a challenge.

A Closer Look At Arts Consumption Through Electronic Media

Just as the Internet has disrupted our nation’s retail industry, electronic access channels are changing how Americans consume arts/entertainment events and content. For example, in 2012, a large National Endowment for the Arts (NEA) survey on public participation in the arts found that 71% of its respondents had consumed arts through electronic media in the past year:

  • 61%    Used TV, radio, or the Internet to access art or arts programming
  • 38%    Used a handheld or mobile device to access art
  • 27%    Used a DVD or CD player, a record-player, or a tape-player to watch or listen to music or to programs about theater, dance, visual arts, or literature. (1)

Today, most movie watching in the US is not done in movie theaters, but on TVs and personal electronic devices – and by a very wide five-to-one margin (2). The NEA survey also found that 4% of the respondents watched operas electronically (2.1% reported attending in person), while 7% claimed that they watched some form of dance recital, musical or stage play electronically. Since 2012, those numbers probably have increased. A number of theater and opera companies have made much stronger efforts to engage in simulcasts and other forms of electronic distribution to regain audience share and strengthen their finances. The Metropolitan Opera Company in NYC, for example, will simulcast 10 operas in 2,000 theaters located in 70 countries during its 2017-2018 season (3).

Frequently, this electronic distribution has meant that famous plays and operas with celebrated performers became available to audiences in theaters – including many movie houses — in smaller communities in which they otherwise would never have appeared. This enabled these theaters to have a better “arts product” to offer in their local market areas. On the other hand, the big arts organizations’ expansion of their electronic performances may mean more competition for smaller performing arts companies, e.g., regional theaters and opera companies. Or they might be market builders for these smaller performing arts companies as, in years past, Texaco’s opera broadcasts were for smaller opera companies across the nation. Speaking with such uncertainty here is intentional since it demonstrates a key characteristic of the situation most arts organizations now are in when dealing with e-arts.

Museums across the world are rushing to put their holdings on their websites. See, for example, https://www.rijksmuseum.nl/en/rijksstudio where you can browse through 606,474 of its works of art.

Moreover, by 2013, 79% of the sales of music and videos and 44% of books and magazines in the US had moved to the Internet (4).

While it is still too early to tell with any real certainty how e-arts are impacting attendance at events held at most brick and mortar arts venues., movie theaters are an exception. Most observers agree that electronic consumption has reduced attendance at our movie theaters. Certainly, by offering households a cheaper and very convenient way to consume arts/entertainment products, they directly meet consumers’ strongest concerns about attending arts events and probably reduce to some unknown extent the need to go to another geographic location to consume them. Annual movie attendance today is nowhere near the per capita levels it reached in the 1930s and 1940s when weekly attendance was far from abnormal. More recently, aggregate movie attendance has dropped by about 14% between 2003 and 2016, though the US population had grown by about 11% (5). Also, since only about 12% of the movie industry’s annual sales come from US movie theaters, they are seen now by industry leaders primarily as a marketing tool to support electronic revenue streams, not as a major profit center (6). Some movie moguls would like to stop distributing all films to them and rely solely on pure digital distribution channels.

On the other hand, the practices of one theatre in a smaller community suggest that the distribution of arts/entertainment events over the Internet sometimes can be quite advantageous for such venues. This theatre not only offers simulcasts of arts events, but also football playoff games and baseball world series games. The sports events are offered free and the theater recoups costs from its concession stand. This theater is not so much in the arts business as it is in the entertainment business, of which the arts certainly are an important part.

Savvy arts organization leaders may, in the future, find more ways to positively leverage the electronic media.

Patterns in Arts Venue Attendance

There are many kinds of arts events. As common sense indicates and opinion surveys confirm, the content of an arts event is one of the most important determinants of an individual’s decision to attend it or not – more about this later. Knowing the popularity of the various types of arts events is critically important for any arts organization, especially new ones. Such knowledge should help arts venues and organizations shape the events they put on and how they are marketed.

About the Data. The discussion below is based on a secondary analysis of various kinds of data collected by a number of other organizations. There are two ways of looking at admissions. The first is how many times people report attending various types of events in assorted opinion surveys. The second is based on the admissions reported by arts venues or organizations, usually when they are surveyed by related professional organizations such as the League of American Orchestras or Opera America. Each has its methodological problems that cannot be detailed here without making a major diversion. Let’s just say that they should be treated with some caution, but when their findings show consistency and agreement they deserve serious attention. However, that means that the same subjects have to be looked at from two perspectives, even though it may appear repetitive

Attendance Data from Surveyed Individuals. The NEA has conducted three important large surveys on the public’s participation in the arts in 2002, 2008 and 2012. Some of their findings about attendance for a variety of performing arts events are presented in the table below.


One thing to notice is that fewer than 12% of the respondents in all three NEA surveys attended these kinds of “high culture” performing arts events. They have not captured large market shares. Moreover, other data sources indicate that attendance for these types of performances pales in comparison with that of motion pictures. For example, in 2013, about 68% of the US/Canada population went to the movies at least once in the previous year (7). The relatively small audiences for these performing arts forms suggest that arts venues that try to capture them will do well if they either have a large cluster of these potential audience members living nearby or are able to penetrate a relatively large market area in which sufficient numbers of them are present. These market areas are probably much bigger than the trade areas of the retailers in the towns in which the arts venues are located. Such market penetration will require a very effective marketing program and strong arts products.

The second thing to notice is the pattern of attendance decline that afflicted all types of events save those involving Latin, Spanish and Salsa music. The Great Recession had an obvious hand in this. Any rebounds by 2012 were uneven. The attendance declines were significant: -23%, -25%, -11% -31% and -34%. Operas and ballets, according to these surveys, were hardest hit.

The above table is based on other survey data presented in the National Arts Index, 2016 Report produced by Americans for the Arts. It is based on a collection of surveys that were done by one research firm of people attending arts events. The Index report provides attendance data for each of the types of venues/events listed for the years 2002-2013, with 2003 being set as the base comparison year. In that report, attendance statistics for 2003 are treated as having an index value of 1.0. The table above looks at just three of those years: 2003, the base year; 2010, the year after the Great Recession formally ended, and 2013, the last year for which the Index had complete information. By 2013, economic recovery was well underway, if bumpy and uneven.

Data about population growth has also been inserted in the table, with that of 2003 again having an index value of 1.0. It is there to serve as a kind of benchmark of potential arts attendance growth. If the population grows, one might reasonably expect arts attendance will, too. However, such growth would not be strictly linear. There is probably a lag time before “newcomers” become old enough or sufficiently acculturated to attend arts events. To provide some insight on that contingency, data on population growth for the 1993-2002 time period is also included. Between 1993 and 2013, there was substantial population growth — about 11% between 1993 and 2002 and about 9% between 2003 and 2013. This population growth should have had some significant positive impact on the potential size of arts event audiences, even allowing for a time lag.

The Index’s data confirms the patterns found by the NEA surveys. Compared to 2003, the decreased attendance rates for high culture performing arts events in 2013 were:

  • Dance and ballet performances, down from 1.0 to 0.87
  • Live theater shows, down from 1.0 to 0.87
  • Symphony concerts and operas, down from 1.0 to 0.79.

All had significantly fallen by 2010, probably due in large part to the Great Recession.

The table also shows that those performing arts that might be considered to be more as popular entertainments than vessels of high culture were somewhat more resistant to the recession and showed significant audience growth between 2010 and 2013. Their index scores moved over those four years from:

  • 0.95 to 1.25 for country music concerts
  • 0.93 to 1.34 for r&b/rap/hip-hop concerts
  • 1.02 to 1.17 for rock concerts.

Online visits to a number of theaters and performing arts centers in smaller and medium-sized cities across the nation showed that their schedules were dominated by popular entertainments rather than high culture performing arts events. This is probably the programming path that new performing arts venues in our smaller communities should pursue if they want to have audience appeal and financial stability.

Given our nation’s population growth and the ability of popular entertainment types of performing arts to grow significantly in the post recession years, the public’s reported lower attendance at dance and ballet performances, live theater shows, symphony concerts and operas probably are due to factors other than those associated with the Great Recession. One hypothesis is that they simply became less popular.Another is that their ticket prices are too high.

Culture Track 2014 also looked at arts audiences. It used an online survey with 4,000 + respondents. However, those respondents “were double-confirmed for interest in cultural events and attendance to at least one cultural activity in the past year” (8). The survey consequently only looks at the “culture choir,” so to speak. Doing that can be very useful because the members of this culture choir are the most likely patrons of cultural events and its always good to know your customers and their characteristics. However, less useful for the current analysis, the survey did not differentiate participation done at an arts/cultural venue in person from participation done electronically, e.g., via streaming or the radio or TV. The survey found that among these proven culture consumers, attendance between 2011 and 2014:

  • Rose for historic attractions, living museums, science museums, art museums and art galleries. Declined for children’s museums. Moreover, overall, the museums attracted the most people.
  • Rose for musical theater, but declined for dramatic theater.
  • Rose for classical music and jazz, but declined for opera.
  • Declined for both modern dance and classical dance. (9)

The attendance patterns of these proven culture consumers differed from those found in surveys of our general population that also included those who did not attend arts events. Their attendance at museums, classical music, and jazz events rose. However, opera and classical dance also showed declines among the culture consumers.

Data from Surveyed Arts Organizations. These surveys have some important built in potentials for significant errors. First, they use samples of orchestras, museums, opera companies, theater companies, etc. The question of how representative each sample is always is an issue. The response rates among smaller venues in each group, for example, has had a substantial variation that has impacted on findings. Second, the surveys are then used to extrapolate to the entire arts sector and this can also bring in errors. For example, the Theatre Communications Group (TCG) represents 1,750 nonprofit theatres. Its annual report for 2015 on aggregate attendance, average capacity utilization, tickets sold, packaging and pricing was based on the responses of 198 theatres. The results of that survey were then extrapolated out to the 1,750 theatres that are assumed to be the entire nonprofit theatre universe. Another issue is which events are being included in an organizations counts. For instance, orchestras and dance companies can have traditional concerts, but also educational and community outreach events. Often just attendance at the traditional concerts is counted.

The table below shows that two types of for-profit performing arts events – Broadway shows and touring Broadway shows – basically came through the Great Recession with larger audiences. However, as noted earlier, attendance at movie theaters — that are also for-profit ventures — declined during this period.

Consistent with surveys of the general public’s (not the culture choir’s) participation in the arts, the surveys of arts organizations found shrinking audiences for art museums and operas in 2010 as compared to 2003, and by 2013 they had not rebounded.

SYMPHONY ORCHESTRAS. Contrary to the surveys of the public, the surveys of organizations that manage symphony orchestras and nonprofit theaters in the Arts Index data show significant attendance rebounds from 2010 in 2013 and growth from 2003. It is useful to take a closer look at them.

The symphony attendance went from an index value of 0.94 in 2010 to 1.15 in 2013, while the nonprofit theatres went from .90 to 1.02. The Arts Index explains that the increase in symphony orchestra attendance counts in 2013 “reflects higher response rates to the League (of American Orchestra’s) survey among small orchestras, which have above-average levels of attendance at community engagement and education events” (10). These events, that often are contrasted with “core events,” are regularly uncounted. As the Arts Index, 2016 Report notes: “Much symphony, theatre, dance, and opera activity is offered in educational and community settings to large audiences. Those audiences, however, are not systematically counted” (11). The Arts Index apparently includes such counts when available.

In 2016, the League issued an important report that recognized a significant decline in its core audience between 2010 and 2014:

“Overall, audiences declined by 10.5% between 2010 and 2014…, broadly in line with other performing arts sectors…. This decline was sharpest within tour audiences, which decreased by almost 50% over the five-year period” (12).

However, it proudly proclaimed in the same report that:

“Over the same time period, the symphony has become more accessible to a wider range of people, with the average ticket prices dropping, free attendance rising, and orchestras engaging large and diverse audiences through a range of education and community engagement programming” (13).

The decline in tour audiences suggests that the orchestras had severely reduced drawing power for smaller concert venues in smaller communities.

That report made a number of other points that also illuminate the position many performing arts companies may find themselves in these days:

  • Free Activities. “In 2014, free attendance at orchestra performances, activities, and other musical events was at its highest point in the previous five-year period, and the lowest ticket prices offered were at their cheapest and most affordable level.” (14)
  • “Approximately one in four performances, musical activities, and events offered by League member orchestras was delivered free of charge to audiences and participants, each year from 2010 to 2014.”
  • “Opportunities for audiences to attend both (community engagement and education programs) and symphony performances for free increased over the five-year period. Indeed, by 2014, 15% of all audience members for “core performances” (a term used to refer to all performances excluding those given on tour or within the orchestra’s community engagement and education programs) were attending without charge.”
  • Lower Admission Fees. “Over the same time period, the cost of attending paid-for orchestra performances became more accessible to a wider public. Specifically, League member orchestras dropped the price of their most expensive tickets by 30% between 2010 and 2014, and that of their least expensive tickets by 12%, on average.”
  • Financial Stress Remains. “Despite this drop in ticket prices — but broadly in line with other performing arts sectors — 60% of the 65 League member orchestras reporting data to the OSR reported a drop in overall attendance, between 2010 and 2014….”

Free admissions and lower ticket prices are apparently needed, yet unable to stabilize attendance. Both, however, are likely to place the arts organizations under increased financial stress and with a greater need for contributed incomes. Yet, the biggest benefits that these symphony, theatre, dance, and opera companies may provide in smaller communities may result from their free admissions and community engagement and education programs.

NONPROFIT THEATRES. These arts organizations were having attendance problems well before the Great Recession. Again using the Arts Index data, with attendance in 2003 equaling an index value of one, the annual index scores for nonprofit theatres between 2004 and 2008 were 0.94, 0.95, 0.89 and 0.90. However, in 2012 attendance had surged to 1.07, though it declined to 1.02 in 2013.

In 2016, the Theatre Communications Group, the industry organization for nonprofit theatres, issued a major report that noted: “Attendance is an ongoing challenge and serious concern for theatres” (15). Between 2011 and 2015, attendance peaked in 2012, but then entered into several years of modest decline. Over these five years, total attendance dropped by -3.6%; -2.7% for resident audiences, and a more significant -14.1% for touring audiences. These declines occurred despite an increased number of performances for both resident and touring audiences (16).

The audience decline for the theatres is an admitted serious concern, but it has not been as severe as it has been for the orchestras, especially for touring performances. It is also interesting to compare them along a few other dimensions:

  • As with the orchestras, nonprofit theatres have a significant number of free admissions. Three to four percent of all performances are free (compared to 25% for orchestras) and 10% of their resident audiences attended free of charge (compared to 15% for orchestras). (17)
  • Community outreach and education activities are also important for the theatres, though they charge fees for them that are a significant revenue source. However, much of this outreach and educational activity appears to be related to “training,” for which fees may be expected by participants.
  • In contrast to the orchestras, nonprofit theaters increased their admission fees between 2011 and 2015: 11.4% for subscriptions, 12.3% for single tickets (18). This might be because theatre ticket prices have been lower or perceived as more affordable by potential audience members than orchestra ticket prices. Or it might be because theatres are less interested in trying to attract less affluent potential audience members.

Some Observations:

  • Fluctuations in annual attendance are to be expected at performing and visual arts events, much as any business has fluctuations in customer traffic and sales. Additionally, just as businesses were adversely impacted by the Great Recession, so were nonprofit arts organizations.
  • However, most of the performing and visual arts have had relatively unsteady and slow recoveries in attendance from the recession.
  • This struggle has continued despite significant population growth over the past two decades. Two possible explanations are: they simply have become less popular generally or they may not be winning over as many young people and immigrants as they did in the past.
  • Another troubling factor about arts attendance is that there seems to have been a critical and steady decline in the number of people who frequently attend arts events. For example, Culture Track’s surveys found that in 2007, 31% of its culturally engaged respondents reported attending three or more events per month, but in 2011 that number had fallen to 22% and in 2014 it was only 15% (19). The arts’ core consumer base appears to be shrinking.
  • The degree to which potential audience levels at brick and mortar arts venues have been clipped permanently by electronic consumption channels is still unclear, but such a diversion probably has occurred. For example, Culture Track’s 2014 survey found that about 8% of its respondents reported less frequent attendance at cultural events, because they were “experiencing culture in alternative ways” (20).
  • Some types of performing arts, however, have demonstrated a significant ability to quickly rebound from the recession and to sustain meaningful audience growth in the post-recession years. These performing arts are conventionally seen as popular entertainments – e.g., salsa music, R&B, rap, hip hop, etc. Those that have struggled most are those often associated with high culture or affluent audiences: e.g., opera, ballets, symphony orchestras.
  • In this dynamically changing environment, it is important that arts venues and arts organizations in our smaller communities know who their potential audience members are, what types of arts they are likely to consume, and the spending power they likely would bring with them.
  • To win and maintain broader community support, they also should be prepared to provide a significant amount of community outreach and education activities as well as a significant number of free admissions. Doing this will likely increase their need for contributed incomes significantly.

Arts/Cultural Venues and Organizations, For-Profit or Nonprofit, Are in the Entertainment Business

Unless they have a sufficient base of very rich, very culturally superior and very socially snobby people to comfortably support them, any arts or cultural organization should guard against coming across to the public as having those attributes. Not only is it morally offensive, it’s bad for business and their survival.

People engage in cultural activities for basic reasons of personal enjoyment and social conviviality. For example, Culture Track’s 2014 survey found that the strongest reason its large sample of people who attend cultural events gave for making cultural activities a part of their lives was that they were entertaining and enjoyable, 93%. It was followed by being able to spend time with friends and family, 83% (21).

Also, as was noted above, the performing arts that are conventionally seen as popular entertainments are precisely those that have done best over the past decade. In many small and medium-sized communities, their successful performing arts centers (PACs) or theatres have recognized this fact and structured their programs accordingly.

Event Content and Admission Cost Drive Individual Attendance Decisions

Culture Track’s 2014 survey investigated the positive and negative elements – termed motivators and barriers – that are involved in an individual’s decision-making about attending cultural events. It listed many factors. However, as can be seen in the table below, event content and admission cost stand out because they rank either first or second among both the motivators for and the barriers to attendance. Content is the most important motivator of attendance; event cost is the most important barrier.

The above discussion of arts audience admissions delved into the popularity of different types of arts event content as well as their fluctuations and uncertainties. In the first article in this series, considerable attention was focused on the need for arts venues/organizations to have strong “arts products.” If an arts organization/venue is to succeed, it must certainly provide the types of events that local arts consumers want and enjoy.

The Culture Track survey also shows that the desirable arts product must also be provided at a price that people can afford.

Affordability is a function of the product’s price and the consumers’ incomes. Those with higher incomes obviously can afford more things. The table below shows that households in the top income quintile account for 54.8% of all household expenditures for entertainment fees and admissions — that includes those for arts/cultural events. The top 40% of households by income account for 75.4% of all entertainment fees and admissions expenditures. For smaller communities that want to develop strong arts venues that draw significant audiences, the distributions of household incomes in their market areas should be significant factors in determining their admissions price structures.

The Content – Ticket Price Connection. This is very important: people will be willing to spend more for content they really like. They also are less likely to spend much on tickets for events with content they are unfamiliar with or dislike. This connection is aptly illustrated in this quote from a report from the Wallace Foundation:

“I can see myself paying $100 for a show I’ve wanted to see for a long time, but not more than $50-60 for a normal show, and really more like $20 to 30 if I can.” (22).

Impact of Deliberate Consumers. Americans have suffered from wage stagnation for decades and the Great Recession sparked a wave of more deliberate and conservative consumer behaviors (23). Though this more deliberate consumption has eased somewhat with economic recovery, it still remains very strong among middle-income households and even continues to impact on luxury retail purchases. It also has had its impacts on attendance at arts events. For example, Culture Track’s 2014 survey found that 40% of the respondents reported attending fewer culture events because of economic conditions, and among them:

  • 82% reduced expenses across the board
  • 51% cut back on leisure activities
  • 51% reprioritized their expenditures of leisure time and money
  • 20% experienced culture in alternative ways (24).

Some Ticket Prices. Expectations about ticket prices often are higher than they actually are. In one study, for an actual ticket costing $20:

  • Millennials estimated it would cost $44.57
  • Gen Xers estimated it would cost $34.00
  • Boomers estimated it would cost $29.05. (25)

Generally, smaller communities have arts organizations with smaller audiences and smaller budgets – and lower ticket prices, as demonstrated in the table below that shows ticket prices for 38 opera companies by the sizes of their annual budgets.

A good benchmark for setting ticket prices is the average cost of going to the movies in the local entertainment market area. In 2016, the average ticket price was $8.65 nationally, with significant local variations. Throw in about $ 4.50 for popcorn and another $4.50 for a soda and that brings the total up to about $19.00. The more seats that are available near that price, the larger the potential audience — though admission revenues may well decrease.

Online visits to several museums, theaters and performing arts centers in smaller communities showed:

  • Museums generally have admission fees of $20 or less, with lower fees for students, children, and seniors. Not much different than $25 at MoMA in NYC or $20 at the Art Institute of Chicago for local residents.
  • Tickets for performing arts events ranged from $20 for a play done by a local theater company located in a small rural town, to around $40 to $65 for music concerts in larger rural regional centers, and to a range of between $108 and $1,748 for a seat at a Tom Jones concert at a PAC in a large, densely populated and relatively affluent suburban regional area.

A very important determinant of an arts venue pricing structure may be the definition of its primary mission. If it is to serve residents of the surrounding community and enhance their quality of life, then it will likely have inherent pressures to have lower prices and more free performances that incentivize greater community attendance. If, on the other hand, the venue/organization is tasked with enhancing the area’s prestige or to draw more affluent visitors into its district, then its targeted audiences and pricing structure would likely be quite different.

The Social Aspects of Attendance

Going to arts events with friends and family is an important motivator for attendance. Culture Track’s 2014 survey found that 83% of their proven culture consumer respondents cited spending time with friends and family as an important reason for their engagement in cultural activities. It also found, as displayed in an above table, that:

  • 83% said they were motivated to attend cultural events because they were invited by family or friends.
  • 73% were motivate because their spouse/partner was interested (26).

A report on building Millennial audiences done for the Wallace Foundation found that socializing and having someone to go with are important factors when they decide whether or not to attend an arts event (27). Culture Track 2014 found that: ” Millennials are far less likely than older generations to go to a cultural activity if it means going alone.”

This behavior pattern explains why arts venues can be such important elements in a downtown’s Central social District and why it will probably become even more important as Millennials age.

The Rising Importance of the Millennial and Minority Market Segments

Our nation is changing demographically. Minority populations are growing rapidly and projections indicate that within about three decades, the white population will be a minority. The largest growth has been among Hispanics. Also, Millennials recently became the largest age group in our population, supplanting the Baby Boomers. The fact that their entry into adulthood has been heavily stamped by effects of the Great Recession means very significant changes are appearing in consumer behaviors – and that includes the consumption of arts products.

Minorities. One of the best windows on the importance of the minority market segments is to look at attendance in movie theaters.

It is amazing how infrequently movie theaters are mentioned when the enhancement of downtown arts offerings is under discussion. Nevertheless, they are often critical cornerstones of many downtown entertainment niches and Central Social Districts. Unfortunately, their future, especially in smaller communities, remains uncertain, even though lots of small cinemas recently successfully dealt with the threatening need to adapt to the digital distribution and projection of films. Besides the presence of a number of Hollywood moguls who want to dump movie theaters as a distribution channel, theater owners are increasingly adopting a strategy that will lead to significantly higher picket prices. It is seen as the best way to cope with declining attendance.

For example, the number of movie tickets sold in 2016 was 86% of the 2003 sales (see above table). On the other hand, gross revenues from ticket sales had increased by 123%, and ticket prices had jumped by 143%, about 12% higher than inflation. To deal with declining attendance, theaters owners have determined that their financial future rests on offering more amenities – big leather reclining seats, terraced seating, restaurant type food and drink, 3D and IMAX screens, etc. – for which they can charge higher fees. The viability of such a strategy is most problematic in smaller market areas from the perspectives of both the theater owner and movie goers. For more on this see: https://www.ndavidmilder.com/2014/05/downtown-formal-entertainment-venues-part-4-movie-theaters

Movie attendance, however, has not been uniform across all ethnic groups. As can bee seen in the table above, between 2012 -2016, the average per capita movie attendance of African Americans, 3.86, Hispanics, 5.46, and Asians, 4.90 were higher than that of Caucasians, 3.36.

This, of course, is also reflected in annual ticket sales:

  • Although African Americans, Hispanics, and Asians only account for about 38% of the US population, they account for 49% of the movie tickets sold.
  • Caucasians represent 62% of the population, but account for 51% of the tickets sold.
  • Hispanics over the five-year period accounted for 21% of the tickets sold, but in 2012 they accounted for over 30%.
  • The trend is for minority movie attendance to grow and for Caucasian movie attendance to decline.

One might wonder where many movie theater operators would be today without their ethnic minority patrons?

Movies are an art form that can attract minorities with relative ease compared to many other performing arts for three reasons:

  • It is familiar to them. Even if they are immigrants. They do not have to learn what they are about.
  • It is relatively very affordable.
  • It is probably easy for minority patrons to go to a movie with friends and family, because prices are affordable and cinemas are probably relatively easy to get to.

 However, as the growth of Salsa and Spanish music, Rap and Hip Hop suggest, the influence of these minority groups will have an increasing impact on our art forms in the future as jazz and rhythm and blues did in the past. Of course, as their population sizes and household incomes increase, so will their impacts on visual and performing arts audiences.

Millennials. In 2015, Millennials (e.g., those aged 20 to 36 in 2017) became the nation’s largest living generation, then numbering 75.4 million people. Baby Boomers (aged 53-71) were the second largest, with 74.9 million (28). While the Boomers have far more purchasing power, they are aging out. The Millennials, many of whom had the early years of their careers and incomes hindered by the Great Recession, the slow growth of our economy over the past decade and/or very burdensome student loans have started to have their major impacts on our economy — and on the arts. Moreover, their run is only in its early stages and it will be a long one.

As was noted above, the affordability of ticket prices is a key factor in individual decisions about attending arts events and in the determination of the sizes of arts audiences. The levels of household incomes and discretionary dollars structure how much individuals can pay for arts admissions. A report issued by the Wallace Foundation found that compared to prior generations at similar ages, Millennials are more financially challenged:

  • They have lower annual earnings.
  • They have lower net worth.
  • Higher percentages of them have student loans and the loan amounts are much higher (29).
  • It is unlikely that these lags in earning and net worth compared to prior generations will disappear even as their careers mature.

The Wallace Foundation study also looked at attendance by 18 to 34-year-olds in 1992, 2002 and 2012. There were declines in all of the studied performing arts: theatre-musicals, jazz, non-musical plays, classical music, dance (non-ballet), ballet and opera. What is interesting is that save for opera, all the others were already in decline in 2002 when compared to 1992 (30). The performing arts’ problem with attracting young adult audiences apparently is not that new.

Culture Track’s 2014 survey found that Millennials was the generation that attended the most events per month and that had the most folks who frequently attended cultural events, i.e., 3+/mo (31). However, since that survey also found that the number of frequent cultural consumers had declined by half since 2014, it is likely that their number has also declined significantly among Millennials compared to prior generations when they were of the same ages.

Ticket pricing will probably have a big affect on an arts venue’s ability to attract Millennial patrons. These venues also will have to compete with other entertainment events that may be more affordable. Moreover, Millennials – who grew up using the Internet and digital devices – are more likely to consume art products digitally, and those arts products are also likely to have the advantages of lower costs and greater convenience.

 The competition for Millennials’ attention, time and money when it comes to entertainment can be pretty fierce. Arts venues and the organizations that mange them in our smaller communities must be ready and able to compete.

Endnotes.

1) National Endowment for the Arts. How A Nation Engages With Art. Highlights From The 2012 Survey Of Public Participation In The Arts. https://www.arts.gov/publications/how-nation-engages-art-highlights-2012-survey-public-participation-arts-sppa . Hereafter referred to as NEA12.

2) N. David Milder. Downtown Movie Theaters Will Be Increasingly In Peril. February 24, 2008. See: https://www.ndavidmilder.com/2008/02/downtown-movie-theaters-will-be-increasingly-in-peril . Hereafter referred to as Movies08

3) Data from the Met’s website.

4) Ali Hortac?su and Chad Syverson. “The Ongoing Evolution Of US Retail: A Format Tug-Of-War,” National Bureau Of Economic Research, Working Paper 21464, http://www.nber.org/papers/w21464, August 2015, pp. 33, p.24

5) Data from http://boxofficemojo.com/yearly/

6) See Movies08

7) Motion Picture Association of America. “Theatrical Market Statistics 2013.” P.2.  http://www.mpaa.org/wp-content/uploads/2014/03/MPAA-Theatrical-Market-Statistics-2013_032514-v2.pdf

 8) LaPlaca Cohen and Campbell Rinker. Culture Track 14, p.2.   http://culturetrack.com/wp-content/uploads/2017/02/Culture_Track_2014_Supporting_Data.pdf  Hereafter referred to as CT14

9) ibid. p.7

 10) Roland J. Kushner and Randy Cohen, National Arts Index 2016, p. 71. Americans for the Arts. http://www.americansforthearts.org/by-program/reports-and-data/legislation-policy/naappd/national-arts-index-an-annual-measure-of-the-vitality-of-arts-and-culture-in-the-united-states-2016. Hereafter referred to as NAI16.

 11) ibid.

 12) Zannie Giraud Voss, Glenn B. Voss, Karen Yair with Kristen Lega. “Orchestra Facts: 2006-2014. A Study of Orchestra Finances and Operations, Commissioned by the League of American Orchestras” November 2016, p.1. https://www.arts.gov/sites/default/files/Research-Art-Works-League.pdf

13) ibid. p.7.

14) ibid. All of the points in this series of bullets come from pages 4-7.

15) Zannie Giraud Voss and Glenn B. Voss, with Ilana B. Rose and Laurie Baskin.   Theatre Facts 2015: A Report On The Fiscal State Of The U.S. Professional Not-For-Profit Theatre Field. Theatre Communications Group. 2016, pp. 37. P 10.. http://www.tcg.org/pdfs/tools/TCG_TheatreFacts_2015.pdf

 16) ibid.

 17) ibid.

 18) ibid. p.11.

 19) CT14, p.9.

 20) ibid. p.12

 21) ibid p.25

 22)   “Building Millennial Audiences: Barriers and Opportunities.” The Wallace Foundation, Building Audiences for Sustainability January 2017. Analysis Conducted by Marketing Research Professionals, Inc. Pp.51, p. 21. Hereafter referred to as Wallace.

 23) See: https://www.ndavidmilder.com/downtown-revitalization/the-deliberate-consumer

 24) CT14, p.13

 25) Wallace, p.22

 26)CT14, p. 25

 27) Wallace, pp.23-25

 28) Richard Fry. “Millennials overtake Baby Boomers as America’s largest generation. FACTTANK. Pew Research Center. April 25, 2016. http://www.pewresearch.org/fact-tank/2016/04/25/millennials-overtake-baby-boomers/

 29) Wallace p.9

 30) ibid., p.14

31) CT14, pp. 10-11.

Posted in Central Social Districts, Creative Class, Deliberate Consumer, Downtown Niches, Downtown Redevelopment, E commerce, Economci Development, Entertainment, Entertainment niche, Formal entertainment venues, movie theaters, New Normal, Planning and Strategies, Small Towns, The Arts, Trends, Uncategorized |

Let’s Get Real About*: The Arts As An Important Downtown Revitalization Tool — Redux. Part 1

Posted on June 18, 2017 by DANTH

By N. David Milder


“Aeschylus and Plato are remembered today long after the triumphs of Imperial Athens are gone. Dante outlived the ambitions of thirteenth century Florence. Goethe stands serenely above the politics of Germany, and I am certain that after the dust of centuries has passed over cities, we too will be remembered not for victories or defeats in battle or in politics, but for our contribution to the human spirit.”

–John F. Kennedy


Back in 2014 and 2015, I wrote a number of articles related to the development of downtown arts and entertainment niches (1). Their thrust was that while developing and operating formal enclosed venues for arts and entertainment uses can strengthen downtown revitalization efforts, they also are often fraught with organizational complexities, financial difficulties and negative trend headwinds that are overlooked by ardent supporters of arts projects. The result is too many underperforming or even failing formal arts venues. Moreover, many of the purported benefits of these arts venues might be more reliably and cheaply provided by well-activated public spaces, parks and third places.

I recently attended a very good conference that was aimed at mainly small and medium-sized communities located in rural and suburban areas. However, I came away very worried by the strong and incautious advocacy of the arts as a small town revitalization engine I encountered there. These arts advocates, some new to the faith, did little to indicate the wide range of challenges such a strategic approach is likely to encounter. Nor did their audience seem to have any awareness of such challenges. Many of them seemed to be eagerly looking for something to take the place of the weakening retail in their downtowns, and the arts appeared to be a very appealing solution. Alas, arts projects may be highly desirable, but it is foolish to assume they are quick or easy to do.

Part of the problem had to do with how most of our conferences use success stories for their content spines. It seems that in contrast to Silicon Valley, we in the downtown revitalization field only learn from our successes, not our failures. However, it also may be due to the fact that not many downtown leaders and experts are providing the needed information. This has prompted me to update my research and write this article. Let me be clear: its objective certainly is not to rail against the arts as an economic asset. It is, instead, to help downtown leaders and stakeholders better calibrate their arts development efforts, so that more of them will succeed, because they properly mesh with local resources and opportunities.

One reason that great care needs to be taken when using the arts as a key element in a downtown revitalization strategy or program is the hybrid earned/contributed incomes business model that nonprofit arts organizations use. It is more complex and consequently requires a wider set of management and leadership skills than the simpler for profit model used, for example, by the organizations that own and operate our movie theaters or put on our touring Broadway shows. The hybrid arts organizations are both charities with a built-in need for substantial contributions from individuals, businesses, foundations and/or government agencies as well as businesses that sell arts products (including performances and exhibitions) to earn incomes. Unfortunately, as events in recent years have demonstrated, these contributions are very dependent on economic and political conditions and can be very erratic. This model has a high level of financial failure as measured by having budget deficits. The use of the hybrid business model is a de facto admission that these arts organizations cannot cut it financially on just their earned incomes. Some may argue that the hybrid model benefits from greater diversification than the for-profit model, but that may mean, with tight budgets and unreliable donors, more ways to fail than to be safe.

On the earned income side, things these days have not been easy either. For over a decade, all types of arts organizations, be they nonprofit or for profit, have been facing a disconcertingly changing pattern in the way Americans participate in the arts. More arts participation is being done electronically. Some of the performing arts – e.g., opera, ballet, movies, symphony orchestras, jazz – have reported significantly reduced attendance, while others, such as Broadway shows and nonprofit theaters, have experienced serious and sometimes financially stressful fluctuations in attendance. “High culture” performances were losing popular support, while “low culture” entertainment performances (salsa music, comedians, rock bands, rap groups) were gaining popularity. As a consequence, many renovated theaters and new PACs have had hard financial times because they couldn’t find the right programming for their market area. They also had not done their homework.

While I acknowledge that arts venues can strengthen a downtown’s central social district functions and that credible research has demonstrated that they can have positive economic impacts, the impacts on their downtowns may not be as glorious as purported in project proposals – or conference presentations. My research has shown that too often the potential positive impacts of arts projects on downtowns are grossly misunderstood, and their actual magnitudes often go unmeasured, though wrongly assumed to be large. On the other hand, their negative impacts are far too often conveniently overlooked, even if easily noticed and measured.

The demographics of a downtown’s market area have an enormous influence on how many visitors and the amount of the financial contributions downtown arts venues can attract. Arts advocates too often put the cart before the horse, focusing on purported positive impacts, while not looking closely enough at the demographics that influence an arts project’s or an arts organization’s viability.

Another hard truth is that many small and medium-sized communities probably will have stronger positive impacts on their downtowns and a consequent higher ROI by investing in strongly activated parks and public spaces as well as in the micro businesses of local artists and artisans, than in building and operating covered venues for the performing arts and museums.

The Lack of Proper Calibration of Aspirations to Available Resources and Opportunities

Through my travels, arts consumption and professional activities, I have encountered many arts organizations that are in such a precarious financial situation. Some are huge with budgets over $100 million, such as the Metropolitan Museum of Art in NYC. Others are large and well-known entities in our big cities such as the numerous symphony orchestras that recently have been downsized and/or re-organized. There are also the PACs that have struggled in suburban communities such as Englewood, NJ, South Orange, NJ, and White Plains, NY. Many small downtowns have museums with very limited operating hours or theaters and cinemas on the verge of failure. In dense, modest-income urban areas, large amounts of community energy and scarce funds have been used to develop attractive arts venues, such as the Jamaica Performing Arts Center in Queens, NY, that are largely underutilized and need deep subsidies to survive. Stories of local governments having to step in to save the day are easy to find: e.g., the city to save a museum in Gering, NE; the county to save a PAC in Englewood, NJ. I could add many more examples to this list, but won’t for the sake of brevity.

My takeaways from all of these examples were:

  • All suffered from the same underlying problem: their aspirations were not properly calibrated to the resources and opportunities available to them. Their eyes proved bigger than their stomachs or wallets.
  • Careful calibration is required to a large degree because of the shaky nature of the business model used by most arts organizations (and other nonprofits) and a changing environment that has made both earned and contributed incomes significantly less reliable.

 The Hybrid Business Model Used by Arts Organizations Has Major Inherent Problems

A Structural Propensity to Have Deficit Annual Budgets. Roland J. Kushner and Randy Cohen in their National Arts Index 2016 paint a picture of arts organizations that should be carefully considered by any downtown leaders who are thinking about making the arts or an arts project a central component of their revitalization efforts. A very large number of arts organizations do not have break-even budgets and consequently, raise concerns about their long-term sustainability. According to Kushner and Cohen:

“Arts nonprofits continued to experience financial challenges: The percentage of arts organizations operating at a deficit has ranged from 36 percent in 2007 (during a strong economy) to 45 percent in 2009 (the deepest part of the recession). In 2013, a time of improved economic health, 42 percent of arts nonprofits still failed to generate positive net income—a figure that raises concerns about the long-term sustainability of arts organizations that are unable to achieve a break-even budget. Larger-budget organizations were more likely to run a deficit, though no specific arts discipline is particularly more likely to run a deficit…. (I)t is clear that the budget fortunes of nonprofit arts organizations got worse during the Great Recession and have been very slow to recover.” (2)

Consequently, it would seem very reasonable and very prudent for downtown leaders to be extremely cautious about using an economic sector populated by organizations with a very high propensity for financial instability as an engine of downtown revitalization.

The Proven Long-Term Uncertainty of Their Revenue Streams. The hybrid model is based on revenues coming from many very different sources and obtained through different means. According to Americans for the Arts: “Support for the nonprofit arts is a mosaic of funding sources – a delicate 60-30-10 balance of earned revenue, private sector contributions and government support.” (3) Here’s a more precise breakdown by AftA:

  • 60 % Earned Income
  • 31% Private Sector Contributions
    • 24% Individuals
    • 4% Foundations
    • 3% Corporations
  • 9% Government support
    • 4% Local Government
    • 2% State Government
    • 3% Federal Government

Other research has found a slightly different funding mix. The National Endowment for the Arts (NEA), using data from the Urban Institute and Census Bureau for 2006-2010, found that the revenue sources for nonprofit performing arts groups and museums were:

  • 55.1% Earned Income, Interest And Endowment Income
  • 38.2% Contributions From Individuals, Foundations & Corporations
    • 20.3% Individuals
    • 9.5% Foundations
    • 8.4% Corporations
  • 6.7% government grants
    • 3.3% local government
    • 2.2% state government
    • 1.2% federal government (4)

Earlier, pre-Great Recession estimates showed that earned incomes accounted for about 50% of the revenues of nonprofit arts organizations.

Perhaps it is best to amend AftA’s statement to read that arts organization funding has been a delicate balance of 50% to 60% earned income, 30% to 40% private sector contributions and 10% or less from government support.

In any case, there is general agreement on the types of funding sources and the fact that there are many of them. In a 2012 study of the factors that challenge the financial sustainability of nonprofit organizations, the RAND Corporation’s authors placed at the top of their list:

“Risk of reliance on external funding sources and streams. In contrast to for-profit organizations, nonprofits in the United States depend on diverse sets of funding sources and streams of funding to sustain their operations. Most nonprofits receive funds from multiple sources (e.g., government, foundations, private donors) and streams (e.g., grants, contracts, membership fees). Substantial cutbacks in both government and foundational funds suggest that nonprofits should develop or revisit their fundraising plans to support financial sustainability.” (5)

At the level of the individual organizations, there can be additional variation. For example, The Goodspeed Theater in East Haddam, CT, gets about 26% of its revenues from contributions and about 57% earned income, while the Weston Playhouse Theater, in Weston, VT, gets 63.4% of its revenues from contributions and about 29% from earned income (6).

 Both theater managements will differ from for-profit arts organizations in their need of staff and board members who are adept at marketing to individuals and organizations that are potential financial donors. The skills involved are quite different from marketing tickets to a movie, Broadway play or ice show to the public. Even the skills needed for obtaining grants from government agencies can be quite distinct from those required to network with and cultivate very wealthy donors.

Does the Weston Playhouse’s greater reliance on contributed income over earned incomes make it structurally more financially vulnerable than the Goodspeed that relies more on its earned income? It seems very likely to me.

Demographics Really Count

Annual Contributions to the Arts by Household Income (table from a report done for Google)

Re: Contributed Incomes. After earned incomes, contributions by individuals are the most important source of revenues for arts organizations nationally. Research has shown that contributions to the arts correlate with household incomes. The table above was generated in a 2007 report for Google that was done by the Center for Philanthropic Giving at Indiana University. It shows that 93.4% of all charitable giving to arts organizations is from households with annual incomes over $200,000. Among the vast number of households with incomes beneath $100,000, just 6.2% contributed to the arts, and they accounted for just 4.4% of all contributions to the arts by individuals.

While I strongly suspect that this report might have met with criticisms, I think it is possible to more generally restate its findings to the more certainly defensible conclusions that:

  • Most of the dollars contributed by individuals to the arts come from rather affluent households
  • Financial contributions to the arts increase with household incomes, and the increases get larger as the incomes get bigger.

Poor and small- and medium-sized communities will likely have below average percentages of very affluent households who are either year-round residents or second home owners. The ability of their arts organizations to have 30% to 40% of their revenues come from private sector contributions is consequently strongly impeded. Moreover, they consequently are relatively more dependent on winning contributions through grants from foundations, businesses and, especially, government agencies.

Re: Earned Incomes. The potential consumer dollars that arts organizations can tap is calculated by the number of people in their market area and their annual expenditures for arts performances, exhibitions, and products. Small- and medium-sized communities probably will have the obvious inherent problem of a market area that is not densely populated. An additional potential problem is, again, their probable comparatively low household incomes.

As can be seen in the above table, nationally, households with incomes over $103,057 account for 54.8% of all expenditures for entertainment fees and admissions, which includes admissions to arts and cultural venues such as theaters, cinemas, PACs, concert halls, etc. Adding the households with incomes over $62,587 shows that the most affluent 40% of our households account for 75% of the expenditures for entertainment fees and admissions. Arts venues in market areas lacking substantial numbers of such households, especially those in the top income quintile, will be hard pressed to have substantial revenues from their paid admissions. Small- and medium-sized communities are likely to have such market areas with relatively few affluent households. They are likely to be absent in poor communities.

Endowment and Interest Incomes. The NEA’s study found that 14% of the annual revenues of performing arts groups and museums come from these two sources. Such arts venues in poor or small- and medium-sized towns, with relatively small budgets and in perennial hand-to-mouth financial situations are not likely to have much interest income and are even less likely to have any endowments.

The Ups and Downs of Business, Foundation and Government Funding for the Arts Matters.  Arts organizations are very sensitive to even slight variations in their philanthropic funding levels. As Randy Cohen at Americans for the Arts wrote in 2015: “We pay close attention to philanthropy because even small fluctuations in contributed revenue can be the difference between an arts organization broadening its reach or facing a deficit.” (7)

Moreover, charitable giving for the arts has a history of significant fluctuations. Here, again, is an astute observation from Cohen: “The arts compete well for charitable dollars in good times, but tend to struggle in a down economy as many funders move their giving to what they perceive are more pressing human service needs.” (8)

The above table shows how total contributions to arts nonprofits varied annually from 2008 to 2016 (9). In two years there were decreases, but even when there were increases, the amounts could vary from just 1.6% to a more robust 15%.

Funding From Foundations.   After individuals, foundations are the next most important source of contributions to arts organizations. The National Arts Index for 2016 found that:

“Along with the number of grants, foundation dollar amounts increased from 2001 through 2012 only modestly, by six percent to $2.2 billion, when measured in current dollars; this leads to a decrease of about 18 percent when adjusted for inflation.” (10)

 Major Corporate Giving.  Data from the Conference Board indicate that contributions from large corporations declined by about 51% from $418 million in constant dollars in 2006 to about $215 million in 2010. However, it has rebounded somewhat lately, about 27% between 2013 and 2015 (11). Smaller firms, of course also contribute to the arts, but at lower levels in terms of numbers and amounts (12).

Government Funding. At this point in time, June 2017, the future of the NEA is again very much in doubt. However, as some conservative political observers have been quick to note. It accounts for only a relatively small percentage, about 1.2%, of the funding of our arts organizations.

State and local government arts funding responded to the Great Recession by dipping significantly between 2008 and 2012, but they have followed a positive, if uneven, trajectory since then.

However, looking at a longer time frame shows a different picture. As Ryan Stubbs, another astute observer of the arts funding scene, has noted about the 1994-2014 period:

“Although the nominal increase over the past twenty-one years is positive, the landscape for public funding for the arts in this time period is much bleaker when accounting for inflation. In fact, after adjusting for inflation, public funding for the arts has decreased by more than 30 percent in this same period.” (13)

 Concerns about government funding are arguably diminished because they account for fewer than 10% of all arts organizations’ funding. However, my observations suggest that, in many small- and medium-sized communities, when a significant local art organization is on the brink of financial collapse, it is a municipal or county government that steps in to save the day. Such interventions can have critical impacts on the arts organization and the whole community it serves. I wonder what would happen if local governments really did stop making such bailouts?

One thing seems certain: any arts organization that predicates its future financial well-being on continually receiving government grants has placed itself in a very risky situation.

 Budget Size Matters.

Most arts organizations are small, with revenues under $25,000. In 2012, about 63% of the nation’s estimated 110,000 arts organizations had revenues below $25,000. (14). A study done in 2017 estimates that there were 39,292 nonprofit arts and cultural organizations in the USA that had revenues over $50,000 (15). This means most art nonprofits will have little or no staff and will very likely either have very few performances or very few hours when they are open to the public. If they rent street level storefronts, when closed, they function as dead spaces that detract from their block faces walkability, while also signaling a lack of vibrancy.

Even when budgets get somewhat higher, the impacts are not likely to be significantly large. For example, the Wyoming Territorial Prison, a museum in Laramie, WY, (population 32,000) reported revues of $90,290 on its IRS Form 990 in 2015, but its annual visitation is about 16,000 (averaging about 2,700 per month) during a season that lasts from May 1st through October 31st. To put that attendance in perspective, consider that the Laramie Main Street Alliance holds seven one-day events that attract a total of around 8,250 people (16).

Small arts venues can have some meaningful benefits for their communities, though their economic impacts in terms of bringing in more dollars to the downtown district are relatively small. Some may be vanity expressions of a local resident, while others may have significant community impacts by celebrating a local scenic feature, historic local event or a famous local resident that is important to the community’s pride and cohesion. They also can fill vacant downtown spaces and add variety to the district’s store mix. However, their economic impacts still are likely to be negligible. Their budgets are too low and their customer magnetism just too weak for them to have significant direct and indirect economic impacts. Moreover, the small number of merchants in these downtowns also means that there are fewer that can be impacted positively by the arts activities.

It hard to say what the budget threshold is that has to be exceeded for arts organizations to have significant economic impacts. However, bigger budgets certainly increase the potential for having stronger and better arts “products” – e.g., performances, exhibitions, items created by artisans, etc. — and they can have more significant economic impacts.

The Quality of the Arts “Product” and Its “Packaging” Really Matter.

A Strong Cautionary Note: Do Not Allow Attention to Arts Buildings Dwarf Proper Attention to the Programs and Events That Will Occur Within Them. Since the early 1980s, I have come across several projects to either build or restore an existing theater or PAC. All of the completed buildings were physically attractive. However, a good number struggled financially after they opened because they were not attracting the audiences their advocates had said would appear. While enormous efforts were made to properly design and fund the building or renovation project, too often insufficient attention was paid to what would happen once the venue opened to the public. Their creators had not properly thought through what their product was, which market segments they would be sold to, how they would be marketed or how much money and personnel would be needed to do all of this. Sometimes those managing the new venues had little or nor prior appropriate professional experience.

Many of these projects were sold as bastions of the Arts, with a capital A, carrying the implication that they would be venues for performances of classy “highbrow” arts such as operas, ballets, and symphonic music. They soon found out, the hard way, that it was popular entertainment acts that paid the bills, not high culture arts performances. Furthermore, expectations about the types of acts that could be attracted were doused when board members and novice managers learned that their facility was too small to generate the revenues needed to pay the entertainers they wanted on their stages. Yes, they could have the occasional concert pianist, chamber music ensemble, dance group, touring Broadway play or even plays performed by local drama groups, but it has been the performances by pop singers, salsa bands, rap groups, rock bands, screened broadcasts of NFL games, classic films and comedians that paid the bills.

The folks at the Paramount Theater in Rutland, VT, have been wonderfully frank about their initial problems after a major renovation that enabled the theater to reopen after decades of darkness. That frankness is probably enabled because, after a few years of struggling and an important management change, the theater finally got on track by finding the right programming and pricing. Learning about the local market was critical. Eric Mallette, the programming director of the Paramount, says: “that he pays a lot of attention to what the local market responds to and tries to book shows and adjust ticket costs to fit those trends.” For many years that meant popular music and family entertainment, including the booking of a lot of comedians. According to Bruce Bouchard, who runs the Paramount Theater: “We started booking comedians and it just took off.”

What a Strong Arts Product Can Do for Arts Venues in Smaller Towns. The importance and power of the products that arts venues offer is perhaps best demonstrated by some venues I have visited that have substantial budgets, strong regional or national reputations and draw a significant number of patrons from relatively large market areas — even though they are located in small and medium sized towns. Below are four examples.

The Norman Rockwell Museum. Stockbridge, MA, is a very small town, with a population around 1,700 people. It has a wonderful old building stock, including a famous old hotel and inn. Located on Route 7, it has long been a significant tourist destination in the Berkshire Mountains. The famed artist/illustrator Norman Rockwell lived there. Local residents were models in many of his paintings. The Norman Rockwell Museum in Stockbridge is the primary repository for the artist’s paintings.

For decades his paintings were the covers of well-known national magazines. Most of his work presented an idealized version of small town, Main Street America and was very patriotic. The museum, from its inception, had name recognition and was able to build upon Rockwell’s national fame and popularity.

It has a substantial annual budget of about $4.3 million, though that is well below the average of about $8 million for art museums nationally that have annual incomes above $50,000. About 28% of its revenue comes from contributions and 52% from program services. The museum attracts around 125,000 visitors a year – about average nationally for an art museum — mostly from NY and New England, as well as another 200,000 to its traveling exhibitions. It is professionally operated with 27 full time employees, 38 part-timers, and 30 volunteers.

This museum has gravitas: lots of a high-quality arts products (i.e., many Rockwell paintings) that are packaged in a charming town in the attractive Berkshires. The area attracts many well to do second home owners and even day-trippers from the heavily populated Northeast Corridor. Its budget and visitor appeal infuse this museum with the potential to have meaningful economic impacts even though it is located in a small community. How much of those benefits go to Stockbridge and its charming Main Street and how much goes elsewhere in its region is another issue.

Brandywine River Museum of Art. It is located in Chadds Ford, PA, population 3,640. The township is about 40 miles from Philadelphia in a scenic river valley, where the DuPont family has had a big influence. The township’s population is affluent, with the median household income being $117,961 and the mean $165,971.

Brandywine River Museum in Chadds Ford, PA

Its core attractions are Andrew Wyeth’s studio and a very large collection of his paintings. Wyeth is also one of America’s best-known artists. His painting, Christina’s World, achieved almost iconic status nationally. The museum attracts 200,000 visitors annually, double that of the average art museum. Wyeth’s fame and popularity are enormous marketing assets for the museum. Its annual revenues are relatively very substantial, around $24.6 million. That’s about three times the average art museum in the USA. It has 164 employees. Its total assets are valued at a relatively hefty $156.7 million. The museum’s operational strategy is unique since most of its annual revenues come from asset sales — probably the sales of Wyeth lithographs and paintings for which there is still a big demand.

One gets the impression that the management of this museum is trying to run it as a business as much as is possible. Its revenues, employment, and visitation indicate that it has considerable potential to exert positive economic impacts, within its county, though where and who within it would benefit are other issues.

Goodspeed Musicals. This organization is famed nationally for developing musicals, with many of its productions going on to stages in New York City and London, e.g., Annie. It owns and operates an impressive cluster of artistic facilities located in East Haddam, CT, population 9,126. The town has a median household income of $82,117 and a mean of $103,376. The town is on the scenic Connecticut River and has many historic buildings. The Goodspeed Musical’s facilities include:

  • The Goodspeed Opera House
  • The Terris Theatre
  • Artists Village
  • The Chauncey Stillman Production Facility
  • Larry A. McMillian Rehearsal Studios
  • The Alice Rehearsal Studios Barrington Costume Center
  • The Factory Building (17).

At the functional core of this cluster is the historic Goodspeed. Built in 1876, after a long period of decline, it was restored and reopened in 1963. Attendance at the Goodspeed for 2014 was about average for an American nonprofit theater company: 105,368 patrons at 297 performances. About 26% of its revenues are from contributions, about 57% program services. Its total revenues in 2014 were an above average $13,159,845, while expenses were relatively robust at $11,708,637.

The Artists Village is an interesting and relatively recent addition. It is within walking distance of the Goodspeed Opera House and includes 17 new and five older homes. All have three or six bedrooms, with shared kitchens and living rooms. The new houses were designed specifically with artists in mind: “every bedroom has a private bathroom, extra insulation was added between walls to ensure quiet rooms, and large common areas were provided to encourage camaraderie and a sense of community” (18). The project cost for the Artists Village was $5.5 million, with $2.5 million provided by a grant from the Connecticut Department of Economic and Community Development, and the rest from private donors.

Weston Playhouse Theater. The Playhouse is located in a very attractive building in Weston, VT, population 566, one of the most charming villages in the state. A running stream and the town green abut the theater. Route 100, one of the state’s most scenic highways, runs through the town. Also located in the town is the very popular Vermont Country Store that literally draws busloads of tourists. Weston’s median household income is $62,500, the mean is $100,796. The area surrounding Weston attracts lots of second homeowners because of its famed scenery and nearby ski resorts, such as Okemo. The Town of Ludlow, population around 1,900, is about a 15-minute drive from Weston and close to Okemo. It has had a notable downtown revitalization in recent years, driven by an attractive cluster of restaurants and bars.

The Weston Playhouse Theater

The Playhouse is Vermont’s longest running professional theater, though it only operates for about 10 weeks during the summer months. While it does the classics, it also prides itself on nurturing new plays. Its total revenues in 2014 were an above average $2.45 million. An astonishing 63.4% came from contributions, only about 29% from ticket sales. Its annual expenditures in 2014 were $1,835,630. Its annual attendance, based on just a summer stock type operating season, is above average at about 20,000. However, its operating expenditure per visitor is quite high, $91.78, and most of it cannot be covered by ticket sales. This has placed it in potential financial jeopardy.

The Playhouse has a bar and restaurant inside, probably because there are so few other eating and drinking places in this very small town or even further out in this very rural area.

I have been following the Playhouse and visiting Weston since the early 1990s. To my ken, during that time, it has had two significant bouts with financial stress. The most recent occurred a few years ago and was probably due to the impacts of the Great Recession on donors combined with the Playhouse’s strong dependency on contributed income.

The people in the Playhouse company appear to live and work most of the year in big cities in the northeast, where they are theater professionals and/or academics. Perhaps they also have second homes in or near Weston. In many respects, what they have done reminds me of the Judy Garland and Mickey Rooney films where someone says: “ let’s put on a show” and they do. The folks that run the Playhouse company want to put on their kind of plays in Weston, a town they obviously like, during the summer, when they are more likely to have available time. They largely have been willing and able to do the hard work of attracting a substantial amount of contributions. I suspect that a lot, if not most, of those contributions, come from outside Weston’s region. If the picture I just painted is correct, then the very small town of Weston has a well-known theater because it has been able to attract a group of outside theater professionals who then have been able to attract a good deal of outside money. To my mind, that’s like Weston filling an inside straight. It’s a wonderful story, but a model that is very hard to emulate.

The Playhouse probably does not have much potential to have favorable impacts on other Weston businesses, because there just are not that many of them and it is only open for about 10 weeks a year. On the other hand, the Vermont General Store is so strong that anything the Playhouse could add to it probably would be like chump change. The most likely potentially positive economic impacts are probably felt at a county or regional level – in Ludlow, for example — and probably more on residential property values than business revenues.

Some Hypotheses About the Characteristics of Arts Venues in Small- and Medium-Sized Towns That Are More Likely to Be Successful and Have a Strongly Appealing Arts Product. Based on my research and field visits, I have generated the following hypotheses:

  • Their arts product, while reflecting strong local roots, also appeals to many people outside the local area. They attract tourists.
  • Their arts product is packaged in an attractive building that is located in a very attractive town that often is in a very attractive region.
  • These successful venues usually do not create the tourist traffic but take advantage of, and then help grow existing traffic.
  • Their towns have significant numbers of solidly middle income and/or affluent households, their percentages often greatest in the towns with the smaller populations.
  • The arts venues are professionally managed and their board members are knowledgeable about the art form the organization is engaged in.
  • The venues have significant budgets. (This not to say that they are always safely in the black financially.)
  • The venues have leaders and managers with strong working connections, one way or another, to the arts community outside of their local areas. Such networks of personal connections are valuable for accessing talent, fund-raising, earning income and marketing. Many have come to the area as tourists, second home owners or as visitors to friends and family who are residents. That means that tourism, once it reaches a certain level, can simulate local arts projects by bringing in people who work in the arts. I think such links are far more important than is commonly realized.


ENDNOTES

1) See, for example: N. David Milder. “The New Normal’s Challenges to Developing a Downtown Entertainment Niche Based on Formal Entertainments: Part 1.” March 9, 2014 https://www.ndavidmilder.com/2014/03/the-new-normals-challenges-to-developing-a-downtown-entertainment-niche-based-on-formal-entertainments-part-1 and N. David Milder. “Based on Formal Entertainments: Part 2 the audiences; revised 041214.” March 28, 2014 https://www.ndavidmilder.com/2014/03/the-new-normals-challenges-to-developing-a-downtown-entertainment-niche-based-on-formal-entertainments-part-2-the-audiences N. David Milder. “Downtown Formal Entertainment Venues: Part 3.” April 24, 2014. Revised April 26, 2014. https://www.ndavidmilder.com/2014/04/downtown-formal-entertainment-venues-part-3   N. David Milder. “Downtown Formal Entertainment Venues Part 4: Movie Theaters.” May 25, 2014 https://www.ndavidmilder.com/2014/05/downtown-formal-entertainment-venues-part-4-movie-theaters

2) Roland J. Kushner and Randy Cohen. National Arts Index 2016, p.2; Americans for the Arts.   http://www.americansforthearts.org/sites/default/files/2016%20NAI%20%20Final%20Report%20%202-23-16.pdf

They did not look at arts organizations with annual revenues under $50,000 so their finding that larger arts organizations are more prone to having deficits should be treated with caution. The 2016 version of the NAI will be its last and that is a real shame. It has been a treasure of data that arts organizations should use not only for advocacy, but also for planning their budgets and programs.

3) See: http://www.americansforthearts.org/sites/default/files/ArtsFacts_ArtsOrganizationRevenues2014.pdf

4) NEA. “How the United States Funds the Arts.” 2012. P 1. https://www.arts.gov/sites/default/files/how-the-us-funds-the-arts.pdf

5) Lisa M. Sontag-Padilla, Lynette Staplefoote and Kristy Gonzalez Morganti. RESEARCH REPORT. Financial Sustainability for Nonprofit Organizations: A Review of the Literature. Rand Corporation, 2012. http://www.rand.org/content/dam/rand/pubs/research_reports/RR100/RR121/RAND_RR121.pdf

6) Data on the revenues and expenditures of the specific arts organizations described in this article come from the Form 990 filed with the IRS and available from online sources.

7) Randy Cohen. “What’s Measured Matters . . . Private Giving to Arts &

Culture: Way Up in 2014.” ARTSBLOG, July 10, 2015. http://blog.americansforthearts.org/2015/07/10/what%E2%80%99s-measured-matters-private-giving-to-arts-culture-way-up-in-2014

8) Ibid.

9) Giving USA. “Data Tables for Charts in The Numbers

Giving by source, 1976–2016.”

10) See endnote 2, p.24

11) The Conference Board. “TCB Giving Numbers 2016.” https://www.conference-board.org/publications/publicationdetail.cfm?publicationid=7297&centerId=1

12) See Endnote 2

13) Ryan Stubbs, “Public Funding for the Arts: 2014 Update.” GIA Reader

Vol. 25 No. 3, Fall 2014 http://www.giarts.org/article/public-funding-arts-2014-update

14) Andy Horwitz, “Who Should Pay for the Arts in America?” The Atlantic, Jan 31, 2016. https://www.theatlantic.com/entertainment/archive/2016/01/the-state-of-public-funding-for-the-arts-in-america/424056/

15) Zannie Voss and Glenn B. Voss, “Arts and Culture Are Closer Than You Realize: U.S. Nonprofit Arts and Cultural Organizations Are a Big Part of Community Life, Economy, and Employment —and Federal Funding Enhances the Impact.” National Center for Arts Research, SMU. Pp.7. https://sites.smu.edu/Meadows/NCARPaperonNationalArtsandCultural%20Field_FINAL.PDF

16) Information kindly provided by Trey Sherwood, Executive Director of the Main Street Alliance in 2016.

17) Information about these facilities was obtained from the Goodspeed Musicals website: http://www.goodspeed.org/?gclid=CJ7Tqp6sxdQCFYaPswodusULkQ

18) See the Artist Village pages on Goodspeed’s website.


UP NEXT IN PART 2 OF THIS ARTICLE

Part 2 of this article will focus on the changing characteristics of our population’s participation in the arts and the impacts of the arts on downtowns. Failure to understand the altered arts participation landscape is leading to bad project and program choices by arts organizations. Failure to understand the impacts the arts really have on our downtowns has led to some very disappointing results for downtown leaders and stakeholders who worked hard to bring arts projects to their districts.


* The Forthcoming “Let’s Get Real About…” Series of Articles.

My recent article on pedestrian activity concludes the large number of articles I’ve done on the New Normal for Downtowns that I have been working on since 2008. I will, of course, again return at times to that topic in the future, but I also want to write about many other subjects. At this moment, that means describing and trying to spark debate about a number of subjects I believe are being mishandled by downtown revitalization leaders and experts because either unproven assumptions are being made or the subject is simply not being properly understood. This will be done in a new series of articles that I have dubbed “Let’s Get Real About…”. I have already taken on one of these subjects in my articles about leakage analyses. Above, is the first article in that series. It details the challenges presented by trying to use the arts as a key downtown revitalization tool. Other topics I plan to address in future articles, though not in the order in which I probably will take them on, include:

  • Are lots of people strolling, window-shopping and browsing in stores what makes downtown retailers successful? I already broached this subject with some detail in my pedestrian activity article, but I want to do a deeper dive on this subject because I think this behavior pattern holds such a pivotal position in our conventional wisdom about how downtowns work.
  • Are the uses of best practices/success stories usually beneficial?
  • Are small businesses always revitalization assets — and big businesses bad for the small ones as well the community at large?
  • Are new retail spaces not needed because the market is already glutted?
  • Eyes on the street: is that what really makes people feel safe?
  • Are most downtown retail market analyses on the mark?
  • How the Internet is eroding the legendary importance of location, location, location.

I welcome suggestions about other topics and articles from other authors on them.

Posted in BIDs, Business Recruitment, Central Social Districts, Change Agents, Creative Class, Downtown Niches, Downtown Redevelopment, Economci Development, Entertainment, Entertainment niche, Financial tools, Formal entertainment venues, movie theaters, New Normal, Planning and Strategies, Small Towns, Suburban Downtowns, The Arts |

SOME THOUGHTS ON THE PERPLEXITIES OF DOWNTOWN PEDESTRIAN ACTIVITY

Posted on May 13, 2017 by DANTH

By N. David Milder

Introduction

Over the past 15 to 20 years, pedestrian activity has become an essential element in our understanding of how successful downtowns and Main Street districts work. Such activity has qualitative and quantitative aspects. The well deserved and growing attention that downtown “walkability” has garnered reflects the qualitative concerns of those active in downtown revitalization about the physical and social conditions that encourage pedestrian activity. It is also a de facto acknowledgement of the importance of such activity. However, in my opinion, a lot of important issues are being generated by pedestrian activity that are not being acknowledged, much less being resolved. They could benefit from conceptually and methodologically rigorous quantitative analyses. Moreover, such analyses needs to look at not just pedestrian activity in isolation, but also how it relates to other economic and social behaviors and attitudes. In this article, I’ll take a stab at outlining some of these issues.

How Much Pedestrian Activity Should Your Downtown Have?

It might be reasonably argued that this is one of the most basic questions that should be addressed by any downtown revitalization plan or strategy. Below are some observations and ruminations about pedestrian flows I’ve been accumulating over several years. They stimulated me to look more closely into this question and to realize how complex the task of answering it might be.

The Importance of the Quality of the Pedestrian’s Experience. Many years ago, before the NYPD instituted corrals for the event, I took my nine-year old daughter to Times Square on New Years Eve. It was a ghastly mistake! A strong surge in the crowd sent people flying into us and my daughter went to the ground. I thankfully was able to get her in my arms before she was trampled by the crowd. Lesson learned: a lot of people close together on foot can be very, very dangerous. At what point does pedestrian density become dangerous? Is there some metric about how much space a pedestrian needs to be safe and to feel comfortable and unstressed?

I have long avoided many streets in Midtown Manhattan at certain times of the day, e.g., lunchtimes and during the evening rush, and especially at certain times of the year, e.g., most of December and St Patrick’s Day, because the sidewalks are so crowded, sometimes also with raucous people, that:

  • I have to walk in the street and then take care that I’m not run over by passing vehicles or
  • Staying on sidewalks, I strongly fear bumping into other people or being bumped into far more often than I’d like by unpleasant people. Walking then becomes a very labored, fearful and thoroughly unpleasant experience. Lesson learned: overly crowded pedestrian traffic is inducing me to dislike walking in these areas so I avoid them, much as New Yorkers avoided Bryant Park back when it was known as a crime ridden and dangerous place. I suspect I am far from alone in having this reaction. As Yogi Berra famously said, “no one goes there anymore—it’s too crowded.”

How many downtowns are inducing avoidance behavior and having their images tarnished by too much pedestrian traffic congestion? My suspicion is that it is happening far more often than their leaders and stakeholders either realize or would want. In turn, this raises the question of at what point does the density of pedestrians begin to significantly make walking an irritating, joyless labor and an inducement for avoidance behavior? How much pedestrian traffic is too much pedestrian traffic?

A headline in a 2016 article in the New York Times blared: “New York’s Sidewalks Are So Packed, Pedestrians Are Taking to the Streets.” (1) Such behavior is a good indicator of a malfunctioning pedestrian environment, but it is not a good measure of the extent of the underlying problem. Many, many other pedestrians are staying on the sidewalks, but are far from happy about the situation they are in.

While this happening in Manhattan on 5th Avenue in and near Rockefeller Center, in the Times Square Bowtie, along Broadway and elsewhere in Lower Manhattan, around Macy’s and near Penn Station is perhaps to be expected, I have been in similar pedestrian traffic jams, though less frequently, on the sidewalks of: Austin Street in Forest Hills, NY; Main Street in Flushing, NY, Jamaica Avenue in Queens; Fordham Road in The Bronx, Main Street in East Hampton, NY, Michigan Avenue in Chicago, Newberry Street in Boston and Ocean Drive in Miami Beach.

Impediments to a Good Pedestrian Experience. In many of these pedestrian traffic jams, walking is being constricted by such things as narrow sidewalks, stores bringing their merchandise stands out on the sidewalk, outdoor restaurant seating, newsstands, street and truck vendors and their customer crowds, street performers, street tree pits, planters, benches, construction sites, bus shelters and normal window shoppers. In too many instances, the possible pedestrian path on the sidewalk is only wide enough for one person. Lessons learned:

  • When these issues are not properly addressed they can make walking so difficult and unpleasant that they negatively impact a district’s image and increase avoidance of important portions of it.
  • Even very desirable amenities, e.g., street trees, planters, benches and bus shelters can cause problems simply because of the amount of sidewalk space they occupy. (See the Austin Street photos below). Also, shoppers with shopping bags, shopping carts and children in strollers/carriages will need more space than the average pedestrian. Americans are also getting more obese and consequently occupy a larger volume of space. Smaller communities certainly are not exempt from having such problems.

Downtowns that want to attract more pedestrians need to take these factors into consideration. Just setting the attraction of more pedestrians as a goal is acting with blinders on. As the astute Andy Manshel recently emailed me: “Our work is always all about balance.”


Austin Street in Forest Hills, NY (and in NYC) is a very strong and popular shopping corridor. It suffers from narrow sidewalks, sometimes even when pedestrian flows are relatively sparse. That problem rises to the point of being very detrimental during late afternoon and weekend pedestrian peaks.


Rules for the Sidewalk? Certain pedestrian behaviors, those that might be called pedestrian incivilities, too often also impede the smooth flow of pedestrians and make walking thoroughly unpleasant. Some of these incivilities are: raucous, drunken behaviors; walking against the flow of traffic; walking in groups of three or more lined up across the sidewalk; aggressive passing; stopping and standing in the middle of the sidewalk, especially in groups. Lessons learned:

  • There may be rules of the road for drivers, but apparently, there are no behavioral rules of the sidewalk for pedestrians.
  • There is a need for an accepted etiquette of pedestrian behavior, but its codification and acceptance will probably be very, very hard to accomplish. How could it be accomplished and by whom?
  • Pedestrian flows, I’ve been told by experts, are self-regulating. Who or what steps in when that self-regulation fails to work properly? Incivilities are good examples of such failures.
  • Individuals can find that self-regulation can become a very negative experience, full of uncertainties and possibly fears. It also can require a lot of hard work.
  • My observations suggest that tourists are more prone than New York residents to engage in pedestrian incivilities, though local teenagers are also frequent miscreants. If this is the case, how do the tourists impact on our ability to remediate this problem?
  • Districts with high levels of pedestrian incivilities should not try to develop levels of pedestrian traffic that increase the frequency and adverse consequences of such incivilities.

Pedestrian Traffic in Small Towns. Small and medium-sized downtowns will never have the consistently strong pedestrian flows found in our big, traditionally urban cities such as NYC, Chicago and Boston. (See the table below.) They just do not have the needed large daytime populations and the development densities that generate them. So, how much pedestrian traffic should they have? And how can that be determined? By their land use densities? By the needs of local merchants and those targeted for recruitment? By sidewalk capacities? By the number required for the district’s sidewalks to look active and interesting? Or are they so small that such a concern is simply irrelevant for them?

Who You Add Really Counts! Among the relatively smaller downtowns, I have come across some instances where local leaders have complained that their events have drawn either more people than they could handle properly or the kinds of folks they did not want (e.g., bikers, hot rodders, aggressive panhandlers, drug dealers). In several other small and medium-sized downtowns both merchants and residents have complained that a recent big influx of tourist traffic has changed the basic character of their district for the worse. Lesson learned: the composition of the increased pedestrian traffic can really matter; another reason more pedestrian traffic may not always be beneficial.

Pedestrian Traffic as a Locational Asset. Conventional wisdom has long held that strong pedestrian traffic should be one of a downtown’s most valuable locational assets. However, I have not been able to find any research supported metric that shows with any accuracy how many pedestrians passing by a location are needed to support any kind of retail, food or entertainment operation. Questions:

  • How is a retailer to know if the pedestrian count near a potential new location is a really sufficient for its store to prosper there? Apparently, from their sales records, many retail chains do know, though in fairly broad terms, that their stores do better in locations with relatively high pedestrian counts. Yet, there is no evidence that they know of a threshold of pedestrian activity that has to be exceeded, much less how many passing pedestrians are needed to support a square foot of leased space or $1,000 of store sales.
  • How, then, is a downtown EDO to determine what level of pedestrian activity its prime retail-prone spaces need to attract and sustain desired retail tenants?

My recent look at the 34th Street District had an admittedly small sample to study, but it did indicate that some of the district’s most desirable retailers probably valued being closer to other retailers of similar caliber more than proximity to larger pedestrian flows (2). Question: how important is pedestrian traffic in retail locational decisions compared to other factors? Which other retailers are nearby, the characteristics of available spaces, including their size, rent and lease terms, may be more important.

One of the unexplored and untested gospels about healthy downtowns is the pedestrian strolling, window-shopping and browsing scenario for retail success. According to this lore, downtowns are healthy and retailers successful when downtown visitors can leisurely stroll along its sidewalks, window-shop and then browse inside the shops. It is one of the reasons why downtown retail locations are supposedly advantageous. However, today, this scenario often breaks down:

  • In many smaller downtowns and Main Streets, there just are not enough shops to warrant much strolling and the shops are not apt to change their merchandise frequently enough to warrant much window shopping or browsing. My field experiences in such towns suggest that store visits are overwhelmingly need driven to merchants that are locally well known and these merchants are identified destinations before the shopping trips are initiated. Question: In these downtowns/Main Streets, can more resident-driven pedestrian traffic really make all that much difference for retailers?
  • In really big downtowns with very high pedestrian traffic, it is sometimes hard to window shop because of frictions with passing pedestrians. At what level does high pedestrian traffic begin to significantly discourage window-shopping?
  • Today, before Americans go on a shopping trip, they overwhelmingly search on the Internet for the merchandise they want and the shops where it is sold. Consequently, the related residential shopping trips are now much more destination generated, less the result of strolling, browsing and exploring. With tourists, strolling and window-shopping behaviors are probably still significant. However, it may be asked if a lot of pedestrian traffic is still really an important factor for the retailers that are mainly attracting Internet-driven destination shoppers? The Internet is eroding what location, location, location has meant in our downtowns.

Is Simply More Really Better? In decades past, when downtowns were in decline or just starting to revive, getting higher levels of pedestrian traffic was a highly desired objective, even when there was little hope of achieving it. In more recent years, almost every downtown and Main Street revitalization strategy or plan I’ve seen has echoed this “more pedestrian activity is better” theme. Some of them, I wrote. One of my strongest arguments above has been that more is better only if a good pedestrian experience can be maintained or created. Many more of these revitalization plans and strategies should have addressed this issue of the quality of the pedestrian experience they provide – including some of mine. The objective downtown EDO’s should really adopt is attracting more visitors who will be happy because they so enjoyed walking on your downtown’s sidewalks and in its public spaces. I am even tempted to say that should be The First Commandment of Downtown Revitalization.

A Quick Look at the Times Square Bowtie

A brief look at Times Square is worthwhile because it demonstrates so forcefully a number of the points I have argued above.

One of the most salient features of the new normal for our downtowns is that while being successful, they must face a range of relatively new problems. Nowhere is this more forcefully demonstrated than in Times Square, where very high pedestrian flows have been a growth and business recruitment asset as well as the cause of overcrowded sidewalks, frequently unhappy pedestrian experiences and possibly a disincentive for business attraction and retention.

The behavior of the Times Square Alliance (TSA) also demonstrates how important the collection of data on pedestrian traffic has become for some downtown district management organizations. In 2012, the TSA completed the installation of an automated counting system that “provides 24/7/365 data on the number of pedestrians who enter and pass through specific counting zones of the Times Square Bowtie (7th and Broadway between 42nd and 47th).” (3)

It’s Economic Rebirth. This world famous urban area, especially in the “Bowtie,” has experienced an enormous and impressive rebirth. In the latter part of the 20th Century, despite its large cluster of legitimate “Broadway” theaters, the many show-goers they brought in, and the hordes of tourists attracted by its signage and honky-tonk atmosphere, Times Square increasingly was known as a decaying place filled with of all sorts of porn establishments, lots of homeless and prostitutes and a high level of criminal activity. Today, that blight and most of the deviant behavior has disappeared – to the point that a few mavens long for some of its former edgy, honky tonk atmosphere to return. The area has attracted new office buildings with major corporate tenants and hotels. Major retail chains have opened, including: Loft, Forever 21, Gap, H&M, Uniqlo, Levi’s, American Eagle, Charles Tyrwhitt. The theaters have had record box office numbers in recent years. Overall, today, Times Square is a stronger than ever attraction for tourists.

Its retail rents are an important indicator of its resurgence and desirability as a retail location. In 2016, average asking rents in the Bowtie were $2,170 PSF, the second highest among all of Manhattan’s major retail corridors. Moreover, these rents grew by 150% between 2008 and 2016, the largest increase among those retail corridors. (4)

An Astonishing Level of Pedestrian Activity. The TSA’s counts for March 2017 showed that:

  • Over 300,000 pedestrians enter the Times Square Bowtie each day. That is equivalent to being the 64th largest city in the USA by population.
  • On the busiest days, Times Square pedestrian counts are as high as 480,000. That is equivalent to being the 35th largest city in the USA.
  • Times Square stays active in the evening: 66,000+ pedestrians enter the “Bowtie” between 7 pm and 1 am. (5)

Only a handful of commercial districts worldwide can rival these numbers.

The map below shows the March 2017 pedestrian counts broken down by the nine sidewalk and five plaza locations where they were observed. Within the core Bowtie area are six of the sidewalk locations and all five plazas. The plazas are more like public spaces, with places for people to sit and stay. They averaged 93,866 visitors per day, with a high of 158,739 and a low of 72,266. The average sidewalk counts in the Bowtie, that look at the more constantly moving pedestrians in smaller spaces, was about 30% lower than that of the plazas, 66,020, but still impressively strong. The sidewalk counts ranged from a high of 78,810 to a low of 48,608.

Times Square 1: Map from the Times Square Alliance shows pedestrian counts in March 2017 at different locations.

These High Levels of Pedestrian Traffic Are Not Problem Free. By the early 2000s, because of the negative experiences generated by Times Square’s very heavy pedestrian traffic, I and many, many other New Yorkers, avoided walking in the area as much as possible, only doing so when going to important business appointments or shows at one of its many theaters. The sidewalks were so packed that walking in the area was thoroughly unpleasant and too often irritating. A good tell of this was the fact that more and more people were leaving the sidewalks and taking to the streets. A TSA pedestrian count in 2006, for example, found that as many as 9,148 pedestrians a day were walking in the street on Broadway between 46th and 47th Streets despite high levels of vehicle traffic (6). It seems reasonable to assume that many of them felt it was safer, easier and/or faster to walk among the vehicles than in the dense flow of pedestrians!

A Very Gutsy Project to Rebalance the Situation. Broadway is an old and long street that predates Manhattan’s street grid and runs 13 miles through Manhattan, two miles through The Bronx and 18 miles through towns in Westchester. Because it cut diagonally across so many important north-south avenues it caused a lot of vehicular congestion. Its sidewalks in the Times Square Bowtie were also badly overcrowded. Around 2008, the Bloomberg Administration decided to take a very bold move on Broadway below Columbus Circle that basically banned it for vehicles or made it very unfriendly for drivers. At least half of its traffic lanes were closed and repurposed for bike riders and pedestrians. Between 33rd and 35th Streets near Herald Square and in the Times Square Bowtie between 42nd and 47th Streets, Broadway was completely closed to vehicle use. The resulting freed space in the Bowtie was used for more sidewalk space for pedestrians and for plazas with street furniture that visitors could use. (See photos above Times Square 2-4)These renovations took about six years to complete, finally concluding just before New Years Eve in 2016. They reportedly added about 100,000 SF of pedestrian space that reduced pedestrian congestion and added 50% more space for events and concessions (8). Reportedly, 65% of NYC residents felt the plazas made the experience of being in Times Square better. Pedestrian traffic in the street bed also was said to have been reduced, even while overall pedestrian traffic reportedly increased.

New “Old” Problems Emerged. Unintended consequences are perhaps the devil of downtown revitalization — they certainly bedeviled Times Square’s new plazas. Before the area’s revival, it was known for its porn-oriented businesses. They left, but around 2002 the Nude Cowboy (who was not completely nude) appeared, who sang and posed for photos for tips. Over the years, especially after the creation of the plazas, other buskers came in along with cartoon, comic book and action hero costumed people who posed for photos with visitors for tips. They were joined by the “desnudas,” women who were nude, but had costumes painted on them. (See photos Times Square 5-7). By 2015, as the numbers of these tip seekers increased and as complaints rose about their nudity and aggressive, perhaps illegal, treatment of visitors rose to a crescendo, a significant political movement emerged to tear up the plazas. The NYPD seemed to be in the lead. Noted urbanists, such as Jan Gehl, rushed to the plazas defense, arguing that better stewardship could keep them both vibrant and orderly.

One outcome was the creation within the plazas of Designated Activity Zones to which the tip seekers were confined. You can see the white boundary line of one of these zones in photos Times Square 6 and 7. I have not seen any study of the zone’s impacts. My own field observations on three visits over the last year are that the behavior of the tip seekers has become less aggressive or problematic. My hunch is that a lot of them know that if their behavior again becomes an issue, then they will soon be gone.

Impact On Business Recruitment and Retention. In a lot of ways, the somewhat edgy behavior of the tip seekers is consistent with Times Square’s edgy honky-tonk behavior of decades past. Furthermore, one might reasonably argue that, today, edginess along with its humongous colorful signs and dense crowds remain as fundamental pillars to the area’s image and attractiveness to tourists. But, how consistent are they with the needs of local business recruitment and retention efforts?

Around the time, in 2015, when the plazas were being called into question, an article appeared in the New York Times that was titled “Times Square’s Crushing Success Raises Questions About Its Future.” (9) The article asks: “With all this going for it, why are so many landlords, office tenants and theater owners worried about the future of Times Square?” Its answer is very noteworthy because it was made well after steps had been taken to significantly reduce pedestrian congestion in the area: “The same reason that retailers and advertisers lust after a Times Square location is the same reason that others now find it unbearable: the crowds.” (The emphasis added is mine).

Office workers were said to complain about navigating “thick and sometimes unyielding knots of tourists in various hot spots.” Some business people said the area was too congested for New Yorkers to do business. Office workers found it hard to get lunch in restaurants so crowded with tourists. Major corporate tenants were trying to solve crowded streets problem by opening cafeterias and gyms within their office buildings. Others had their executives conduct business east of the district.

A lawyer in a large white shoe law firm that left Times Square noted: “Everyone agreed, it’s awful there. People would go well out of their way to avoid Times Square.” (10)

Also noteworthy is the fact that local businesses that basically deal with the tourists, i.e., those in the hospitality and retail sectors, are not negatively impacted by the crowding.

The Impacts of the Plazas. The plazas have increased pedestrian traffic, but whether or not they have substantially improved the pedestrian experience remains unknown. My personal experiences suggest the improvements, if any, are marginal. My suspicion is that tourists are much more likely to put up with the area’s poor pedestrian experience because it is, in a sense, what they came to have and they know they do not have to endure it on any repeated basis – they can go back home. We New Yorkers, on the other hand, are usually in a rush and we will avoid the area’s congested pedestrian flows whenever and however we can.

The leaders of the TSA are pros and apparently fully aware of the situation. As one of them stated to the Times: “Our concern is that the public realm is so unpleasant that we may at some point hit a tipping point, where companies won’t take space in Times Square. We’re not there yet, but the data is telling us we could get there.” (11)


ACKNOWLEDGEMENT

This book has had a great impact on my interest and understanding of urban pedestrian behavior: Urban Space for Pedestrians by Boris Pushkarev and Jeffrey Zupan (MIT Press 1975). My understanding is that Jeff and his RPA crew are doing an update to it. I am eager to see the results and recommend that anyone interested in downtown revitalization should be as well.

ENDNOTES

1- Winnie Hu, “New York’s Sidewalks Are So Packed, Pedestrians Are Taking to the Streets.” The New York Times. June 30, 2016.   http://nyti.ms/29dy7m3

2- See: https://www.ndavidmilder.com/2017/04/34th-street-a-fabled-shopping-district-and-window-on-the-future-of-downtown-retailing

3- From the Times Square Alliance (TSA) website: http://www.timessquarenyc.org/do-business-here/market-facts/pedestrian-counts/index.aspx#.WQda-lPyvjA

4- Real Estate Board of New York (REBNY) Retail Report 2016

5- From the Times Square Alliance (TSA) website: http://www.timessquarenyc.org/do-business-here/market-facts/pedestrian-counts/index.aspx#.WQda-lPyvjA

6- See: The TSA’s 2006 Summer Pedestrian Counts, Wednesday, July 16 available on its website.

7- See: http://www.timessquarenyc.org/live-work/times-square-transformation/faq/index.aspx#.WRMVWFPyvjB

8- See: https://en.wikipedia.org/wiki/Times_Square

9- Charles V Bagli, “ Times Square’s Crushing Success Raises Questions About Its Future.” New York Times, Jan. 26, 2015. http://nyti.ms/1DcL5o6

10- Ibid.

11- Ibid.

Posted in BIDs, Business Recruitment, Central Social Districts, Crime, Downtown Niches, Downtown Redevelopment, downtown retailing, Economci Development, EDOs, Entertainment, Entertainment niche, Informal entertainment venues, New Normal, Office Development, Pedestrian traffic, Planning and Strategies, Public Spaces, retail chains |

Post navigation

← Older posts
Newer posts →

Recent Posts

  • Now is the Time for Many Downtowns to Grow Older Adult Member Communities
  • How downtown multifunctionality is packaged is a key to its success
  • “How Our Downtowns’ Three Most Important User Groups Can Help Their Sustained Recoveries”
  • The Cockamamie Conclusions andAssumptions of the Downtown Doom Loop Analysis
  • More Visitors, Not the 100% Return of Office Workers, Are the Key to the Full Recovery of Our Downtowns

Labels

  • 15 minute neighborhoods (2)
  • automated cars (4)
  • backdoor retailing (5)
  • BIDs (27)
  • Business Recruitment (29)
  • Captive Markets (10)
  • Central Social Districts (38)
  • Central Social Functions (6)
  • Change Agents (24)
  • clean sidewalks (2)
  • clean streets (2)
  • commercial nodes (11)
  • Contingent workers (4)
  • convenience (6)
  • Creative Class (31)
  • Crime (8)
  • CSDs (7)
  • DANTH (13)
  • Deliberate Consumer (13)
  • Downtown Garages (4)
  • Downtown Merchants (30)
  • Downtown Niches (64)
  • Downtown Redevelopment (70)
  • downtown retailing (66)
  • Downtown Visitors (5)
  • driverless cars (4)
  • E commerce (27)
  • Economci Development (54)
  • Economic Development (8)
  • EDOs (27)
  • Entertainment (44)
  • Entertainment niche (35)
  • Entrepreneurship (14)
  • fear of crime (9)
  • Financial tools (5)
  • Formal entertainment venues (28)
  • Formats Facades Signs (6)
  • Functional Diversity (2)
  • Housing (11)
  • Informal entertainment venues (26)
  • Innovations (33)
  • Jamaica Center (3)
  • Jobs (7)
  • Leakages/gaps (7)
  • Live-Work (6)
  • Living donor (1)
  • Luxury retail (7)
  • Market research (7)
  • movie theaters (23)
  • Moving People (3)
  • multichannel retailing (20)
  • Multifunctionality (2)
  • New Normal (50)
  • Office Development (11)
  • Older Adults (1)
  • Pamper Niche (9)
  • Parking (5)
  • Parks (3)
  • Parksmand public spaces (6)
  • Pedestrian traffic (19)
  • Planning and Strategies (52)
  • Public Spaces (25)
  • Remote work (4)
  • Remote working (2)
  • retail chains (30)
  • self-driving cars (4)
  • Seniors (1)
  • Small Merchants (36)
  • Small Town Entrepreneurial Environments (8)
  • Small Towns (36)
  • Social Media (3)
  • Sprawl (3)
  • Suburban Downtowns (21)
  • Superstar downtown (2)
  • technology (11)
  • teenagers (4)
  • The Arts (28)
  • time pressure (5)
  • Tourism (10)
  • Trends (50)
  • Uncategorized (34)
  • Up for Grabs shoppers (2)

Links

  • CCED
  • Planetizen

BACK TO TOP

83-85 116th Street, Ste 3D
Kew Gardens, NY  11418
Phone: (718) 805-9507
[email protected]

Copyright © ndavidmilder.com