By N. David Milder
Introduction
This article is a follow up to: “The Changes in the Retail Industry That Are Impacting Our Downtowns” which can be found at: https://www.ndavidmilder.com/2016/09/the-changes-in-the-retail-industry-that-are-impacting-our-downtowns and “How Smaller Rural Downtowns Are Faring Under the New Normal’s New Retailing“ which can be found at: https://www.ndavidmilder.com/2016/10/how-smaller-rural-downtowns-are-faring-under-the-new-normals-new-retailing
Following the path of the last article, it also will explore how the changes in the nation’s retailing are manifesting themselves in different types of downtowns. The changes this article will look at are:
- The emergence of the deliberate consumer
- Reduced demand for retail spaces
- The growing strength of e-commerce
- The continued growth of a broadly defined “value” category of retailers
- The decline of traditional department stores and traditional specialty retailers
- The uneven opportunities for small merchants
This time the focus will be on downtowns in Smaller Rural Regional Commercial Centers. Again, I will focus attention on a few that I know well, because I have visited them and previously done research about them. These downtowns or the communities they are embedded in have seen the substantial decline of traditional department stores and/or traditional specialty retailers and/or the retail malls that depend on such tenants.
I suggest that many of the conclusions and observations I make below should be treated as hypotheses, since I cannot claim that they are based on a rigorous, wide reaching, systematic research effort. However, I hope that the discussion below convinces readers that I have done enough number crunching, field visits, personal interviews and analytical thinking to warrant my observations and conclusions being deemed worthy of serious attention and consideration.
Many of the old rules of the retail game are still in effect. Bad urban design and the lack of appropriate spaces can still thwart downtown retail health and growth. Also, the dynamics of constructive economic destruction can still mean that when some retailers falter in a market, others have the opportunity to enter and compete for that lost market share. If retailers are not open when people want to shop, then sales will be lost.
Downtowns in Smaller Rural Regional Commercial Centers
These small cities are among the most interesting for seeing how the effects of the new retailing are playing out. Rural cities, they usually have populations in the 12,000 to 30,000 range, but have addressable trade area populations of roughly 70,000 to 120,000. Their trade areas can extend to between 30 and 120 minute drive sheds. Their combined financial, government, health care, cultural, entertainment and retail assets give them sufficient magnetism to penetrate such large geographic areas. Sometimes they also benefit from strong tourist traffic. To penetrate these geographically large trade areas, they attract the kinds of retail entities that cannot be easily incorporated into a downtown – malls, big box stores and power centers. The size, magnetism and proximity of such strong retail entities in the community usually places their downtown’s GAFO merchants under substantial competitive pressure. However, substantial opportunities for successful downtown retail niche development can remain. To realize those opportunities, the downtowns in these small rural regional commercial centers will need to strongly develop their central social district functions, especially by developing a significant amount of nearby housing and creating strong entertainment niches, especially ones containing vibrant, well-activated public spaces.
I have researched two of these rural regional commercial centers, Rutland, VT, and Scottsbluff, NE. Their retail development has followed fairly similar courses over recent decades. More attention will be paid to Rutland, because I know it better, having done two major projects in the 1990s for the Downtown Rutland Partnership. I have followed events since then and recently visited Rutland.

Over the years, I have concluded that these small rural regional centers do not get the attention and respect they deserve as economic entities. As can be seen in the above table, although the populations and household incomes of Rutland and Scottsbluff are dwarfed by those of three eastern suburbs known for their large numbers of trophy retail chains, the annual retail sales of the small rural cities compares quite favorably with those of the more prestigious eastern suburbs. They certainly are not retail weaklings.
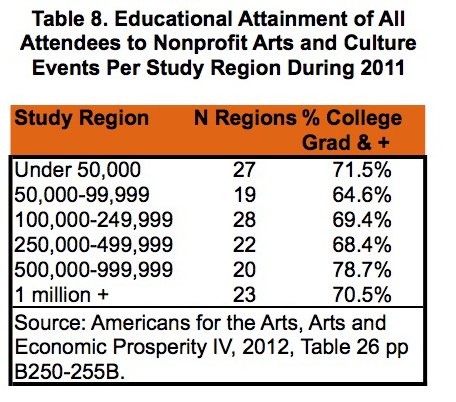
These two rural cities have similar income and education levels (see the table below). Their populations are similar, too, though Scottsbluff has an adjacent twin city, Gering, and they have a combined population that is 46% larger than Rutland’s. Their trade area populations and household incomes are also basically similar. However, they differ quite a bit on tourism. Except for “mud season” in early spring, Rutland has a variety of tourist streams year round, e.g., three major ski resorts are within a 30-minute drive, and loads of “leaf peepers” pass through in the Fall. About 2 million tourists come through the city annually. Scottsbluff has a far more modest tourist flow.
Both have relatively old and small (under 400,000 SF) enclosed retail malls that today have significant vacancies and lost most of their anchor department stores. Both malls also have had ownership problems and changes. In smaller cities during the 1970s to early 1990s, Sears, JCPenney and Kmart often were the retail mall anchors, as they were for the Monument Mall in Scottsbluff and Diamond Run Mall in Rutland. Sears, at one time, was the largest retailer in the USA. Monument lost Walmart back in 2000 and more recently lost Sears and Kmart; Diamond Run has lost Sears and JCPenney. These older department store chains were in decline before the Great Recession and were further weakened by it. Many retail experts are expecting Sears – it also owns Kmart – to disappear any day now.

While Monument Mall has the stronger remaining anchor, a Hersberger’s department store (a subsidiary of Bon Ton, itself a financially troubled department store chain), Diamond Run has the better known specialty retail chains, e.g., Old Navy, Victoria’s Secret and Eastern Mountain Sports.
Overall, Rutland has more retail chains that are also to be found in larger cities and metropolitan areas, while Scottsbluff has more chains that feel comfortable in smaller cities, e.g., Maurice’s, Murdoch’s, Rue21, Buckle, Hibbett Sports, Dunham’s Sports etc.
Both cities have loads of value-oriented big box retailers. They both have a Walmart — though Rutland’s is not a super store –- and a Home Depot. Scottsbluff also has a Target and a Menard’s, while Rutland has a Dick’s Sporting Goods, Michael’s and Bed, Bath & Beyond. Rutland has two 60,000 SF+ supermarkets – Price Chopper and Hannaford – as well as an Aldi. Rutland also has an off-price TJ Maxx that has been going strong for over 20 years.
In Rutland, the years between 1998 and 2007 saw the opening of many of its strongest retailers, e.g., Home Depot, Dick’s Sporting Goods, Michael’s, etc. They greatly strengthened the retail power of the Routes 4/7 corridor that is well outside the downtown’s retail core. When the recession hit in 2008, many downtown independent merchants were hurt and closed. As the recession ebbed, the downtown’s Rutland Plaza Shopping Center saw its movie theater change operating companies, and it attracted Dollar General, Sleepy’s and Payless as replacements for struggling tenants. (This is what good ownership does.) The attraction of national chains to other parts of the city basically stopped until 2013 when the Aldi opened. Since then a few chains have come in, such as Ashley Furniture. A BJ’s entered in negotiations for a site in 2016, but the deal fell through – because of permitting issues, not because BJ’s doubted the strength of the Rutland retail market. The interest of national retail chains has definitely ebbed. Those interested tend to offer low prices and/or value pricing.
Scottsbluff, its county and its state were among those least impacted nationally by the Great Recession. Nonetheless, Monument Mall continued to weaken and the recruitment of major retail chains ebbed. One sign of its current plight: it recently recruited a business from Scottsbluff’s downtown.
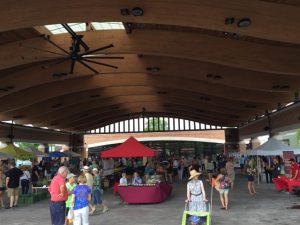
Scottsbluff’s downtown is basically about a half-mile portion of the Broadway corridor. With state money, the city has made a number of physical improvements to the area. Its strengths are its historical features, including the Midwest Theater, nearby office buildings, and a number of independent retail operators who have been around for some time and are effective destination stores. Eateries are another of its strengths as is its seasonal Farmers Market. It does not have any major retail chains. Its sidewalks usually appear to have little to no pedestrian traffic. It has not recently attracted any significant amount of residential development. It also lacks a well-activated and frequently used public space.
“The Pit” parking lot in downtown Rutland, sometimes used as an event venue. It is said to have very good acoustics.
Downtown Rutland is larger and not linear. It, too, has a major restored theater, the Paramount Theater, that is financially successful and draws 50,000+ patrons annually. Many other elements of a downtown entertainment niche are also present: numerous eateries and bars with live music; a children’s museum; art galleries and a movie theater. The Farmer Market is the biggest in VT and runs year round. It attracts many hundreds of shoppers on Saturdays. Additionally, downtown Rutland has a major transportation center and an Amtrak station. It also has seven banks and four financial services companies, City Hall and state offices and courts. A community college is also located in this downtown and Castleton University has established a major presence in the district. As in downtown Scottsbluff, its sidewalks usually appear to have little to no pedestrian traffic and it, too, has not attracted any significant amount of residential development, though Castleton University has turned two floors of a major building into student housing. It also lacks a well-activated and frequently used public space where people can simply sit and enjoy being outdoors as well as gather for events. For example, the Downtown Rutland Partnership currently uses, according to its website, the Rutland Theater, Depot Park, “The Pit” parking lot and the top level of a downtown garage to hold its events.
Rutland differs from Scottsbluff in a very important way – back in the mid 1990s, the downtown’s Rutland Plaza shopping center was intentionally revitalized by bringing in Walmart, Price Chopper, TJ Maxx and a multi-screen cinema. The Downtown Rutland Partnership, under the leadership of Dick Courcelle, strongly backed this approach. Its strategic reasoning was that it was better for these two superstores (Price Chopper and Walmart) to be located downtown, where local merchants could have a chance of attracting their shoppers, than to have the superstores situated farther away where local merchants would have no such opportunity. It was also thought that the Plaza, thus strengthened, would help other downtown merchants compete with the then new Diamond Run Mall.
In 1997 – 1998, DANTH, Inc. conducted an intensive study of how the Plaza’s superstores impacted the downtown merchants located outside of that shopping center. I published an article about our findings in Urban Land (see https://www.ndavidmilder.com/wp-content/uploads/2012/05/superstore.pdf ) . Our research accessed a downtown shoppers intercept survey that had over 1,300 respondents, a trade area telephone survey that had 465 completed interviews, and a survey of downtown merchants supplemented by numerous in-depth, face-to-face interviews with local merchants.
Our major findings were:
- Most downtown merchants located outside of the Plaza felt that their sales had increased since the Plaza had been revamped and that many more shoppers were to be seen walking along downtown streets. Also, about 90% felt they offered unique products and services that did not compete with those offered by the Plaza’s new stores. However, among those feeling most threatened by the new Plaza shops were the operators of the apparel shops. Worrisome was the finding that over half of the downtown merchants felt that they were not getting as many of the Plaza’s new shoppers into their stores as they wanted
- The intercept survey showed that there was considerable cross- shopping among the Plaza’s stores – e.g., over 62% of Walmart and Price Chopper shoppers shopped in other Plaza stores on the same shopping trips.
- However, only about 21% of the Plaza’s shoppers also shopped in downtown stores located outside of the Plaza.
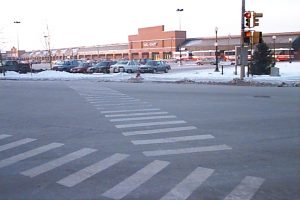
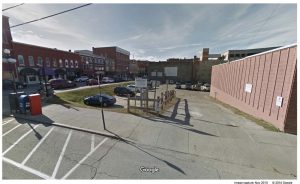
The Walmart is at least 430 feet away from other shops in Rutland’s downtown retail core
- Our analysis indicated that the primary reason for the lower cross shopping rate with shops located in the downtown’s old retail core was that the Plaza’s in front parking lot constituted a huge pedestrian moat. “The distances between the shops in Rutland Plaza and those just across the street vary between 430 and 848 feet; Plaza shoppers therefore must be strongly motivated to walk such distances. (See photo above). Walking is difficult because it is not easy to quickly traverse the intervening Plaza parking lot—and it is made even more difficult by Rutland’s long winters.”
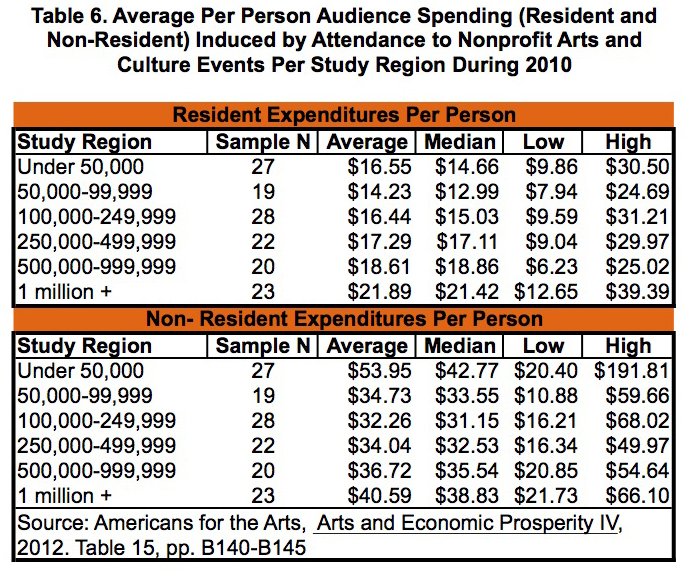
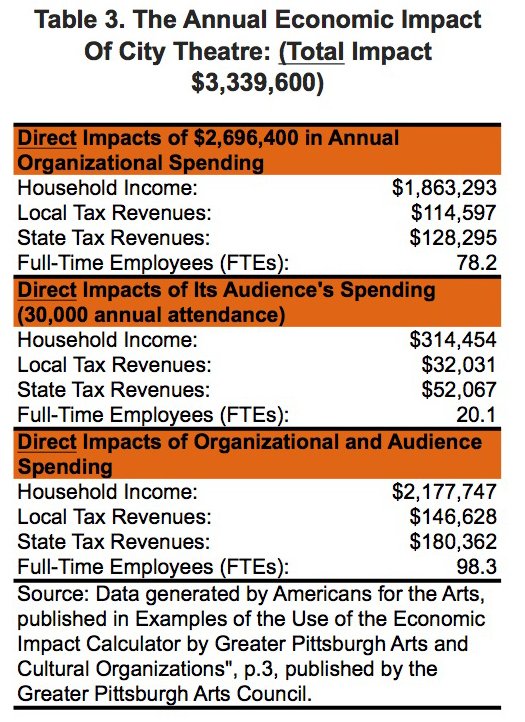
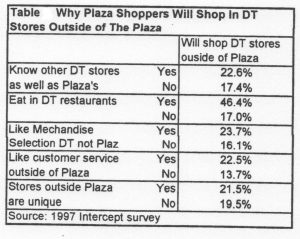
- The single most important factor that influenced Plaza shoppers’ decisions about visiting other downtown shops outside the Plaza was whether they planned on eating downtown while on their shopping trip. This factor was at least twice as strong as their knowledge of downtown stores or if they liked the merchandise, customer service or uniqueness of those stores (see table below). Ever since, this finding has strongly shaped my approach to downtown retail revitalization, because it indicated how important restaurants and opportunities for social interaction are to retail success. This is a view increasingly held by major developers and retail chains. For instance, Apple’s Angela Ahrendts has recently said that Apple’s stores should become more like town squares (https://in/d88XcR9 ) .
- The trade area telephone survey found that the strongest factor for explaining how often respondents visited downtown shops located outside of the Rutland Plaza was how often they visited the Plaza. This means that without the Plaza or with a diminished Rutland Plaza, the shops in the traditional downtown core would have many fewer shoppers, especially those with longer driving times.
- The telephone survey also showed, quite surprisingly, that even after the Rutland Plaza brought in TJ Maxx, Fashion Bug and Poore Simon’s and Diamond Run Mall brought in department stores and specialty shops, trade area residents were more dissatisfied with the trade area’s apparel shops than any other types of retailers. Our analysis also showed that those with more comfortable incomes were prone to be most dissatisfied.Looking at more recent times, those findings suggest that the stressors causing small downtown merchants to close during and after the Great Recession probably were not either the retail chains located in the Rutland Plaza or the new big boxes that opened on the Routes 4/7 corridor. Most of the latter also sell merchandise that does not strongly compete with the offerings of downtown merchants. The more likely causes of those closings were the significantly decreased demand generated by the emerging mass of deliberate consumers and the already weak competitive capabilities of these failing merchants that resulted from a weak financial condition, an inability to adapt to new conditions and/or a poor set of merchant skills.
I would argue that today, even with the growth of e-commerce, in both Rutland and Scottsbluff, there are substantial opportunities for savvy independent downtown retailers to find the parts of the retail bed the 800 pound value-oriented/low price retail gorillas are not occupying and to consequently have considerable success. Additional market opportunities are being provided by the weakness of their malls, department stores and traditional specialty retail chains. Also, independent small merchants typically can survive on a lot fewer annual sales dollars than is needed by a major retail chain store. But, and this is an important but, the independent merchants must be competent to benefit from such opportunities.
The apparel shops I saw in downtown Rutland on my recent visit indicate that to some extent these opportunities now are being realized. One operator has opened two women’s apparel shops on Merchants Row since about 2011. A small chain selling outdoor clothing and equipment opened – even in face of competition from the local Dick’s Sporting Goods and Eastern Mountain Sports. It has two other locations in VT and NH. They show that smaller retailers are seeing significant opportunities. The closing of Sears and JCPenny lso has opened opportunities in the men’s clothing market. However, given the current track record of small men’s apparel shops, an existing men’s store that has survived the Great Recession is probably better positioned to capture some of the surrendered market share than a new entrant.
These apparel merchants are also using the Internet, though some have much more sophisticated uses than others. Of the eight apparel shops located outside of Rutland Plaza, seven have websites and seven have Facebook pages. All are somehow present on the Internet. Notably, only one has an e-store where purchases can be made online. Two use their websites to really push their customer services by offering personal shopper assistance and home visits.
Also worthy of note is that two of downtown Rutland’s eight apparel merchants are parts of small regional chains that have three to nine locations. These shops are not under “newbie” operators and have a greater likelihood of success. Downtown Rutland’s core lacks the available 3,500+ SF retail spaces that might enable it to recruit the types of retail chains that feel at home in smaller cities. Scottsbluff’ has attracted many of them them, but not to its downtown.
One major reason that small merchants in both of these downtowns have not had still greater success is that by themselves they lack sufficient magnetism for drawing a lot more people. If these two downtowns could attract more people, they would have more potential shoppers, have more successful retailers and attract better retailers.
Over the past two decades, downtowns of all sizes across the nation have come up with two successful tactics to attract more people downtown. More downtown housing has proved to be very helpful because it creates a captive market of people who want a wide range of activities to engage in – shopping, dining, being entertained, recreating, etc. — within easy walking distance of their residences and their impacts are amplified by their friends and relatives who visit them. In my opinion, both downtown Scottsbluff and downtown Rutland would benefit greatly from a significant amount of housing being located in or near (e.g., within a 10-minute walk) their districts. In my discussions in various rural cities over the past decade, I have heard the following reasons cited to explain why downtown housing was impractical in their communities:
- The unavailability of appropriate sites
- The general low level of housing demand
- The lack of specific demand for condo apartments and townhouses because they are somewhat alien to residents of rural areas.
It can be argued that if local leaders are aware of the potential benefits of such housing and prepared to act, the above concerns most probably can be successfully addressed with arguments along these lines:
- Sites on the fringes of the district, within a 5-minute walk, are probably easier to find and cheaper to build than those within the district, but they still make it easy for residents to walk downtown
- The growing senior popualtion is increasingly active and many are looking to downsize to easier to maintain smaller residences. Scottsbluff already has been attracting many retiring ranchers and farmers. Many of the seniors would enjoy the close proximity of restaurants, shops, cultural and entertainment venues and professional offices.
- The young people who are leaving these communities are often going to other cities that have a lively downtown with lots of nearby apartments and townhouses.
Many downtowns have also found that strong, broadly defined entertainment niches can bring many new visitors downtown on a sustained, long-term basis. Both downtown Scottsbluff and especially downtown Rutland have elements of such a niche. However, my sense is that the impact of their entertainment niches on downtown retailers has not been as strong as it could be. In Rutland, that certainly has not been for the lack of trying or even for a lack of important successes. The Downtown Rutland Partnership along with the Rutland Development Authority and other civic groups worked long and hard to successfully redevelop the Paramount Theater and to encourage the attraction and development of the art galleries and children’s museum. The owners of the Rutland Plaza succeeded in getting a new operator for its movie theater at a time when quality operators had become much harder to find. The Famers Market has developed into a strong regional draw, though it only operates on one weekend day.
There are definitely things to do in downtown Rutland after dark – and that may be part of the problem. Most of the customer traffic to two of its strongest entertainment niche elements, the Paramount Theater and Flagship Cinemas probably comes when most small independent retailers are closed, i.e., in the evenings and on Sunday afternoons. The children’s museum, art galleries and Farmers Market are certainly assets, but they target rather specialized interests or have limited operating hours. What seems to be missing is a well activated public space, something akin to Mitchell Park in Greenport, NY, or The Division Street Plaza in Somerville, NJ, or Grand Central Plaza Park in Valparaiso, IN, that can attract people during the daytime, providing both a pleasant respite and entertainment.
Such public spaces not only can provide venues for a wide variety of events and activities, but they can also provide visitors with opportunities to find a safe and comfortable retreat or to simply be entertained by watching what other users of the space are doing. Importantly, such spaces also can provide opportunities for visitors to engage in a broad range of activities such as playing chess, riding a carrousel, ice skating, running through a splash pad, reading a book or magazine, playing miniature golf, etc.
Over the past two decades, I have engaged in a number if informal discussions with downtown leaders in cities with populations under 35,000 about creating strong downtown public spaces. In too many instances I have heard that such projects were not feasible in their downtowns because:
- They would be too expensive to build and operate
- Their winters are too long and too cold
- A lack of appropriate sites
- Such spaces would be dominated by drug users and dealers, the homeless and/or unruly and intimidating teenagers.
Public spaces definitely require funding, but DANTH’s research has shown that attractive and successful downtown public spaces can be created and maintained at significantly lower costs than PACs, theaters, arenas, ballparks and museums. Moreover, their operating cost per visitor are also far lower. For any downtown that wants to strengthen their entertainment niche, creating an attractive public space will most likely produce the biggest bang for their bucks. See: https://www.ndavidmilder.com/2014/11/bryant-park-part-3-a-comparison-to-other-entertainment-venues-on-annual-expenditures-and-annual-expenditures-per-visitor. The downtown leaders who create these spaces often use numerous funding sources, e.g., city, state, federal and foundation grants and private donations, as well as several financial tools, e.g., tax increment financing, to pay for their construction. All are well known, not protected secrets.
Many downtowns are located in cold climes and a lot of them have found ways to make their public spaces active during the winter months. A favorite tactic is to turn them into ice skating rinks. For example, Grand Central Plaza Park in downtown Valparaiso, IN, just added a new pavilion that covers an open air ice rink in the winter and provides a shaded venue for events during hot summers. The park also has a splash pad for children on hot days and an amphitheater for outdoor concerts and other events.

Central Park Plaza’s Splash Pad in Valparaiso, IN. Photo by SEH
Central Park Plaza’s new pavilion during the summer

Central Park Plaza’s new pavilion during the colder months – an ice skating rink
I have been amazed by how appropriate sites for such public spaces have been found. Division Street Plaza was a decaying side street. Mitchell Park was a burned out hotel and marina on badly contaminated land. The 4,000 SF pocket park in Washington Borough, NJ, was a decayed old building. It’s surprising what a little ingenuity can come up with and how that ingenuity appears when downtown leaders really want a vibrant public space.
Effective and humane programs for dealing with the homeless in public areas are to found in many places across the nation. That wheel does not need reinvention, though some tailoring to local conditions may be required. Other bad behaviors can be kept out by bringing in a lot of well-behaved users and nipping some behavioral problems when they are still in the bud.
As I researched for this article, I was most happily surprised to find that serious steps are now being taken in both downtown Scottsbluff and downtown Rutland to meet their needs for new vibrant public spaces. In Scottsbluff, buildings are now being cleared to provide the land needed for the Downtown Plaza. Eventually it will have a stage, space for vendors, a venue for their Farmers Market, an artificial ice rink in the winter (like Bryant Park in NYC) and space for other events, such as outdoor movies. Very importantly, it also will provide public restrooms. (See the graphic below.) It will be completed in three phases.

Basic design of downtown Scottsbluff’s new Downtown Plaza
Given its size, visibility, uses and proximity to downtown retailers, one might anticipate that the Downtown Plaza will have positive benefits for nearby merchants and restaurateurs. One concern is that while care is being taken to have adequate shading, I have not found in my brief search any mention of how seating will be provided. Seating can be a critical issue. Another concern is how long it will take for the Plaza project to be completed or to reach a critical mass.
In Rutland, for about a decade now, local leaders have been trying to redo an existing public space, the Center Street Alley, that had been used in the early 1980s as a venue for downtown events. It later fell into disrepair and encountered user avoidance. Public use was halted. With federal funding, plans for this space reportedly again on the table and call for it to be reopened to the public after the installation of “new brickwork, lighting, benches and trees.”
The Center Street Alley space, to my ken, is rather strange. Its main part has little visibility from any of the surrounding streets, as can be seen from the map below. It occupies the center of a city block and seems to have been created from the backyards of the surrounding buildings that face Strongs Avenue, Washington Street, Center Street and Wales Street.
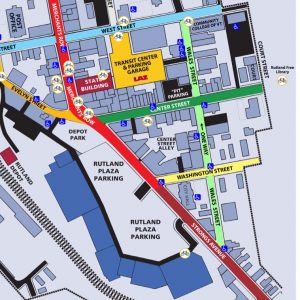
Look for the Center Street Alley in the center of this map — Map from Downtown Rutland Partnership, cropped by NDM
One can easily visualize how such a space might provide both a nice refuge for visitors to sit quietly and a venue for public events. But, its ability to make the downtown appear more active and exciting seems hampered by its lack of visibility to passing pedestrians and autos. I plan on following what happens to this space. My concern is that its “hiddenness” may impede daily use levels and limit its favorable impacts on nearby merchants. On the other hand, its hiddenness may give the space a kind of quirky, being in the know appeal.
Some Takeaways
- The weakening of retail malls and traditional specialty retail chains in our smaller rural regional commercial centers is giving savvy downtown merchants serious market opportunities. The apparel shops in downtown Rutland show that savvy, small downtown merchants can indeed take advantage of these market opportunities. Their presence on the Internet is helping them do that, at least with shoppers within their trade area. They are not using the Internet to generate online sales from national markets.
- The growth of big box and value oriented retailers probably is not what mainly forced many small downtown retailers out of business during and after the Great Recession. More important was the reduced demand created by the emergence of deliberate consumers and the merchants’ inability to respond appropriately to the new and highly stressful situation.
- Downtown Rutland shows that attracting some of the big retail chains, e.g., Walmart and TJ Maxx, can be good for downtown merchants because of the strong customer traffic they bring in.
- However, good urban design has to be used to assure that these big retailers will be physically integrated into the downtown. That enables small downtown merchants to share in the big retailers’ customer traffic.
- Downtown restaurants, public spaces and other central social district entities can help bring people downtown who then become potential shoppers for local merchants.
- There is a tendency in these rural commercial centers for multi-unit housing not to be developed in or near their downtowns, probably due to cultural preferences and poor market research. The downtowns would greatly benefit from such development, especially their restaurateurs and retailers.
- A challenge for the merchants in these downtowns is to get the shoppers who are going to other shopping centers and malls in the city to visit their district. Developing the downtown’s central social district functions, which includes housing, restaurants, bars, entertainment and cultural venues is a sound strategy for attracting those shoppers. For small downtown retailers, restaurants and public spaces are especially helpful because they are active when the merchants’ shops are open. Of course, if downtown merchants would change their hours to coincide more with those of downtown entertainment assets, they probably would get significantly more sales. We can dream, can’t we!
- Having a public space does not mean it necessarily will have the desired level of positive benefits for local merchants. The space must work, it must be vibrant and attract people and events. Simple things like adequate seating and shade can be critical to their success. The space also probably needs to be fairly visible to pedestrians and cars passing by.
Up Next : Affluent suburbs with lots of trophy retailers