The Arts As an Important Downtown Revitalization Tool — Redux. Part 3
By N. David Milder
Introduction
This is the third and final article in a series aimed at helping downtown leaders and stakeholders (downtowners) in our smaller communities to more accurately assess just how strong an economic engine the arts can be for their districts. The focus, this time, is on the potential audiences for the events their arts venues might put on. Audience preferences and behaviors are changing and create significant challenges for those programming arts venues. In part, this is due to the electronic consumption of arts products – e.g., books, films, concerts, recorded music, plays, operas, etc. Of course, some performing arts have long had electronic distribution via radio, recordings and some TV, e.g., all forms of popular music, country music, classical music, jazz and opera. (Texaco sponsored radio broadcasts of the Metropolitan Opera for 63 years!) However, Internet streaming and the use of personal electronic devices may have brought about paradigm-level changes in arts consumption, and its full impacts are still unclear.
Perhaps even more important determinants of changing arts consumption preferences are shifting demographics and consumer behaviors such as
- The maturing of the huge Millennials age cohort and its arts preferences and spending patterns.
- Our growing “minority” populations, especially Hispanics, and their arts/entertainment preferences.
- Our long-term wage stagnation and the emergence of much more cautious consumer behaviors.
Together, they have created significant constraints on an arts organization’s ability to penetrate local consumer markets. They’ve strengthened arts venue admissions prices and convenience as determinants of personal decisions about whether or not to attend an arts event. Consequently, more and more arts organizations must choose between:
- Charging higher and higher admission fees for high-quality events that only can be afforded by affluent households.
- Assuming greater financial jeopardy by either lowering their prices or offering free access to a much broader audience demographically, or
- Providing performance and exhibition events that are perhaps less attractive, but can be provided at an affordable cost for the arts organization to produce and at affordable prices for their audiences.
We may well be in the midst of a trend where in person attendance at arts events is becoming overwhelmingly for the wealthy, while the middle and lower income strata consume arts products primarily through electronic media.
Most towns with populations under 25,000 do not have large numbers of wealthy households that can most easily afford arts event admissions fees. Their arts venues must compete with arts/entertainment consumption opportunities available physically nearby as well as through electronic media. To compete effectively, they must provide sufficiently attractive events that are not financially threatening for them to produce, yet affordable for consumers. That can be quite a challenge.
A Closer Look At Arts Consumption Through Electronic Media
Just as the Internet has disrupted our nation’s retail industry, electronic access channels are changing how Americans consume arts/entertainment events and content. For example, in 2012, a large National Endowment for the Arts (NEA) survey on public participation in the arts found that 71% of its respondents had consumed arts through electronic media in the past year:
- 61% Used TV, radio, or the Internet to access art or arts programming
- 38% Used a handheld or mobile device to access art
- 27% Used a DVD or CD player, a record-player, or a tape-player to watch or listen to music or to programs about theater, dance, visual arts, or literature. (1)
Today, most movie watching in the US is not done in movie theaters, but on TVs and personal electronic devices – and by a very wide five-to-one margin (2). The NEA survey also found that 4% of the respondents watched operas electronically (2.1% reported attending in person), while 7% claimed that they watched some form of dance recital, musical or stage play electronically. Since 2012, those numbers probably have increased. A number of theater and opera companies have made much stronger efforts to engage in simulcasts and other forms of electronic distribution to regain audience share and strengthen their finances. The Metropolitan Opera Company in NYC, for example, will simulcast 10 operas in 2,000 theaters located in 70 countries during its 2017-2018 season (3).
Frequently, this electronic distribution has meant that famous plays and operas with celebrated performers became available to audiences in theaters – including many movie houses — in smaller communities in which they otherwise would never have appeared. This enabled these theaters to have a better “arts product” to offer in their local market areas. On the other hand, the big arts organizations’ expansion of their electronic performances may mean more competition for smaller performing arts companies, e.g., regional theaters and opera companies. Or they might be market builders for these smaller performing arts companies as, in years past, Texaco’s opera broadcasts were for smaller opera companies across the nation. Speaking with such uncertainty here is intentional since it demonstrates a key characteristic of the situation most arts organizations now are in when dealing with e-arts.
Museums across the world are rushing to put their holdings on their websites. See, for example, https://www.rijksmuseum.nl/en/rijksstudio where you can browse through 606,474 of its works of art.
Moreover, by 2013, 79% of the sales of music and videos and 44% of books and magazines in the US had moved to the Internet (4).
While it is still too early to tell with any real certainty how e-arts are impacting attendance at events held at most brick and mortar arts venues., movie theaters are an exception. Most observers agree that electronic consumption has reduced attendance at our movie theaters. Certainly, by offering households a cheaper and very convenient way to consume arts/entertainment products, they directly meet consumers’ strongest concerns about attending arts events and probably reduce to some unknown extent the need to go to another geographic location to consume them. Annual movie attendance today is nowhere near the per capita levels it reached in the 1930s and 1940s when weekly attendance was far from abnormal. More recently, aggregate movie attendance has dropped by about 14% between 2003 and 2016, though the US population had grown by about 11% (5). Also, since only about 12% of the movie industry’s annual sales come from US movie theaters, they are seen now by industry leaders primarily as a marketing tool to support electronic revenue streams, not as a major profit center (6). Some movie moguls would like to stop distributing all films to them and rely solely on pure digital distribution channels.
On the other hand, the practices of one theatre in a smaller community suggest that the distribution of arts/entertainment events over the Internet sometimes can be quite advantageous for such venues. This theatre not only offers simulcasts of arts events, but also football playoff games and baseball world series games. The sports events are offered free and the theater recoups costs from its concession stand. This theater is not so much in the arts business as it is in the entertainment business, of which the arts certainly are an important part.
Savvy arts organization leaders may, in the future, find more ways to positively leverage the electronic media.
Patterns in Arts Venue Attendance
There are many kinds of arts events. As common sense indicates and opinion surveys confirm, the content of an arts event is one of the most important determinants of an individual’s decision to attend it or not – more about this later. Knowing the popularity of the various types of arts events is critically important for any arts organization, especially new ones. Such knowledge should help arts venues and organizations shape the events they put on and how they are marketed.
About the Data. The discussion below is based on a secondary analysis of various kinds of data collected by a number of other organizations. There are two ways of looking at admissions. The first is how many times people report attending various types of events in assorted opinion surveys. The second is based on the admissions reported by arts venues or organizations, usually when they are surveyed by related professional organizations such as the League of American Orchestras or Opera America. Each has its methodological problems that cannot be detailed here without making a major diversion. Let’s just say that they should be treated with some caution, but when their findings show consistency and agreement they deserve serious attention. However, that means that the same subjects have to be looked at from two perspectives, even though it may appear repetitive
Attendance Data from Surveyed Individuals. The NEA has conducted three important large surveys on the public’s participation in the arts in 2002, 2008 and 2012. Some of their findings about attendance for a variety of performing arts events are presented in the table below.

One thing to notice is that fewer than 12% of the respondents in all three NEA surveys attended these kinds of “high culture” performing arts events. They have not captured large market shares. Moreover, other data sources indicate that attendance for these types of performances pales in comparison with that of motion pictures. For example, in 2013, about 68% of the US/Canada population went to the movies at least once in the previous year (7). The relatively small audiences for these performing arts forms suggest that arts venues that try to capture them will do well if they either have a large cluster of these potential audience members living nearby or are able to penetrate a relatively large market area in which sufficient numbers of them are present. These market areas are probably much bigger than the trade areas of the retailers in the towns in which the arts venues are located. Such market penetration will require a very effective marketing program and strong arts products.
The second thing to notice is the pattern of attendance decline that afflicted all types of events save those involving Latin, Spanish and Salsa music. The Great Recession had an obvious hand in this. Any rebounds by 2012 were uneven. The attendance declines were significant: -23%, -25%, -11% -31% and -34%. Operas and ballets, according to these surveys, were hardest hit.

The above table is based on other survey data presented in the National Arts Index, 2016 Report produced by Americans for the Arts. It is based on a collection of surveys that were done by one research firm of people attending arts events. The Index report provides attendance data for each of the types of venues/events listed for the years 2002-2013, with 2003 being set as the base comparison year. In that report, attendance statistics for 2003 are treated as having an index value of 1.0. The table above looks at just three of those years: 2003, the base year; 2010, the year after the Great Recession formally ended, and 2013, the last year for which the Index had complete information. By 2013, economic recovery was well underway, if bumpy and uneven.
Data about population growth has also been inserted in the table, with that of 2003 again having an index value of 1.0. It is there to serve as a kind of benchmark of potential arts attendance growth. If the population grows, one might reasonably expect arts attendance will, too. However, such growth would not be strictly linear. There is probably a lag time before “newcomers” become old enough or sufficiently acculturated to attend arts events. To provide some insight on that contingency, data on population growth for the 1993-2002 time period is also included. Between 1993 and 2013, there was substantial population growth — about 11% between 1993 and 2002 and about 9% between 2003 and 2013. This population growth should have had some significant positive impact on the potential size of arts event audiences, even allowing for a time lag.
The Index’s data confirms the patterns found by the NEA surveys. Compared to 2003, the decreased attendance rates for high culture performing arts events in 2013 were:
- Dance and ballet performances, down from 1.0 to 0.87
- Live theater shows, down from 1.0 to 0.87
- Symphony concerts and operas, down from 1.0 to 0.79.
All had significantly fallen by 2010, probably due in large part to the Great Recession.
The table also shows that those performing arts that might be considered to be more as popular entertainments than vessels of high culture were somewhat more resistant to the recession and showed significant audience growth between 2010 and 2013. Their index scores moved over those four years from:
- 0.95 to 1.25 for country music concerts
- 0.93 to 1.34 for r&b/rap/hip-hop concerts
- 1.02 to 1.17 for rock concerts.
Online visits to a number of theaters and performing arts centers in smaller and medium-sized cities across the nation showed that their schedules were dominated by popular entertainments rather than high culture performing arts events. This is probably the programming path that new performing arts venues in our smaller communities should pursue if they want to have audience appeal and financial stability.
Given our nation’s population growth and the ability of popular entertainment types of performing arts to grow significantly in the post recession years, the public’s reported lower attendance at dance and ballet performances, live theater shows, symphony concerts and operas probably are due to factors other than those associated with the Great Recession. One hypothesis is that they simply became less popular.Another is that their ticket prices are too high.
Culture Track 2014 also looked at arts audiences. It used an online survey with 4,000 + respondents. However, those respondents “were double-confirmed for interest in cultural events and attendance to at least one cultural activity in the past year” (8). The survey consequently only looks at the “culture choir,” so to speak. Doing that can be very useful because the members of this culture choir are the most likely patrons of cultural events and its always good to know your customers and their characteristics. However, less useful for the current analysis, the survey did not differentiate participation done at an arts/cultural venue in person from participation done electronically, e.g., via streaming or the radio or TV. The survey found that among these proven culture consumers, attendance between 2011 and 2014:
- Rose for historic attractions, living museums, science museums, art museums and art galleries. Declined for children’s museums. Moreover, overall, the museums attracted the most people.
- Rose for musical theater, but declined for dramatic theater.
- Rose for classical music and jazz, but declined for opera.
- Declined for both modern dance and classical dance. (9)
The attendance patterns of these proven culture consumers differed from those found in surveys of our general population that also included those who did not attend arts events. Their attendance at museums, classical music, and jazz events rose. However, opera and classical dance also showed declines among the culture consumers.
Data from Surveyed Arts Organizations. These surveys have some important built in potentials for significant errors. First, they use samples of orchestras, museums, opera companies, theater companies, etc. The question of how representative each sample is always is an issue. The response rates among smaller venues in each group, for example, has had a substantial variation that has impacted on findings. Second, the surveys are then used to extrapolate to the entire arts sector and this can also bring in errors. For example, the Theatre Communications Group (TCG) represents 1,750 nonprofit theatres. Its annual report for 2015 on aggregate attendance, average capacity utilization, tickets sold, packaging and pricing was based on the responses of 198 theatres. The results of that survey were then extrapolated out to the 1,750 theatres that are assumed to be the entire nonprofit theatre universe. Another issue is which events are being included in an organizations counts. For instance, orchestras and dance companies can have traditional concerts, but also educational and community outreach events. Often just attendance at the traditional concerts is counted.
The table below shows that two types of for-profit performing arts events – Broadway shows and touring Broadway shows – basically came through the Great Recession with larger audiences. However, as noted earlier, attendance at movie theaters — that are also for-profit ventures — declined during this period.
Consistent with surveys of the general public’s (not the culture choir’s) participation in the arts, the surveys of arts organizations found shrinking audiences for art museums and operas in 2010 as compared to 2003, and by 2013 they had not rebounded.

SYMPHONY ORCHESTRAS. Contrary to the surveys of the public, the surveys of organizations that manage symphony orchestras and nonprofit theaters in the Arts Index data show significant attendance rebounds from 2010 in 2013 and growth from 2003. It is useful to take a closer look at them.
The symphony attendance went from an index value of 0.94 in 2010 to 1.15 in 2013, while the nonprofit theatres went from .90 to 1.02. The Arts Index explains that the increase in symphony orchestra attendance counts in 2013 “reflects higher response rates to the League (of American Orchestra’s) survey among small orchestras, which have above-average levels of attendance at community engagement and education events” (10). These events, that often are contrasted with “core events,” are regularly uncounted. As the Arts Index, 2016 Report notes: “Much symphony, theatre, dance, and opera activity is offered in educational and community settings to large audiences. Those audiences, however, are not systematically counted” (11). The Arts Index apparently includes such counts when available.
In 2016, the League issued an important report that recognized a significant decline in its core audience between 2010 and 2014:
“Overall, audiences declined by 10.5% between 2010 and 2014…, broadly in line with other performing arts sectors…. This decline was sharpest within tour audiences, which decreased by almost 50% over the five-year period” (12).
However, it proudly proclaimed in the same report that:
“Over the same time period, the symphony has become more accessible to a wider range of people, with the average ticket prices dropping, free attendance rising, and orchestras engaging large and diverse audiences through a range of education and community engagement programming” (13).
The decline in tour audiences suggests that the orchestras had severely reduced drawing power for smaller concert venues in smaller communities.
That report made a number of other points that also illuminate the position many performing arts companies may find themselves in these days:
- Free Activities. “In 2014, free attendance at orchestra performances, activities, and other musical events was at its highest point in the previous five-year period, and the lowest ticket prices offered were at their cheapest and most affordable level.” (14)
- “Approximately one in four performances, musical activities, and events offered by League member orchestras was delivered free of charge to audiences and participants, each year from 2010 to 2014.”
- “Opportunities for audiences to attend both (community engagement and education programs) and symphony performances for free increased over the five-year period. Indeed, by 2014, 15% of all audience members for “core performances” (a term used to refer to all performances excluding those given on tour or within the orchestra’s community engagement and education programs) were attending without charge.”
- Lower Admission Fees. “Over the same time period, the cost of attending paid-for orchestra performances became more accessible to a wider public. Specifically, League member orchestras dropped the price of their most expensive tickets by 30% between 2010 and 2014, and that of their least expensive tickets by 12%, on average.”
- Financial Stress Remains. “Despite this drop in ticket prices — but broadly in line with other performing arts sectors — 60% of the 65 League member orchestras reporting data to the OSR reported a drop in overall attendance, between 2010 and 2014….”
Free admissions and lower ticket prices are apparently needed, yet unable to stabilize attendance. Both, however, are likely to place the arts organizations under increased financial stress and with a greater need for contributed incomes. Yet, the biggest benefits that these symphony, theatre, dance, and opera companies may provide in smaller communities may result from their free admissions and community engagement and education programs.
NONPROFIT THEATRES. These arts organizations were having attendance problems well before the Great Recession. Again using the Arts Index data, with attendance in 2003 equaling an index value of one, the annual index scores for nonprofit theatres between 2004 and 2008 were 0.94, 0.95, 0.89 and 0.90. However, in 2012 attendance had surged to 1.07, though it declined to 1.02 in 2013.
In 2016, the Theatre Communications Group, the industry organization for nonprofit theatres, issued a major report that noted: “Attendance is an ongoing challenge and serious concern for theatres” (15). Between 2011 and 2015, attendance peaked in 2012, but then entered into several years of modest decline. Over these five years, total attendance dropped by -3.6%; -2.7% for resident audiences, and a more significant -14.1% for touring audiences. These declines occurred despite an increased number of performances for both resident and touring audiences (16).
The audience decline for the theatres is an admitted serious concern, but it has not been as severe as it has been for the orchestras, especially for touring performances. It is also interesting to compare them along a few other dimensions:
- As with the orchestras, nonprofit theatres have a significant number of free admissions. Three to four percent of all performances are free (compared to 25% for orchestras) and 10% of their resident audiences attended free of charge (compared to 15% for orchestras). (17)
- Community outreach and education activities are also important for the theatres, though they charge fees for them that are a significant revenue source. However, much of this outreach and educational activity appears to be related to “training,” for which fees may be expected by participants.
- In contrast to the orchestras, nonprofit theaters increased their admission fees between 2011 and 2015: 11.4% for subscriptions, 12.3% for single tickets (18). This might be because theatre ticket prices have been lower or perceived as more affordable by potential audience members than orchestra ticket prices. Or it might be because theatres are less interested in trying to attract less affluent potential audience members.
Some Observations:
- Fluctuations in annual attendance are to be expected at performing and visual arts events, much as any business has fluctuations in customer traffic and sales. Additionally, just as businesses were adversely impacted by the Great Recession, so were nonprofit arts organizations.
- However, most of the performing and visual arts have had relatively unsteady and slow recoveries in attendance from the recession.
- This struggle has continued despite significant population growth over the past two decades. Two possible explanations are: they simply have become less popular generally or they may not be winning over as many young people and immigrants as they did in the past.
- Another troubling factor about arts attendance is that there seems to have been a critical and steady decline in the number of people who frequently attend arts events. For example, Culture Track’s surveys found that in 2007, 31% of its culturally engaged respondents reported attending three or more events per month, but in 2011 that number had fallen to 22% and in 2014 it was only 15% (19). The arts’ core consumer base appears to be shrinking.
- The degree to which potential audience levels at brick and mortar arts venues have been clipped permanently by electronic consumption channels is still unclear, but such a diversion probably has occurred. For example, Culture Track’s 2014 survey found that about 8% of its respondents reported less frequent attendance at cultural events, because they were “experiencing culture in alternative ways” (20).
- Some types of performing arts, however, have demonstrated a significant ability to quickly rebound from the recession and to sustain meaningful audience growth in the post-recession years. These performing arts are conventionally seen as popular entertainments – e.g., salsa music, R&B, rap, hip hop, etc. Those that have struggled most are those often associated with high culture or affluent audiences: e.g., opera, ballets, symphony orchestras.
- In this dynamically changing environment, it is important that arts venues and arts organizations in our smaller communities know who their potential audience members are, what types of arts they are likely to consume, and the spending power they likely would bring with them.
- To win and maintain broader community support, they also should be prepared to provide a significant amount of community outreach and education activities as well as a significant number of free admissions. Doing this will likely increase their need for contributed incomes significantly.
Arts/Cultural Venues and Organizations, For-Profit or Nonprofit, Are in the Entertainment Business
Unless they have a sufficient base of very rich, very culturally superior and very socially snobby people to comfortably support them, any arts or cultural organization should guard against coming across to the public as having those attributes. Not only is it morally offensive, it’s bad for business and their survival.
People engage in cultural activities for basic reasons of personal enjoyment and social conviviality. For example, Culture Track’s 2014 survey found that the strongest reason its large sample of people who attend cultural events gave for making cultural activities a part of their lives was that they were entertaining and enjoyable, 93%. It was followed by being able to spend time with friends and family, 83% (21).
Also, as was noted above, the performing arts that are conventionally seen as popular entertainments are precisely those that have done best over the past decade. In many small and medium-sized communities, their successful performing arts centers (PACs) or theatres have recognized this fact and structured their programs accordingly.
Event Content and Admission Cost Drive Individual Attendance Decisions
Culture Track’s 2014 survey investigated the positive and negative elements – termed motivators and barriers – that are involved in an individual’s decision-making about attending cultural events. It listed many factors. However, as can be seen in the table below, event content and admission cost stand out because they rank either first or second among both the motivators for and the barriers to attendance. Content is the most important motivator of attendance; event cost is the most important barrier.

The above discussion of arts audience admissions delved into the popularity of different types of arts event content as well as their fluctuations and uncertainties. In the first article in this series, considerable attention was focused on the need for arts venues/organizations to have strong “arts products.” If an arts organization/venue is to succeed, it must certainly provide the types of events that local arts consumers want and enjoy.
The Culture Track survey also shows that the desirable arts product must also be provided at a price that people can afford.
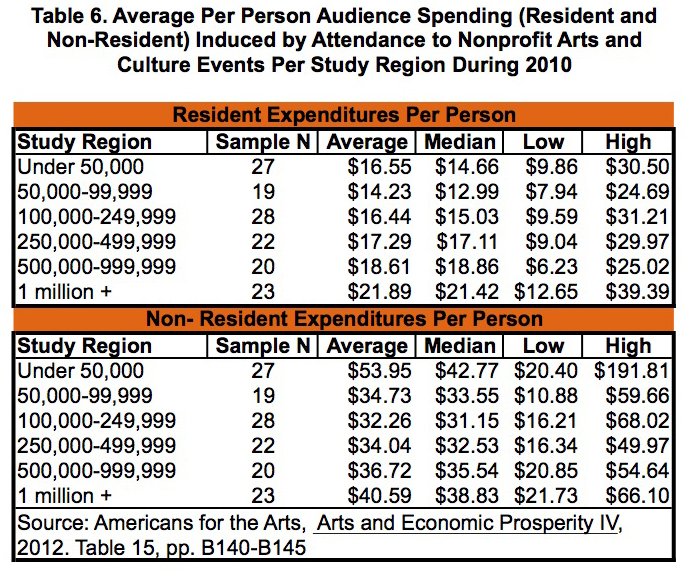
Affordability is a function of the product’s price and the consumers’ incomes. Those with higher incomes obviously can afford more things. The table below shows that households in the top income quintile account for 54.8% of all household expenditures for entertainment fees and admissions — that includes those for arts/cultural events. The top 40% of households by income account for 75.4% of all entertainment fees and admissions expenditures. For smaller communities that want to develop strong arts venues that draw significant audiences, the distributions of household incomes in their market areas should be significant factors in determining their admissions price structures.

The Content – Ticket Price Connection. This is very important: people will be willing to spend more for content they really like. They also are less likely to spend much on tickets for events with content they are unfamiliar with or dislike. This connection is aptly illustrated in this quote from a report from the Wallace Foundation:
“I can see myself paying $100 for a show I’ve wanted to see for a long time, but not more than $50-60 for a normal show, and really more like $20 to 30 if I can.” (22).
Impact of Deliberate Consumers. Americans have suffered from wage stagnation for decades and the Great Recession sparked a wave of more deliberate and conservative consumer behaviors (23). Though this more deliberate consumption has eased somewhat with economic recovery, it still remains very strong among middle-income households and even continues to impact on luxury retail purchases. It also has had its impacts on attendance at arts events. For example, Culture Track’s 2014 survey found that 40% of the respondents reported attending fewer culture events because of economic conditions, and among them:
- 82% reduced expenses across the board
- 51% cut back on leisure activities
- 51% reprioritized their expenditures of leisure time and money
- 20% experienced culture in alternative ways (24).
Some Ticket Prices. Expectations about ticket prices often are higher than they actually are. In one study, for an actual ticket costing $20:
- Millennials estimated it would cost $44.57
- Gen Xers estimated it would cost $34.00
- Boomers estimated it would cost $29.05. (25)
Generally, smaller communities have arts organizations with smaller audiences and smaller budgets – and lower ticket prices, as demonstrated in the table below that shows ticket prices for 38 opera companies by the sizes of their annual budgets.

A good benchmark for setting ticket prices is the average cost of going to the movies in the local entertainment market area. In 2016, the average ticket price was $8.65 nationally, with significant local variations. Throw in about $ 4.50 for popcorn and another $4.50 for a soda and that brings the total up to about $19.00. The more seats that are available near that price, the larger the potential audience — though admission revenues may well decrease.
Online visits to several museums, theaters and performing arts centers in smaller communities showed:
- Museums generally have admission fees of $20 or less, with lower fees for students, children, and seniors. Not much different than $25 at MoMA in NYC or $20 at the Art Institute of Chicago for local residents.
- Tickets for performing arts events ranged from $20 for a play done by a local theater company located in a small rural town, to around $40 to $65 for music concerts in larger rural regional centers, and to a range of between $108 and $1,748 for a seat at a Tom Jones concert at a PAC in a large, densely populated and relatively affluent suburban regional area.
A very important determinant of an arts venue pricing structure may be the definition of its primary mission. If it is to serve residents of the surrounding community and enhance their quality of life, then it will likely have inherent pressures to have lower prices and more free performances that incentivize greater community attendance. If, on the other hand, the venue/organization is tasked with enhancing the area’s prestige or to draw more affluent visitors into its district, then its targeted audiences and pricing structure would likely be quite different.
The Social Aspects of Attendance
Going to arts events with friends and family is an important motivator for attendance. Culture Track’s 2014 survey found that 83% of their proven culture consumer respondents cited spending time with friends and family as an important reason for their engagement in cultural activities. It also found, as displayed in an above table, that:
- 83% said they were motivated to attend cultural events because they were invited by family or friends.
- 73% were motivate because their spouse/partner was interested (26).
A report on building Millennial audiences done for the Wallace Foundation found that socializing and having someone to go with are important factors when they decide whether or not to attend an arts event (27). Culture Track 2014 found that: ” Millennials are far less likely than older generations to go to a cultural activity if it means going alone.”
This behavior pattern explains why arts venues can be such important elements in a downtown’s Central social District and why it will probably become even more important as Millennials age.
The Rising Importance of the Millennial and Minority Market Segments
Our nation is changing demographically. Minority populations are growing rapidly and projections indicate that within about three decades, the white population will be a minority. The largest growth has been among Hispanics. Also, Millennials recently became the largest age group in our population, supplanting the Baby Boomers. The fact that their entry into adulthood has been heavily stamped by effects of the Great Recession means very significant changes are appearing in consumer behaviors – and that includes the consumption of arts products.
Minorities. One of the best windows on the importance of the minority market segments is to look at attendance in movie theaters.
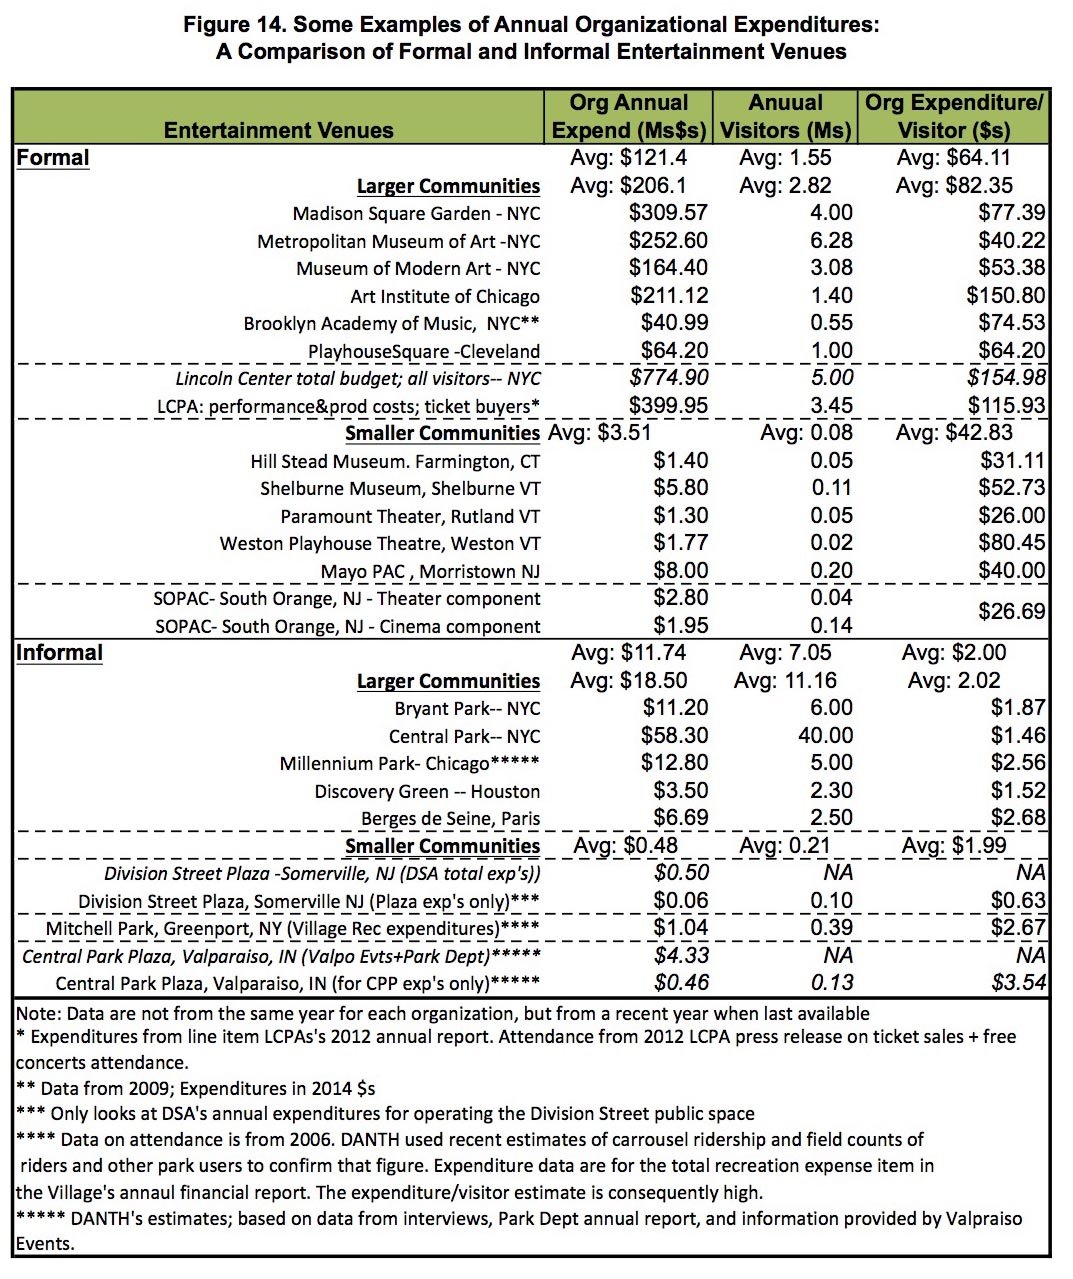
It is amazing how infrequently movie theaters are mentioned when the enhancement of downtown arts offerings is under discussion. Nevertheless, they are often critical cornerstones of many downtown entertainment niches and Central Social Districts. Unfortunately, their future, especially in smaller communities, remains uncertain, even though lots of small cinemas recently successfully dealt with the threatening need to adapt to the digital distribution and projection of films. Besides the presence of a number of Hollywood moguls who want to dump movie theaters as a distribution channel, theater owners are increasingly adopting a strategy that will lead to significantly higher picket prices. It is seen as the best way to cope with declining attendance.

For example, the number of movie tickets sold in 2016 was 86% of the 2003 sales (see above table). On the other hand, gross revenues from ticket sales had increased by 123%, and ticket prices had jumped by 143%, about 12% higher than inflation. To deal with declining attendance, theaters owners have determined that their financial future rests on offering more amenities – big leather reclining seats, terraced seating, restaurant type food and drink, 3D and IMAX screens, etc. – for which they can charge higher fees. The viability of such a strategy is most problematic in smaller market areas from the perspectives of both the theater owner and movie goers. For more on this see: https://www.ndavidmilder.com/2014/05/downtown-formal-entertainment-venues-part-4-movie-theaters

Movie attendance, however, has not been uniform across all ethnic groups. As can bee seen in the table above, between 2012 -2016, the average per capita movie attendance of African Americans, 3.86, Hispanics, 5.46, and Asians, 4.90 were higher than that of Caucasians, 3.36.

This, of course, is also reflected in annual ticket sales:
- Although African Americans, Hispanics, and Asians only account for about 38% of the US population, they account for 49% of the movie tickets sold.
- Caucasians represent 62% of the population, but account for 51% of the tickets sold.
- Hispanics over the five-year period accounted for 21% of the tickets sold, but in 2012 they accounted for over 30%.
- The trend is for minority movie attendance to grow and for Caucasian movie attendance to decline.
One might wonder where many movie theater operators would be today without their ethnic minority patrons?
Movies are an art form that can attract minorities with relative ease compared to many other performing arts for three reasons:
- It is familiar to them. Even if they are immigrants. They do not have to learn what they are about.
- It is relatively very affordable.
- It is probably easy for minority patrons to go to a movie with friends and family, because prices are affordable and cinemas are probably relatively easy to get to.
However, as the growth of Salsa and Spanish music, Rap and Hip Hop suggest, the influence of these minority groups will have an increasing impact on our art forms in the future as jazz and rhythm and blues did in the past. Of course, as their population sizes and household incomes increase, so will their impacts on visual and performing arts audiences.
Millennials. In 2015, Millennials (e.g., those aged 20 to 36 in 2017) became the nation’s largest living generation, then numbering 75.4 million people. Baby Boomers (aged 53-71) were the second largest, with 74.9 million (28). While the Boomers have far more purchasing power, they are aging out. The Millennials, many of whom had the early years of their careers and incomes hindered by the Great Recession, the slow growth of our economy over the past decade and/or very burdensome student loans have started to have their major impacts on our economy — and on the arts. Moreover, their run is only in its early stages and it will be a long one.
As was noted above, the affordability of ticket prices is a key factor in individual decisions about attending arts events and in the determination of the sizes of arts audiences. The levels of household incomes and discretionary dollars structure how much individuals can pay for arts admissions. A report issued by the Wallace Foundation found that compared to prior generations at similar ages, Millennials are more financially challenged:
- They have lower annual earnings.
- They have lower net worth.
- Higher percentages of them have student loans and the loan amounts are much higher (29).
- It is unlikely that these lags in earning and net worth compared to prior generations will disappear even as their careers mature.
The Wallace Foundation study also looked at attendance by 18 to 34-year-olds in 1992, 2002 and 2012. There were declines in all of the studied performing arts: theatre-musicals, jazz, non-musical plays, classical music, dance (non-ballet), ballet and opera. What is interesting is that save for opera, all the others were already in decline in 2002 when compared to 1992 (30). The performing arts’ problem with attracting young adult audiences apparently is not that new.
Culture Track’s 2014 survey found that Millennials was the generation that attended the most events per month and that had the most folks who frequently attended cultural events, i.e., 3+/mo (31). However, since that survey also found that the number of frequent cultural consumers had declined by half since 2014, it is likely that their number has also declined significantly among Millennials compared to prior generations when they were of the same ages.
Ticket pricing will probably have a big affect on an arts venue’s ability to attract Millennial patrons. These venues also will have to compete with other entertainment events that may be more affordable. Moreover, Millennials – who grew up using the Internet and digital devices – are more likely to consume art products digitally, and those arts products are also likely to have the advantages of lower costs and greater convenience.
The competition for Millennials’ attention, time and money when it comes to entertainment can be pretty fierce. Arts venues and the organizations that mange them in our smaller communities must be ready and able to compete.
Endnotes.
1) National Endowment for the Arts. How A Nation Engages With Art. Highlights From The 2012 Survey Of Public Participation In The Arts. https://www.arts.gov/publications/how-nation-engages-art-highlights-2012-survey-public-participation-arts-sppa . Hereafter referred to as NEA12.
2) N. David Milder. Downtown Movie Theaters Will Be Increasingly In Peril. February 24, 2008. See: https://www.ndavidmilder.com/2008/02/downtown-movie-theaters-will-be-increasingly-in-peril . Hereafter referred to as Movies08
3) Data from the Met’s website.
4) Ali Hortac?su and Chad Syverson. “The Ongoing Evolution Of US Retail: A Format Tug-Of-War,” National Bureau Of Economic Research, Working Paper 21464, http://www.nber.org/papers/w21464, August 2015, pp. 33, p.24
5) Data from http://boxofficemojo.com/yearly/
6) See Movies08
7) Motion Picture Association of America. “Theatrical Market Statistics 2013.” P.2. http://www.mpaa.org/wp-content/uploads/2014/03/MPAA-Theatrical-Market-Statistics-2013_032514-v2.pdf
8) LaPlaca Cohen and Campbell Rinker. Culture Track 14, p.2. http://culturetrack.com/wp-content/uploads/2017/02/Culture_Track_2014_Supporting_Data.pdf Hereafter referred to as CT14
9) ibid. p.7
10) Roland J. Kushner and Randy Cohen, National Arts Index 2016, p. 71. Americans for the Arts. http://www.americansforthearts.org/by-program/reports-and-data/legislation-policy/naappd/national-arts-index-an-annual-measure-of-the-vitality-of-arts-and-culture-in-the-united-states-2016. Hereafter referred to as NAI16.
11) ibid.
12) Zannie Giraud Voss, Glenn B. Voss, Karen Yair with Kristen Lega. “Orchestra Facts: 2006-2014. A Study of Orchestra Finances and Operations, Commissioned by the League of American Orchestras” November 2016, p.1. https://www.arts.gov/sites/default/files/Research-Art-Works-League.pdf
13) ibid. p.7.
14) ibid. All of the points in this series of bullets come from pages 4-7.
15) Zannie Giraud Voss and Glenn B. Voss, with Ilana B. Rose and Laurie Baskin. Theatre Facts 2015: A Report On The Fiscal State Of The U.S. Professional Not-For-Profit Theatre Field. Theatre Communications Group. 2016, pp. 37. P 10.. http://www.tcg.org/pdfs/tools/TCG_TheatreFacts_2015.pdf
16) ibid.
17) ibid.
18) ibid. p.11.
19) CT14, p.9.
20) ibid. p.12
21) ibid p.25
22) “Building Millennial Audiences: Barriers and Opportunities.” The Wallace Foundation, Building Audiences for Sustainability January 2017. Analysis Conducted by Marketing Research Professionals, Inc. Pp.51, p. 21. Hereafter referred to as Wallace.
23) See: https://www.ndavidmilder.com/downtown-revitalization/the-deliberate-consumer
24) CT14, p.13
25) Wallace, p.22
26)CT14, p. 25
27) Wallace, pp.23-25
28) Richard Fry. “Millennials overtake Baby Boomers as America’s largest generation. FACTTANK. Pew Research Center. April 25, 2016. http://www.pewresearch.org/fact-tank/2016/04/25/millennials-overtake-baby-boomers/
29) Wallace p.9
30) ibid., p.14
31) CT14, pp. 10-11.