Article 1 – Part 2
N. David Milder
Author’s Note for Downtown Curmudgeon Blog and Newsletter Readers
A number of readers of the Downtown Curmudgeon blog have asked me to write an article on the new normal for downtowns that I have referred to in many of my blog postings in recent years. In response, I have planned a series of articles that will be posted over the coming six to eight months.
This is the second part of the first article in that series. It focuses on providing a description of the critical characteristics of the new normal and some of the emerging challenges downtown organizations now may face under it. Proper treatment of this subject requires sufficient space and cannot be done within the usual short take format of most blog posts and email blasts. While I have tried to be economical in my use of words, this article is almost 12,000 words long, even when I have skimped on examples and skipped using data tables and other illustrations. I have divided it into two parts. Each part will be posted to my blog and emailed separately.
Later articles in this series will cover such topics as the arc of downtown revitalization, the potential implications of the new normal for downtown development projects and BID programs.
Some of the Challenges Emerging Under the New Normal
Downtown revitalization is a process that never ends because: change is unavoidable and downtowns will consequently face new challenges; downtowns will have new assets and liabilities that will call for them to amend their strategies and visions of the “promised land.” Consequently, downtowns under their new normal can expect to face important challenges. Below are some that already have arisen. Downtown prosperity does not mean the end of downtown challenges — and it is important that prosperity’s joys do not limit downtown leaders’ awareness of the challenges. Following are some challenges that I think are among the most important. Here, again, my discussion is intended to be illustrative, not exhaustive or definitive.
1. The Deliberate Consumer. The Great Recession brought into sharp national focus consumers who act more cautiously and more deliberately in their purchasing decisions. This has impacted downtowns along every dimension where consumer behaviors and expenditures are important: retail purchases; housing rentals and purchases; entertainment admissions and equipment; transportation modes and use; healthcare, childcare and eldercare services, etc.
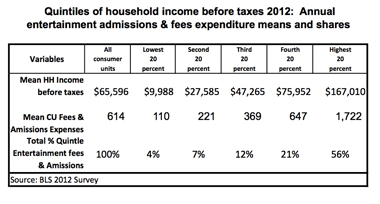
Deliberate consumers put needs far ahead of wants, look for value in their purchases and are much more careful about the use of credit and loans than in previous decades (19). Initially, affluent households exhibited deliberate consumer behaviors, but this eased substantially as the impacts of the recession declined. However, for the broad group of middle income households in the nation’s second, third and fourth income quintiles, this behavior has hardly eased. Indeed, it is part of a trend for a growing number of middle-income families to face strong economic stress that dates back at least to the mid 1990s and is expected to continue on to at least 2021. As Warren and Tyagi outlined in their 2004 book, median incomes for these middle income households were long stagnant, while their disposable incomes were being constantly eroded by the ever rising costs of healthcare, childcare, and education tuitions and fees as well as by substantial interest payments on mortgages and credit cards (20).
More recently, additional stress has been added by the weakening in the job market, not only in terms of the number of jobs available, but also their reduced skill levels, lower pay. Also, the private sector has a growing reliance on freelance workers, outsourcing jobs abroad and computerizing middle level management, technical and support functions. The ability of the stressed middle-income families to find discretionary expenditure dollars has been also impeded by their reduced use of home equity loans and more conservative use of credit cards.
Post Great Recession, the impacts of the deliberate consumer are being felt unevenly by downtowns depending on the degree to which their businesses and fee charging nonprofits rely on middle-income patronage. Those with lots of affluent households living in and near the district as well as strong tourist traffic, such as Midtown Manhattan and Chicago’s Miracle Mile, are least likely to be significantly impacted. Affluent suburban downtowns, such as Greenwich CT and Wellesley MA, are also unlikely to be significantly impacted.
Similarly, in large cities, the impact of the deliberate consumer on many large low-income shopping areas, where retailers and other businesses succeed because the population density allows sufficient aggregation of low household expenditures, has been comparatively small: they have few middle income users and their low-income shoppers always have far fewer discretionary dollars to spend or lose. However, several “ethnic downtowns” I’ve visited in medium+ sized cities have been improving in recent years by attracting more of the middle income shoppers living and working in their trade areas. They are being impacted by deliberate consumers.
Bottom line: Most of our nation’s downtowns rely on middle-income shoppers. In the new normal, these shoppers are behaving as deliberate consumers. The Great Recession did not create the deliberate consumers – their household income stagnation started a decade before –though it certainly worsened their level of economic stress. For many downtowns, the emergence of the deliberate consumer:
- Provides a constraint on economic growth
- Impacts on the types of retailers and service businesses that can succeed and be attracted to their districts.
2. New Dynamics in Retail Markets. A recent article from McKinsey aptly characterizes today’s retail:
“The North American retail landscape looks quite different today than it did even ten years ago….. Some predict that retail will change more in the next five years than it has over the past century and that the extinction of brick-and-mortar stores isn’t far off. Our view is less dramatic, but we do believe that big changes are inevitable and that retailers must act now to win in the long term.” (21)
Retailers are being hit by subpar economic conditions and the deliberate consumer. Again from the McKinsey article:
“Economic indicators do not paint a rosy picture for retailers: budget deficits are mounting, unemployment remains high, and the average consumer’s balance sheet—while improving—remains shaky, for it has taken more than five years to recover the $16 trillion in net worth US consumers lost from peak to trough in the recent recession.”
The other powerful factor that continues to impact on the character of retail operations is the Internet. As of June 20013, online sales only accounted for 5.8% of all retail sales, but McKinsey estimates that it will rise to 15% by 2025, with few experts doubting that it will continue to grow significantly beyond that date (22). Additionally, a 2009 report from McKinsey estimated that by 2011 the Internet would play some role in about 45% of all retail purchases (23). The Internet is influencing both how brick and mortar retail space is being utilized and how much space is needed. Increasingly, successful retailers – large and small — have adopted a multi-channel approach that integrates e-commerce capabilities with the operations of their brick and mortar stores.
Lower Growth Rate. Industry forecasts indicate that the compound annual growth rate for retail sales over the next five years will be only about 3% to 4% instead of the 5% to 7% experienced in the decade before the recession and just a bit better than the 2.4% of the 2007-2012 period. Furthermore, these limited growth opportunities are most likely to be found by tapping the Boomer, Millennial and Hispanic market segments (24).
Show me the money: I strongly believe that stronger retail growth rates will not return until the income stagnation of middle class households is eroded. Periodic expenditure surges may occur as their consumer credit is used and repaid, but not long-term higher growth.
Significantly Reduced Demand for Retail Space. Together, the deliberate consumer, the growing power of e-commerce and slowed retail sales growth are having some profound effects on the retail industry. For example:
- Retail chains have closed many stores (e.g., 4,500 just in “post-recession” 2012) and now look for fewer locations that average about 25% less space than their existing stores (25)
- Many use the resulting cost savings gained from fewer stores and smaller formats to pay for improvements in their own e-commerce capabilities, while several big box chains are developing the smaller formats to ease entry into tight urban contexts
- Nationally, the amount of retail space decreased by 259 million SF between 2001 and 2011 and is expected to drop by another 210 million SF by 2016 (26). The number of real estate experts who recognize that the nation has far too much retail space has grown substantially
- Today, only about one-third of the 1,300+ malls in the U.S. are high-growth, investment-grade properties; another one third are in deep trouble and prone to either closing or being re-purposed. (27) The successful malls are increasingly taking on the look and functions of successful downtowns and adding many non-retail functions.
Downtowns That Want Strong Retail Will Need to Work Hard to Get It and Keep It. Overall, downtowns consequently face a future in which having a robust retail sector is certainly possible, but it has become much more challenging to achieve and maintain than it was in the 15 years prior to the Great Recession. Most downtowns that want their retail to be strong will have to work harder and more proactively than they have in decades to get it. However, there is significant variation in the degree to which downtowns will feel their retail challenged as well as in the ways the challenges are manifested. For example:
- Most importantly, retail chains have themselves become more deliberate and cautious, avoiding consideration of locations that are not proven and deemed high risk. Looking for fewer and smaller locations, they have become much more selective. That means, for example, most downtowns that have not established themselves favorably with GAFO retail chain site selectors effectively have been further downgraded as possible retail locations. For them, having a cluster of robust GAFO retail shops will depend on attracting and/or growing attractive independent small retailers. However, they probably still have the ability to attract convenience-type retail and food related chains. Furthermore, there are some downtowns that have successfully lured retail chains, but their stores have underperformed compared to others in their chain. They, too, face a downgraded potential for attracting new retail chains
- Retail in large, “big league,” downtowns that have affluent residents living in and near the district as well as lots of tourism and a high daytime population continue to do well as reflected in asking retail rents that can reach $3,500 PSF (28)
- The suburbs are saturated with retail; growth opportunities are shifting to dense urban areas and possibly some ex-urban areas. However, here again, downtown retail in affluent suburban communities remains stronger than in neighboring middle-income downtowns, and they continue to be favored by retail site locators
- In many medium and large downtowns, small independent merchants are disappearing, sometimes at alarming rates, because of unaffordable high rents, reduced consumer demand and strong e-commerce competition. For example, the average sought retail rent in Manhattan in the Spring of 2012 was $116 PSF. (29) That means for a small merchant to afford renting a 2,000 SF store, the operation would need annual sales of roughly $1.9 million to $2.9 million per year. In a thriving NJ suburban downtown, where retail rents are about $50 PSF, a merchant would need annual sales between $0.833 million and $1.25 million to afford renting that 2,000 SF shop. Such sales numbers require an operator with exceptional core merchant skills and strong financials, a treasured find in any downtown
- In many medium-sized downtowns, GAFO retailers were among the hardest hit by the recession, the deliberate consumer and e-commerce. The potential for this type of retailing to return increases with improvements in the downtown’s regional economy, especially its housing sector
- Many downtowns continue to report that when storefront vacancies are filled, the likely new tenants are personal and professional service operations, not retailers. However, many downtowns have benefited from such “pamper niches” – many others might be wise to follow their example (30)
- Downtown food related operations (e.g. groceries and restaurants) and personal services have been comparatively strong from 2007 through 2012. In many downtowns, they provide the spine for the district’s revitalization. Nevertheless, their importance is too often underestimated and far too little attention is paid by retailers to leveraging the customer traffic they draw to the district.
Under the new normal, many downtown organizations, especially those whose trade area customer bases are dominated by middle income households filled with deliberate consumers, will need to take a new, in-depth look at their current retail and its market-driven prospects for growth. They then will need to formulate a strategy to achieve that growth. Some may conclude that the strong presence of the Boomer, Millennial and Hispanic market segments or the power of their strong existing niches (e.g., entertainment, wedding, home and hearth, etc.) is sufficient not only for growth by meeting unmet demand, but also for winning market share from competitors. Other downtown organizations may conclude that while growth in neighborhood/convenience type retail remains viable, their GAFO growth potential has significantly eroded or can probably only be achieved by relying on the attraction of small independent operators. Many, especially in small districts, may decide to focus on neighborhood/convenience type retail. Still other downtown organizations may decide to make retail growth a lower priority and to focus instead on leveraging other strong downtown assets such as their entertainment and pamper niches.
The new retail assessment that many downtown organizations need to undertake can benefit from a “right fit” approach that includes:
- Getting a good handle on the types of retail functions, e.g., niches, they can attract given the emergence of the deliberate consumer, the impact of the Internet, the altered pattern in retail chain site location decision-making and the downtown’s ability to attract or grow quality small retailers
- Having a workable estimate of how much market-supported retail space (in SF) each of these retail functions can provide
- Identifying the stock of probably available retail spaces and assessing their ability to compete
- Matching the market-driven demand for retail space with the downtown’s stock of probably available commercial spaces to determine such things as which spaces are strongly competitive and those that need to be improved or converted to non-retail uses, as well as how much new space should be developed.
Perhaps, more than ever before, as the interest of GAFO retail chains in many communities recedes, downtowns will need to attract or nurture quality small merchants if they want to have a strong group of attractive retail shops. However, this cannot be easily accomplished. Successful small merchants need appropriate skills (including the ability to use the Internet), sufficient capital, affordable rents and viable locations. Today, most downtown small retailer recruitment is like throwing a bowl of spaghetti against the wall and being lucky if a few pieces stick. Most downtown recruitment programs rush to find and are proud to sign new small retailers. Too few recruitment programs vet them to assess whether they will require assistance; fewer still then can link those “indies” that need assistance to appropriate technical assistance providers. Understandably, these are complicated and resource-eating tasks and difficult for downtown organizations with budgets under $500,000 to undertake. Nonetheless, something like this will need to be done in numerous downtowns if they are to have any meaningful amount of quality GAFO retailing. Consequently, many downtown organizations may need to start thinking about expanding the range of functions that are included in their understanding of their district management mission.
While discussions about the technical assistance needed by a downtown’s small retailers often centers on finances, in today’s world their need for technical assistance that can help them gain an effective Internet presence is growing rapidly with each passing day. In many downtowns, the Internet capabilities of their small merchants will determine the attractiveness, strength and viability of the district’s retailing. If the downtown organization does not provide or facilitate the needed technical assistance, then who will? Here again, the costs in staff time and money admittedly can stress the budgets and skill sets of many downtown organizations.
So far, no model program has emerged for overcoming this impasse. Here are a few thoughts about developing one:
- Effective downtown organizations are smart about often getting other organizations to do what the downtown needs. Can they get other organizations to help provide the needed Internet technical assistance?
- Perhaps several downtowns can band together to reduce the costs of developing and operating such a program through the creation of a consortium or the use of an umbrella organization such as a county EDC or the local SBDC
- However, whichever organization is the technical provider, it is essential that its program be correctly designed to avoid problems that have hindered other attempts
- The biggest need for help will probably be with retailers having fewer than five employees
- Many of these merchants have been scared off by overly complex and costly types of e-marketing tools or programs that consultants have offered them. Some merchants have actually tried e-commerce tools and found them ineffective and/or off-putting
- The two basic marketing objectives the small merchants should focus on are a) being found easily on the Internet and b) cultivating existing customers
- Many small merchants can achieve both of these objectives by using relatively inexpensive and easy to use Internet tools (31).
Bottom line: downtowns face a future in which having a robust retail sector is certainly possible, but it has become far more difficult to achieve than it was in the 15 years prior to the Great Recession.
3. Some New Dynamics in Downtown Development. On the positive side, Christopher Leinberger has made a strong case for “walkable urbanism,”, i.e., the creation of urbanized environments ”… in which most daily needs can be met within walking or rail-transit distance of one’s home,” being today’s major development trend.”
Others talk in terms of an overlapping concept, transit-oriented development (TOD), that can be defined as “higher-density mixed-use development within walking distance – or a half mile – of transit stations” (32). Walkable urbanism seems to give more emphasis to walkability while TOD pays more attention to developing around transit stations, but both approaches overlap in stressing the values of pedestrian friendly environments and easy access to transit.
Leinberger also notes that:
“Pent-up demand for this type of development has been proved convincingly during the housing collapse of the past three years (2008-2010 when) most of the housing decline occurred in the overbuilt, automobile-dependent suburban fringe while walkable urban places generally maintained their home values” (33).
A study released in 2013 — commissioned by the American Public Transportation Association and the National Association of Realtors and that was prepared by the Center for Neighborhood Technology — strongly confirmed Leinberger’s observation finding that:
“Across the study regions, the transit shed outperformed the region as a whole by 41.6 percent. In all of the regions the drop in average residential sales prices within the transit shed was smaller than in the region as a whole or the non-transit area. Boston station areas outperformed the region the most (129%), followed by Minneapolis-St. Paul (48%), San Francisco and Phoenix (37%), and Chicago (30%)” (34).
In addition to the benefits of living in more walkable, urbane communities and enjoying “more resilient residential property values,” the study found households living in transit sheds had better access to jobs and lower average transportation costs than the region as a whole” (35).
TOD has been especially of value for many suburban downtowns that have commuter rail stations.
Leinberger also presents an interesting argument that, although it is significantly harder to finance “walkable urbane” projects, they can be very attractive to investors, especially patient equity providers, because:
“…There could be significantly higher cash flows as the project matures. Unlike conventional development where cash flows have been hybridized to be loaded at the front end—the result of lower construction costs for simple commoditized product—it appears that cash flows from walkable places get better over time. Value spirals upward as the critical mass of a walkable place is achieved and enhanced. As more development takes place within walking distance, there are more people on the street and therefore rents and sales prices go up, resulting in land and building values rising, which leads to increased cash flows and so it continues upward as more development is added to the area” (36).
Economic factors combined with changes in the ways tenants want to use their leased spaces have altered the nature and strength of demand for downtown retail spaces, offices and housing units.
Retail. As mentioned above, nationally, there is significantly less demand for retail spaces and much of the current inventory needs to be repurposed. Also, significant changes are appearing in the ways that retail spaces are used because of the Internet, and their full impacts have yet to be manifested. For example:
- There is less need for on-site space to store inventory, especially with large, low turnover items
- There is more need for space for wrapping and shipping e-purchased items, picking up e-purchased merchandise, consumers touching and feeling merchandise
- Sales transactions increasingly are done by self-checkouts or by salespersons throughout the store using smartphones or tablets, e.g., Apple stores, Home Depot, CVS
- Internet searches mean that more retail stores are turned into destinations and such destinations have less need for the most prime locations
Regarding downtown development, these trends now are most visibly playing out in the reduced aspirations for retail growth found in many downtowns and the more frequent resistance to including retail in mixed-use residential projects in suburban downtowns. For example, it is causing some communities, such as Arlington County, VA, to revise zoning laws to allow other uses in addition to retail in ground floor commercial spaces, because so many retail spaces were not being leased (37). I also have either heard developers state or read about developers in CO and CA saying, that they preferred not to include retail in their downtown residential projects because it is so hard to get credit worthy quality tenants and that the revenues from residential use of the ground floor space would be greater and more reliable. Most of the projects of the developers I spoke to would be located in the downtowns of upper middle-income suburban downtowns, where they see signing GAFO retail chains would be costly, time-consuming and increasingly uncertain of success. Recently, I have also seen a mixed use project on a highly trafficked hipster street in Brooklyn in the process of converting ground floor retail spaces into residential units, though I think that ground floor retail in new mixed use projects is generally secure in dense urban locations.
In the types of downtowns where developers are showing resistance to putting ground floor retail in their residential projects, the downtown organization and, most importantly, the municipality’s leaders need to:
- Decide if they really want more retail and not just because they and their voters might like it, but because there is good evidence to suggest that a) there is market support for this additional retail space and b) which kinds of retailers are most likely to be interested in it
- Be prepared to offer developers incentives for embracing retail into their projects. They might include assistance in developing marketing information and collaterals, identifying qualified small merchant tenant prospects and some form of financial incentive, e.g., low cost loan, pilot, TIF, etc.
- Develop a special incentive program to make rents in new mixed-use buildings more affordable to more small merchants.
For some time now, many downtown economic development officials have viewed mixed-use projects as the best way to provide the Class-A, vanilla box retail spaces needed to attract high quality GAFO retail chains. However, under the new normal, a significant number of downtowns may no longer have the potential for recruiting the GAFO retail chains, though there still is significant local market support for this type of retail activity. In such situations, the best path for realizing the GAFO growth potential is through the recruitment of competent small merchants. They, in turn, are unlikely to afford the rents sought for newly constructed retail spaces. In fact, they may not require such vanilla box spaces to succeed. Frequently, they probably would be best served by leasing a storefront in a competitive downtown location that is in good condition and then making such additional improvements deemed advantageous and affordable. Under such a scenario, more downtown housing will still remain highly beneficial for the downtown, but without pedestrian friendly storefronts on the ground floor, a large residential building on the main commercial street can be a pedestrian dead spot. Perhaps, such a residential building then would be best located around the corner and down a side street? In other words, in numerous downtowns, the mixed-use project model may no longer be either viable or optimal.
Offices. Under the new normal, the character of office development also appears to be changing in very significant ways because of the Great Recession and alterations in the ways people work and use office spaces. The demand for space is being reduced by large corporations, forced to cut costs by the Great Recession and then taking a much more rigorous assessment of how much office space they actually need and the rents they pay for it. As a result, they are re-signing leases for or moving into smaller office spaces. Consequently, as a 2011 article in CoStar’s e-newsletter reported, a symposium of office development experts convened by BOMA found that we now “…have roughly all the office space (in aggregate) that we will need” (38). One expert has suggested that the industry should entertain the possibility of a 20% decrease in office space demand, because, given the current trend, that may well be the long-term implication for office building landlords and developers (39).
There is little doubt that, as a result of the new corporate leasing scrutiny, the ratio of leased space per office worker (SF/worker) has dropped significantly – employees are working in smaller offices with reduced spaces for themselves. The question is by how much? The answer is critical to assessing the scale of the downturn in demand. In discussions about it neither the previous ratio that is being used as a reference nor the current ratio are well evidenced. For example, one observer claims that that the ratio at some unspecified time in the last decade was 250 SF/worker and has dropped now to 185 SF/worker (40). It seems more likely that the 250 SF ratio was applicable to big city corporate back office operations (which have long since left our major city centers) back in the years of rapid office growth during the1980s. I believe a 200 SF/worker ratio was the more common yardstick in the 2000s. Furthermore, a 1994 Arthur Anderson report then claimed that the ratio would soon be 175 SF/worker (41). Also, there has long been a difference in space utilization between downtown and suburban locations. Finally, another observer of the current scene noted that some high tech firms in CA had seven workers per 1,000 SF, which translates into an 143 SF/worker ratio (42).
The demand for office space is impacted not only by the growth in the types of jobs that require office space, but in how the office space is used because this will influence on how much space is needed per worker. As one participant at the BOMA symposium argued:
“But to remain competitive, the existing stock of commercial real estate must be reconfigured to keep pace with an increasingly mobile, Internet-connected workforce; ongoing changes in technology, and to support the way companies are structuring their staffs to foster more collaboration and efficiency, while also addressing the values and attitudes of new generations of workers “(43).
Increased telecommuting, flexible work schedules, the untethering of workers from desks to enhance collaboration and increase face-to-face client contacts have combined to increase employee density in major office buildings and reduce the demand for office space. For today’s office worker, according to another of the BOMA symposium experts, the ideal situation may be: “(W)here you go into the office two or three days per week and work remotely the other days, which reduces our carbon footprint by 20% – 40% and has a huge impact on improved quality of life “(44).
Many of these changes in the ways office employees do their work and utilize space have been influenced by patterns developed in high tech firms such as Google and are preferred by the growing number of Millennials and the creative knowledge workers among them.
The potential negative impacts of the new normal’s altered demand for office space on development are:
- Rather than expanding by millions of square feet in the future, experts expect the total office market size in the U.S. to remain approximately at its current size, with significant new construction to replace obsolete buildings. Fewer new downtown office buildings will be built”
- Existing downtown office buildings that are not configured to meet the new work habits of office workers will have languishing leasing efforts. A lot of existing downtown office buildings may have to be renovated if they are to be competitive
- Downtown retailers and eateries will have a significantly reduced office worker market because the telecommuters and flex-timers will spend much less time in the district.
However, there is a potential upside for downtowns that can provide “a dynamic, experience-rich environment,” i.e., strong CSD functions. As the CoStar article notes:
“The lesson for companies (and the investors and building owners who want to have them as tenants) is that younger workers prefer to work in a more dynamic, experience-rich environment, such as an urban- type setting offering different entertainment, cultural and transportation options (45).”
Downtowns with strong CSD functions will consequently continue to have a distinct advantage in a highly competitive office market, while listless downtowns will probably be weaker competitors than ever.
Coworking spaces are an interesting example of how the quantitative and qualitative changes in the ways people work and use office spaces also offer growth paths for downtowns — and not just for the very large ones. These shared spaces help fill the essential needs of entrepreneurs and freelancers to build their professional networks and collaborate with other small businesspeople. These shared spaces average about 6,000SF and provide such features as: desks (“hot” and dedicated), private offices, conference room(s), kitchen, lounge, Wi-Fi Internet connections, 24/7 office access, and equipment for printing, binding, faxing, scanning, photocopying, etc. Very importantly, the spaces are also programmed for: “networking events, collaboration and mentoring, one-on-one assistance, business planning topics, business management topics, B2B, B2C, B2G activities and technical skills training (46). They also can provide connections to such technical assistance providers for small firms as SCORE, SBDCs, local government agencies, local university programs, etc.
The clients for coworking spaces are most likely to be active in occupations associated with Richard Florida’s creative class construct such as: computer and mathematical; life, physical and social science; architecture and engineering; education, training and library; arts, design, entertainment, sports, media; business and financial operations; legal; healthcare practitioners and techs; high-end sales and sales management.
An international survey of coworkers by Deskmag found that, as might be expected, 85% of the coworking spaces are in cities having populations of 100,000+. The large city spaces are near colleges or universities and have other coworker spaces within their market area. The coworker spaces in the smaller communities tend to be smaller, but the desk utilization rates are similar to those of the spaces in larger cities. However, the small city coworkers are older and wealthier than their large city brethren. Also, as might be expected, the spaces in smaller cities draw from a relatively larger area in which there are no other coworker spaces. Coworker spaces apparently do no conflict, but complement with the use of home offices, probably by providing the opportunities for vital business related social interactions that working alone at home cannot: ”Nine out of ten coworkers also work outside their coworking space, regardless of the size of their city. The most popular alternative is still the home office (around 80% for both groups” (47).
DANTH, Inc., in a recent unpublished analysis, reviewed 20 suburban communities in the New York-NJ metro area and concluded that coworker spaces would be most viable towns that are true commercial centers, and they are likely to be county seats.
The Deskmag survey also found another very important difference between the coworkers in small and large communities: “In towns, one in three coworkers reported using coworking spaces to establish or grow a business. In cities, they number only one in ten.” In larger cities, coworkers are more likely to be freelancers and they do report that using the coworker spaces does increase their income. This is important because:
- Coworker spaces may help bolster a community’s or county’s economic well being by helping freelancers get more assignments and increase their household incomes. A 2010 report by Intuit on the 20 trends that will shape the current decade predicted a strong increase in the size of our “contingent workforce” – of which freelancers and individual subcontractors are substantial components – will grow from about 25% to 30% of the workforce in 2010 to about 40% in 2020. Also, this study reported that 80% of our major corporations plan to substantially increase their use of contingent workers (48). Freelancers have unsteady incomes and no benefits and usually make less annually than someone with a full time position doing comparable work. As a result, the growth in the contingent workforce could have a significant weakening effect on many communities as a significant number of their residents are shifted into the more unstable and lower paying contingent employment. To the degree that coworker spaces can help freelancers get more projects and increase their incomes, they can be a useful tool for ameliorating this situation and thereby helping the community to maintain its economic well-being
- Coworker spaces also may help many communities in the 20,000 to 100,000-population range to generate the jobs they are looking for. Besides their own jobs, freelancers are not job creators – they are self-employed, not employers. However, as is well known within the economic development community, small growing firms are our job creators. Furthermore, as they grow so does their demand for office or industrial spaces. Coworker spaces in these towns attract firms that want to grow and apparently do help many of them to achieve that objective.
Housing. Besides significantly reducing both demand for and the construction of housing, the Great Recession also influenced downtown projects by encouraging a shift in consumer interest from purchased units to rentals. In some parts of the country, this shift had started prior to the recession, but the strong downturn really deepened and widened the scope of this trend. Some housing experts expect it to diminish when the economy recovers; others see it as being with us for a very long time as our housing market increasingly looks like those found in Western Europe (49).
Housing in and very near to many of our downtowns is now for the affluent and financially comfortable. For example, in September of 2013, the average rent for an apartment in Manhattan was estimated at $3,862/mo; the median rent was $3,087 (50). To not be “rent burdened,” i.e., not have to spend more than 30% for the median rent, a household would need an annual income of $123,480. Googling “high downtown rents” brings up many webpages about high downtown rents and condo/coop prices in many of our larger cities. My field observations suggest that the same trend, if not to the same financial heights, is present in many of our medium-sized cities and suburban communities. While the presence of the affluent and financially comfortable is a strong asset for any downtown, the associated high cost of housing means that affordable housing has become an issue, not just for the poor, but also for the middle-income household members who are often skilled and essential workers for downtown businesses.
On the positive side, this has lead to the diversion of middle-income demand to neighborhoods that were formerly decayed and housing lower income residents and the revitalization of those neighborhoods. Some have the housing stock that makes their rehabilitation understandable, while others do not. All, however, have comparatively short commutes to the CBD that are often facilitated by easy access to a robust public transit system.
One result in both the downtown and the desirable close-in neighborhoods is the repurposing of underutilized schools, churches, office buildings, etc. for residential uses. Indeed, a recent report by the CoStar Group claims that: “more than half of office space removed from inventory returns to the market as residential” (51).
Another response to this situation, especially in cities such as Atlanta, Cincinnati, Denver, Pittsburgh, Seattle, St. Louis and Washington D.C., where the share of single person households exceeds 40%, may be the development of mini apartments that have about 350 SF. The mini apartments are not unusual in Tokyo and many European cities, and they have recently appeared in such American cities as Boston, Chicago, New York, Providence and San Francisco (52).
The popularity of downtown housing is also creating a challenge that takes form in lots of tourist residential owners who are only present for small portions of the year, even during the local tourists season, if there is one. In one Florida downtown I visited, most of the units in the district’s large residential buildings I walked by were dark. Local economic development officials lamented that this was the normal situation and one that they very much wanted to change.
UP NEXT: My next article in this series will be on the challenges facing downtown entertainment niches.
Endnotes
19.See: https://www.ndavidmilder.com/downtown-revitalization/the-deliberate-consumer
20.Elizabeth Warren and Amelia Warren Tyagi. The two income trap: Why middle-class parents are going broke. Basic Books, 2004.
21.Ian MacKenzie, Chris Meyer, and Steve Noble, “How retailers can keep up with consumers,” Insights & Publications, McKinsey & Company, October 2013 http://www.mckinsey.com/insights/consumer_and_retail/how_retailers_can_keep_up_with_consumers
22.See http://www.census.gov/retail/mrts/www/data/pdf/ec_current.pdf for current e-commerce stats
23.Steve Noble, Amy Guggenheim Shenkan, Christiana Shi, “The promise of multichannel retailing,” McKinsey Quarterly, October 2009.
24. See endnote 21. Two of these market segments are not new: the Boomers have been impacting retail for decades and DANTH was dealing with very large Hispanic markets back in the 1990s in the Bronx, West New York NJ and Elizabeth NJ. Back in the 1980s and 1990s.
25. See endnote 21
26.Cited in: https://www.ndavidmilder.com/2012/10/the-new-normal-requires-more-dynamically-managed-downtown-organizations.
27.See endnote 26
28. Stephanie Clifford, “Street’s Sunny Side Costs Retailers More in Rent” New York Times, September 24, 2013 ttp://www.nytimes.com/2013/09/25/realestate/commercial/streets-sunny-side-costs-retailers-more-in-rent.html
29. N. David Milder, “Nail, Hair and Skin Salons: Bane or Boon?” Downtown Idea Exchange. October 2005
30.See endnote 28
31. N. David Milder. E-Marketing: How EDOs Can Help Independent Downtown Merchants Engage Effectively in E-Marketing. Economic Development Journal (IEDC), Summer 2013, pp. 34-40.
32. See, for example, Center for Neighborhood Technologies, “Center for Transit-Oriented Development,” http://www.cnt.org/tcd/projects/ctod/
33. Christopher Leinberger, “A Model for Growth: Walkable Urbanism,” Urban Land, September/October, 2010, http://www.urbanland.uli.org/Articles/2010/SeptOct/Leinberger
34. Center for Neighborhood Technologies, “The New Real Estate Mantra: Location Near Public Transportation,” March 2013, http://www.cnt.org/resources/the-new-real-estate-mantra/
35. See endnote 34
36. Christopher B. Leinberger, “Financing Walkable Urbane Projects,” Urban Land, January 2007 http://www.chrisleinberger.com/docs/By_CL/Financing_Walkability_0107.pdf
37. Rebecca Cooper, “Arlington looks to ease up on retail rules,” Washington Business Journal, Sep 26, 2013, http://www.bizjournals.com/washington/blog/top-shelf/2013/09/arlington-looks-to-ease-up-on-retail.html?ana=RSS&s=article_search&page=all
38. Tim Trainor, “Do We Need Any More Office Space? Experts examine far-reaching impact from changing demographics and ever-pervasive technology on the workplace of the future.” CoStar Group. http://www.costar.com/News/Article/Will-We-Need-Any-More-Office-Space-/134483?ref=100&iid=261&cid=DC6077B43E67ACADB224FF6D0AF89AB6; I have taken much of this section from what I wrote in 2012: N. David Milder, “Office Development — We now have all the office space we need,” https://www.ndavidmilder.com/2012/01/office-development-we-now-have-all-the-office-space-we-need.html
39. Mark Heschmeyer, “Changing Office Trends Hold Major Implications for Future Office Demand: pioneered by tech firms in California, communal workspace model becoming more mainstream among big office firms.” CoStar Group. March 13, 2013. http://www.costar.com/News/Article/Changing-Office-Trends-Hold-Major-Implications-for-Future-Office-Demand/146580
40. See endnote 39
41. Arthur Anderson. “Draft Report: City of White Plains Comprehensive Plan, Economic Futures: The Alternatives.” 1994 – p.4
42. See endnote 39
43. See endnote 38
44. See endnote 38
45. See endnote 38
46. Place Dynamics, “Igniting an Idea:THE CREATIVE SPARK,” www.placedynamics.com, p.12. This is one of the best sources on this topic and I thank Mike Stumpf for so graciously sharing it with me.
47. “Coworking in Big Cities vs. Small Towns,” Deskmag, January 17, 2011 http://www.deskmag.com/en/big-city-vs-small-town-coworking-182
48. Intuit, “Intuit 2020 Report?:Twenty Trends That Will Shape The Next Decade” October 2010, http://http-download.intuit.com/http.intuit/CMO/intuit/futureofsmallbusiness/intuit_2020_report.pdf
49. Stacy Proebstle December 30, 2011 More NJ Families Will Rent Instead Of Own,” (Audio), http://nj1015.com/more-nj-families-will-rent-instead-of-own-audio/
50. See: http://www.elliman.com/pdf/57c5541a5c29aef8d1914567e1af02b593b23069
51. Randyl Drummer; Developers Increasingly Find It Can Pay To Convert Office Buildings Into Apartments and Condos: More than Half of Office Space Removed from Inventory Returns To the Market as Residential, October 29, 2013, CoStar Group Newsletter, http://www.costar.com/News/Article/Developers-Increasingly-Find-It-Can-Pay-To-Convert-Office-Buildings-Into-Apartments-and-Condos/153853?ref=100&iid=361&cid=DC6077B43E67ACADB224FF6D0AF89AB6
52. Wendy Koch, “Mini-apartments are the next big thing in U.S. cities,” USA TODAY, August 1, 2013. http://www.usatoday.com/story/news/nation/2013/07/30/tiny-apartments-apodments-catch-on-us-cities/2580179/