By N. David Milder
Introduction
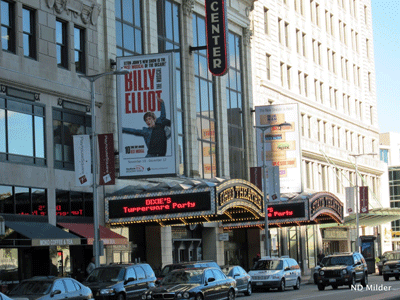
The importance of downtown movie theaters. One of the most distinguishing characteristics of the “new normal” for our downtowns is the importance of having strong Central Social District (CSD) functions. Dynamic downtown entertainment niches contribute mightily to having a strong CSD. Movie theaters will play important roles in many of these entertainment niches, often serving as niche cornerstones in many smaller and medium-sized communities. Movie theaters usually differ from other downtown formal entertainment venues, such as theatres, concert halls and PACs, in some critical respects:
- They show films during the daytime as well as evenings almost every day of the year – though this is less likely in very small communities
- Their admission fees are relatively low and affordable – averaging $8.13 in the US and Canada in 2013 (1)
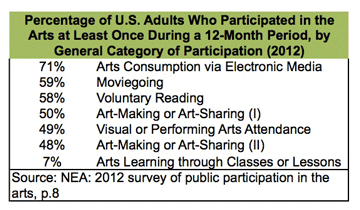
- They are very likely to have a larger potential audience than the other formal performing arts venues: about two thirds of the US/Canadian population aged 2+ went to the movies at least once in 2013. This dwarfs attendance at other formal performing arts venues, theme parks and MLB, NFL, NBA and NHL games (2). For example, only about 49% of adult Americans attended a performing arts events (plays, operas, concerts) or visited visual arts venues ,e.g., museums, art galleries in 2012 (3)
- They appeal to minority groups: for example, Hispanics represented about 17% of the population in 2013, yet accounted for 25% of the movie tickets sold that year and their attendance is growing (4)
- More downtowns are likely to have a movie theater than a “legit” theatre, concert hall or PAC. In smaller communities they are often “…built right into the fabric of the main street, and they pretty much serve as the anchors. If those buildings were shuttered or torn down, it would affect the look and feel of the downtown area” (5).
Because of their long operating hours and ability to win an audience that is socioeconomically and ethnically diverse, movie theaters not only bring a lot people downtown through most of the day, but also stimulate their patrons to take a psychological stake in the downtown and make it their downtown.
Downtown movie theaters have long been under threat. Downtown movie theaters can be very important assets, but they have long been subject to forces pressing for their closures. When some of these forces wane, others seem to rise to take their place.
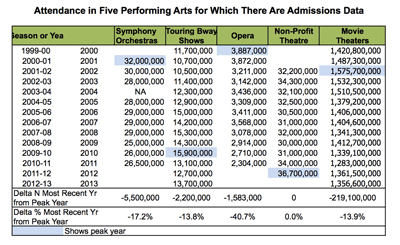
Back in the 1940s, 60% of Americans went to the movies every week. That level of attendance fell dramatically when TVs became a staple in every home during the 1950s (6). That, combined with the flight to the suburbs, led to the closure or repurposing of many downtown theaters. Nationally, though individuals went to the movies less frequently, through the 1980s and 1990s movie attendance continued to increase because of population growth until 2003 when a pattern of decline set in. By the end of 2013, attendance had fallen 13.9% from the 2002 peak. (7)
Within the movie theater industry there has long been a preference for theaters with more screens. This has led to a pattern of increasing screens, a steady decline in the number of movie theaters and larger cinemas with more screens. For example, between 2000 and 2012, the number of indoor movie theaters decreased by 18.8%, while the number of screens increased by 9.4% (8). However, this pattern was uneven. Some downtowns, usually the larger ones with some significant revitalization success stories, saw large new multiplexes open, while many others saw their 1-5 screen theaters close. The smaller theaters, with fewer screens were increasingly marginal. Even more marginal have been the smaller, few screen theaters in low population market areas.
In 2008, a DANTH, Inc. research paper summarized the challenges then facing downtown movie theaters:
- Their hold on adult audiences was small and diminishing. Attendance was down and a Pew Research Center survey found that by a 5 to 1 ratio, Americans watch more movies on their TVs and electronic devices than in a movie theater
- Even the most frequent moviegoers, a group whose behaviors are critical to the industry’s success, preferred home viewing
- Many theaters had low operating margins based primarily on revenues from concession stands and screen ads
- A relatively modest reduction in paid attendance by a small group of frequent moviegoers could easily erase these meager margins. The frequent moviegoers did not have to completely stop visiting movies theaters for the impact to be devastating. This was an important point.
- The frequent movie-goers had demographic characteristics that highly correlated with the use of computers and other electronic home entertainment equipment. Such equipment could greatly facilitate a shift in their movie viewing from theaters to home and mobile distribution channels
- Many theaters lacked amenities such as many screens, large screens, first run films, stadium seating, clean restrooms and clean theaters floors
- US theaters provided a very small revenue stream for the major movie studios, e.g., an estimated 13% of their total revenues in 2003 (9). Consequently, the studios are incentivized to make decisions that will help other film distribution channels that are more profitable although this may hurt the theaters (10).
Our 2014 Deep Dive DANTH’s most recent assessment of the challenges and opportunities that downtown movie theaters now face shows that they now are probably stronger than in 2008, but still have to face significant uncertainties about both threats and opportunities.  The good news: the shift to digital projection and distribution is done and very probably left a stronger group of movie theaters. The recent studio forced conversion to digital distribution and projection reportedly was going to cause a large number of closings among the smaller and financially vulnerable cinemas with fewer screens. For example, the National Association of Theatre Owners (NATO) estimated that as many as 20% of all cinemas in North America – about 1,000 — would be forced to close by the digital conversion (11). We could not find any reliable data on how many were actually forced to close by the end of 2013, though such information may become available later in 2014. NATO’s most recent data show a decrease of only 244 indoor cinemas from 2009 through 2012. However, the Motion Picture Association of America (MPAA) data in the above table show that there were still 2,981 analog screens, in an unknown number of cinemas, in 2013. If they did not convert to digital, then they would be very prone to being left out of the film distribution network and, if they have not failed, they have become even weaker. However, we have come across several reports of these small non-digital theaters still hanging on by still being able to get access to some new studio analog films, reducing their schedules and supplementing their revenues by on -stage events.
More encouraging are the unknown number of smaller, vulnerable theaters that have been saved in recent years by local communities organizing to own and/or operate them or help raise the funds needed by operators to bring them across the “digital divide.” We have come across reports of local communities organizing to save small cinemas in ND, NY, and ME. For example, of the 31 operating historic theaters in North Dakota identified by one researcher, 19 are community-run (12). In NY, the Adirondack Film Society and the Adirondack North Country Association (ANCA) created a Go Digital Or Go Dark program that won state grants and used the Razoo online crowdfunding service to raise matching funds from local residents (13). The funds raised by this program have been used to help six movie theaters in the region go digital: two have completed the conversion; four are still in the process of making the conversion, either still fundraising or awaiting the installation of the digital equipment. Three other theaters that the program initially contacted found other ways to fund their digital conversions. Only one theater has not been able to cross the digital divide; it was physically too small to accommodate the digital equipment. The owner now is looking for a new and larger location in the community for the theater (14). While the Go Digital Or Go Dark program has been very impressive in helping to raise the funds needed by many of its region’s theaters to go digital, it is probably prudent to consider it still as a work in progress until the four “in process” theaters actually complete their digital conversions. At that time it will be easier to measure its degree of success and to get a good handle on its potential transferability to other communities. Nevertheless, the proactive actions of these communities in North Dakota and the Adirondacks do demonstrate that if communities want their cinemas to be saved, their active involvement can be an important part in making that happen.
Also, we have found a few instances – in suburban and urban districts — where new theater operators, with capital and industry know-how, have been recruited by savvy landlords to upgrade troubled movie theaters – e.g., the Cedar Lane Cinemas in Teaneck, NJ (15).
Internet fundraising is an important tool that some small movie theater operators can use on their own. For example, in Westport, an entertainment district in Kansas City, MO, the owner of Tivoli Cinemas (the oldest movie theater in the city) used Kickstarter to raise $136,393 from 1,386 backers. The funds raised are to be used to make the digital conversion as well as physical improvements to the theater (16).
The downtown movie theaters that remain open today are probably stronger than their peers were five years ago because:
- The fittest have survived and the really weak theaters and operators have largely been squeezed out by the financial pressures induced by the digital conversion.
- Digital conversion helps theaters provide patrons with higher quality viewing experiences, an important element of making going to the movies a special occasion
- There are interesting tools that communities now have successfully used to help save their movie theaters and that other communities might adopt or learn from. Indeed, for smaller communities that are often financially challenged, the organizational and fund raising tools used to save the movie theaters might also be effectively used to achieve other downtown revitalization objectives.
Even after the conversion to digital screens, the health of US movie theaters is mainly contingent upon the their ability to indirectly generate revenues for the movie studios. American movie studios have become increasingly focused on their international box office, because it has become much larger than the domestic box office: 70% of their film box office revenues now come from outside the US. Also, while US box office revenues only increased by 3% between 2009 and 2013 to $10.9 billion, the international box office grew by 33% to $25 billion (17). Today, most of the studios’ blockbusters earn at least two-thirds of their box office revenues in foreign markets and some producers are tailoring their films to the tastes of foreign fans” (18). It remains to be seen:
- If the need for films to meet both American and international tastes can be accomplished without losing a significant portion of the current American audience
- Or if the greater revenue potentials of international blockbusters substantially diminishes the production of “independent” films, such as the highly acclaimed Moonrise Kingdom, that only earned about one-third of its gross take in the international market and that targets an audience that has less interest in big action films, especially those based on comic books.
In addition, domestic movie theaters only account for a small portion of the movie studios’ domestic revenues: about 36% in 2010 according to one analyst (19). Most of their domestic revenues come from DVD sales, pay for view TV, online movie streaming, electronic games, amusement parks, franchises and licenses, etc. In recent years, DVD sales have nose-dived while increased revenues from movie downloads and streaming have not filled the gap.
Today, the importance of the movie theaters to the movie studios is not so much the dollars they bring in directly as the fact that they are the major marketing platform for generating studio revenues in the more profitable ancillary distribution channels! Domestic theater operators would be in a severely jeopardous situation should the studios find a more cost effective marketing platform for reaching their ancillary markets.
Persistent clashes between the studios and theater operators have occurred over when films are to be released into these ancillary distribution channels. Lately, the pressure for a shorter theatrical window has grown, because important movies now open in about 4,300 theaters versus about 2,000 twenty years ago and about 90% of theatrical revenue comes within the first four weeks of a film’s run (20). Distributing films earlier through the ancillary channels may not significantly hurt the revenues of first run theaters – though their operators still will fight it. However, the smaller and weaker second and third run cinemas that get the films weeks later– those that are likely to be in smaller market areas and smaller commercial districts – probably would not fare as well.
Where studios and theater operators agree: squeeze more dollars from each movie visit. Both movie studios and movie theater operators have decided that if US attendance is diminishing, then the best strategy for increasing revenues is to capture more dollars from every customer that walks through a movie theater’s doors:
- For over a decade, the price of general admission tickets has steadily increased. In the 10 years between 2003 and 2012, ticket prices increased by 38%. In comparison the CPI increased by 25%, while, more importantly, median household incomes rose by only 17% (21). This means that ticket prices increased while the incomes of American households was not even keeping pace with inflation.
- There has been a real push to have more films that can be shown on 3-D, IMAX and IMAX-like (e.g., in Cinemark theaters) projection systems. They command higher admission fees. Also, many industry leaders see these types of films as the best way to compete with watching movies at home or on mobile devices because of their ability to provide larger and more immersive viewing experiences. By 2013, about 36% of all movie screens in the US had digital 3-D projection capability, up from 8% in 2009 (22).
- However, the popularity of regular 3-D movies is now in question. Several observers foresee them losing out to the large format films — about 75% them are also in 3-D (23). Smaller theaters often can accommodate 3-D projection systems and many do today after the digital conversion. However, one wonders how many could fit the large format screens into their buildings. On the other hand, one also has to wonder if smaller theaters in less densely populated areas and far from other and larger theaters, would really have to compete in this way. They had to go digital in order to stay in the distribution system, not so much because their competitors were digital. It seems doubtful that the studios similarly would force them to adopt the large screen format by refusing to distribute a lot of important films in regular digital format
- For many years now, theater operators have been trying to provide a more pleasurable and unique experience for moviegoers. Stadium seating and Dolby sound systems are widespread. Some theaters have become dinner cinemas, where they serve viewers meals. The large AMC chain is among them. Theaters in some smaller communities also have successfully used the dinner cinema format. For example, the Gilson Cafe & Cinema in Winsted, CT, has been around for over 25 years (24). However, the large chains experimenting with this format is new. It remains to be seen if dinner cinemas will become more widespread
- AMC is also experimenting with seating in 25 of its locations by providing each patron, for an increased ticket fee, with “ a person-and-a-half-wide, motorized, reclining, La-Z-Boy-style chair, upholstered in a glossy red leatherlike material” (25). These large recliners reduced the seating capacity in these theaters by 64%, yet attendance reportedly increased by 84% (26). Here, again, it remains to be seen if this type of seating will achieve greater adoption.
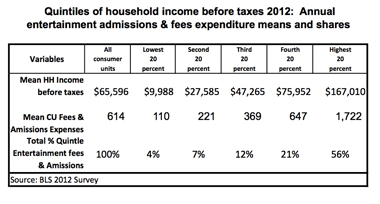
 Will movie theater attendance continue to decline? Given that our current economy means middle-income households are suffering from stagnant incomes and filled with deliberate consumers, movie ticket price increases may have deterred moviegoing – especially among middle and lower middle-income households and those with children. As was detailed in an earlier article in this series on the markets of formal preforming arts venues, fewer discretionary dollars have been a major factor in lowering attendance at those venues. A few dollars increase in movie admission prices may not seem like much to those in the top two household income quintiles or to a young creative type or a teenager. However, for those with more modest incomes or a household with children, the same price increase can be much more meaningful, especially when combined with costly purchases from the concession stand. While households with children now represent just 32% of all households, they are still one third of the movie theater market. Continued ticket price increases that are substantially above rises in middle-income household spending power – not just the CPI– would be a growing threat to movie theater attendance. In some market areas, these increases could push the size of the movie audience down towards the much smaller audience sizes of the formal performing arts venues.
DANTH’s 2008 research report on downtown movies concluded that the then biggest threat to movie attendance would arise if frequent movie goers diverted more of their movie viewing from movie theaters to their home TVs and mobile devices. Since frequent moviegoers were also the highest users of mobile devices and technology products, the potential for such a diversion seemed to warrant significant concern. The MPAA’s 2013 market report indicates that not much has changed in this regard:
“Frequent moviegoers tend to own more key technology products than the general population (adults 18+). Nearly three-quarters of all frequent moviegoers (74%) own at least four different types of key technology products, compared to 51% of the total adult population” (27).
While viewing diverted to high tech ancillary channels may well substantially decrease theater attendance, it is doubtful that it would approach anywhere near a major collapse. The earlier impact TV had on attendance showed that while there was a very significant decline, Americans still liked going to the movies. Something comparable in scale may happen with the impact of the high tech gadgets and online services. Furthermore, the high tech based immersive viewing and sound experiences provided by 3-D and especially IMAX are quite popular with those who are high users of tablets, smartphones, laptops, AppleTVs, Netflix, etc., and they fit well into a high tech entertainment culture. Whether or not there will be a tech-induced attendance decline and what its magnitude might be remain unknown, but the digital-induced audience diversion must still be considered a substantial potential threat.
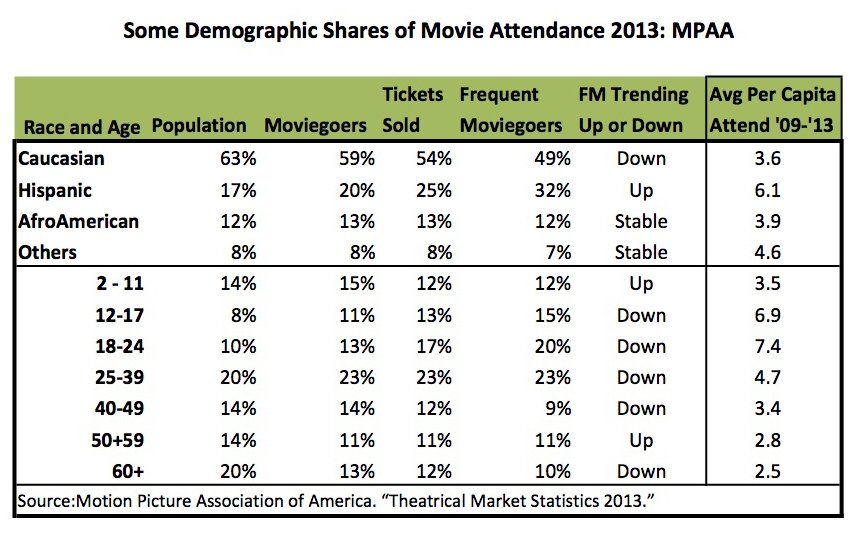
Some interesting changes have emerged in the demographics of the movie audience and frequent moviegoers. Caucasians are still the largest racial group among moviegoers, 59%, tickets bought, 54% and frequent moviegoers, 49%, but these percentages are below their population share, 63%. Moreover, the trend over the 2009-2013 period was for the Caucasian shares to decline across the three movie audience variables. In contrast is the Hispanic-Latino audience that now accounts for 32% of the frequent moviegoers, 25% of all tickets sold and 20% of all moviegoers, although they now comprise just 17% of the national population. Afro-Americans and other racial groups have been holding rather steady in their shares of the movie audience variables. Movie studios may well want to take this demographic composition of their domestic audience into consideration when they decide which films to green light for production and distribution.
Perhaps the most interesting column in the above table is the one on the extreme right that shows average per capita movie attendance between 2009 and 2013 for each of the demographic categories in the table. For downtown theater operators, the per capita data can be quite useful for generating meaningful estimates of what their total annual attendance will be as well as who in their trade area will be accounting for most of the tickets sold. It also should be noted that:
- Among the racial groups, Caucasians have the lowest per capita attendance, 3.6 times a year, while the Hispanics’ rate is 69% higher at 6.1 movie visits per year. This may impact on where movie theater operators will want to locate their new cinemas as well as the revenues of existing theaters
- The 12 – 24 age groups still have, as they have long had, the highest per capita attendance rates. Regardless of the fuss some commentators have recently made about increased attendance in the 2 -11 and 50-59 age groups, those cohorts still lag woefully behind the teenager/young adult crowd who will nevertheless command the primary attention of studio execs and theater owners (28). However, the Hispanic market is about the same size and strength and may viably compete for comparable studio and theater operator attention
- As is well known, the Hispanic segment of the US population is growing rapidly. With the Hispanic high attendance rate, could this growth bring about an equal growth in moviegoing – and one that might actually result in a structural net increase in movie attendance?
The growing importance of making moviegoing a special event. In recent years, a number of famous and well-regarded Hollywood filmmakers, such as James Cameron and Jeffrey Katzenberg, have come out strongly in favor of 3-D and IMAX movie formats. They have done so, because they realize that the future of moviegoing in the USA is significantly dependent on cinemas being able to provide a differentiated experience that can successfully compete with watching movies on a home TV or mobile devices. They want to make moviegoing again a special event. The efforts of the movie theater operators to bring dining into the movie-going experience, to provide not only improved stadium-type seating, but large plush seating, and to make 3-D and IMAX viewing a more everyday viewing experience also have the same objective. Many savvy real estate developers also have signed on, such as Rick Caruso, who made access to a major restaurant a key design component of a large multiplex in The Grove in L.A.
Visits around the country have demonstrated the importance of easy access to food and drink as a means of differentiating and enhancing the moviegoing experience and consequently contributing to successful small movie house operations. These food and drink operations are not four or five star eateries. Nor are they pricey. Some may specialize, e.g., a pizzeria, an ice cream parlor, a sausage house or a brewpub. Affordable places, especially those that appeal to kids and families, can play strong support roles for adjacent or very nearby cinemas. They do not have to in the theater building, but having them there can strengthen the theater financially by providing an additional revenue stream.

Cinemart Theater, its restaurant’s outdoor dining, with Eddie’s in background
One example that we know quite well is the Cinemart in nearby Forest Hills, NY. It has been in operation at least since 1949. It now is basically a second run theater. About 10 years ago it opened a casual and affordable restaurant in its building, with outdoor seating when weather permits, that can be enjoyed by moviegoers, but also attracts many other customers. The eatery both broadens the potential moviegoing experience while providing the theater operator with another source of revenue. Within 150 feet of the Cinemart is Eddie’s Sweet Shop, a 100+ year old and very popular ice cream parlor. On weekends and in the weekday evenings one can observe platoons of patrons entering Eddie’s after each movie ends.
Our field observations in recent years also suggest that a healthy, well-activated, energetic commercial district offering visitors a variety of interesting and affordable things to do can help warrant a visit to a movie theater located in it because the experience would be sufficiently special and different from home or mobile device film watching.
Unfortunately, there is a potential conflict between the need to keep the moviegoing experience affordable and the need to make that experience special, since the latter is likely to involve more expensive tickets and/or add-on costs associated with food and drink or other “special” items. Such conflicts are least likely to occur in wealthy residential areas – e.g., those where households in the top income quintile reside – since for those residents the incremental costs associated with enjoying a special event excursion to a cinema would be relatively negligible. This conflict is more likely to emerge in residential areas where household incomes are in the middle and lower middle ranges.
Implications for Downtowns
District organizations in small and medium-sized downtowns as well as in urban neighborhood commercial centers should recognize that even though their movie theaters have successfully transited the digital divide, their futures are sufficiently uncertain to warrant attention, concern and perhaps even some preliminary contingency planning (29). These cinemas are such important assets that the significant negative impacts of their closures would ripple strongly through their districts and surrounding communities. Their importance was recognized by the communities around the country that organized in some manner to help them make the digital transition and survive.
However, a number of other district organizations did not become involved because they were either unaware of their theater’s situation, or thought it was the theater operator’s role – not theirs – to make the digital transition, or felt they did not know what they could do to help. In response, one might argue that:
- As stewards, not just of the of their district’s physical condition, but also of its economic well-being, they should have been aware of their theater’s problems and done so within an actionable timeframe – especially since a movie theater is such a strong and irreplaceable asset
- Though a district organization obviously had no obligation or role to undertake on its own a movie theater’s digital conversion, the cinema’s strategic economic importance certainly warranted the organization helping the theater operator to do so — or to facilitate bringing in a new operator who could
- The experiences of towns in ND and the Adirondacks show a number of tools communities and district organizations might use. Crowdfunding is certainly one of them. Also, Josh Bloom has written about a number of community enterprise tools that might be used to help keep downtown and Main Street businesses open that could be applied to a movie theater (30). Furthermore, a number of states appear to have funding programs that can be tapped to help save movie theaters. An empty toolbox is no longer an excuse for inaction.
With the digital transition almost completed, movie theater operators no longer face an immediate threat to their survival – other than those arising from normal day-to-day business activity. Nonetheless, there are uncertainties present that might soon generate new meaningful threats:
- Will the studios and theaters continue to increase ticket prices and to the extent that there is a growing reduction in moviegoing among deliberate consumers?
- Will improvements associated with making watching movies in a theater a stronger special occasion translate into higher ticket prices that also reduce moviegoing among our deliberate consumers?
- Will the studios shorten the “theatrical window” and release most new films much sooner into the ancillary distribution channels?
- Will the studios’ focus on the international box office lead to films that do not appeal to significant domestic market segments?
- Will technology produce new gadgets, e.g., virtual reality devices, that can make home or mobile viewing similar to watching a movie in a theater? Or will the costs of cable connections and streaming services rise so much that they make theater prices more competitive?
- How do the changing rates of moviegoing among demographic categories translate into likely attendance in a downtown’s market area?
Happily, most downtown organizations now need not worry intensely about their cinemas, yet it is not the time for them to completely look away. During a crisis is not the time to figure many things out. It might be very useful for them now to:
- Keep abreast of their theater’s situation – including changes in attendance rates — and alert to relevant happenings in the film industry
- Explore how existing and planned district amenities and activity offerings can be marketed to make district moviegoing even more of a special occasion. Note: this way way of improving a cinema’s ” special occasion” capability does not entail costs that have to be passed on in higher ticket prices
- Think about what they would do if their theater became endangered to help raise money, attract patrons, find another operator or create a new form of ownership for the theater
- Give thought to other communities, local organizations and government agencies they could work with should a threat emerge.
ENDNOTES
1. Motion Picture Association of America. “Theatrical Market Statistics 2013.” P.10. Hereafter referred to as MPAA. http://www.mpaa.org/wp-content/uploads/2014/03/MPAA-Theatrical-Market-Statistics-2013_032514-v2.pdf
3. See: https://www.ndavidmilder.com/2014/03/the-new-normals-challenges-to-developing-a-downtown-entertainment-niche-based-on-formal-entertainments-part-2-the-audiences.html . Hereafter cited as Part 2.
4. MPAA p13
5. Melissa Hart of the Adirondack North Country Association, quoted in Stephanie Garlock , “Why the Switch to Digital Projectors Means the End of the Small-Town Movie Theater,” Atlantic Cities, Aug 28, 2013 http://www.theatlanticcities.com/arts-and-lifestyle/2013/08/why-switch-digital-projectors-means-end-small-town-movie-theater/6625/
6. Source: Motion Picture Assn Worldwide Market Research. Cited by Edward Jay Epstein, “Hollywood’s Death Spiral: The secret numbers tell the story.” Slate, Posted Monday, July 25, 2005, at 2:48 PM ET
7. Part 2
8. Part 2, MPAA
9. See Epstein in endnote 6
10. N. David Milder, “DANTH’s FOURTH LUSTRUM DOWNTOWN TRENDS ASSESSMENT 2008 Part 1: Downtown Movie Theaters Will Be Increasingly In Great Danger,” Danth Inc., 2008, p.14 https://www.ndavidmilder.com/wp-content/uploads/2012/05/trends_p1_films_08.pdf
11. Michael Hurley, “We’re About to Lose 1,000 Small Theaters That Can’t Convert to Digital. Does It Matter?” Indiewire, February 23, 2012 http://www.indiewire.com/article/were-about-to-lose-1-000-small-theaters-that-cant-convert-to-digital-does-it-matter
12. Patricia Leigh Brown, ” Movie Houses Find Audience in the Plains,” New York Times, July 4 ,2010http://www.nytimes.com/2010/07/05/us/05theater.html?pagewanted=all&_r=0
13. Melissa Hart of the Adirondack North Country Association, quoted in Stephanie Garlock , “Why the Switch to Digital Projectors Means the End of the Small-Town Movie Theater,” Atlantic Cities, Aug 28, 2013 http://www.theatlanticcities.com/arts-and-lifestyle/2013/08/why-switch-digital-projectors-means-end-small-town-movie-theater/6625/ ; Paul Post, “Small Theaters in Adirondacks Face Choice in Switch to Digital: Pay or Perish,” New York Times, December 25, 2013, http://www.nytimes.com/2013/12/26/nyregion/in-switch-to-digital-small-theaters-in-adirondacks-face-choice-pay-or-perish.html and telephone interview with ANCA staff
14. Telephone interview with ANCA staff
15. See, for example: http://teaneck.patch.com/groups/business-news/p/teaneck-s-cedar-lane-cinemas-to-reopen
16. See: https://www.kickstarter.com/projects/613557145/tivoli-cinemas-in-westport-go-digital-or-go-dark
17. MPAA p.5
18. Richard Corliss , “Five Things We’ve Learned in Five Years of Box Office Reports.” 10:00 AM ET 040514 Time.com. http://time.com/49440/five-things-weve-learned-in-five-years-of-box-office-reports/
19. See: Information is beautiful. https://docs.google.com/spreadsheet/ccc?key=0Aqe2P9sYhZ2ndEtDWmVXNi1FWmN5ei0yMlUwdXBIZ1E&hl=en_GB#gid=1
20. Doug Stone, “How do studios decide when to release a DVD for a theatrical release_ – Quora. July 3, 2012. http://www.quora.com/Movie-Business-and-Industry/How-do-studios-decide-when-to-release-a-DVD-for-a-theatrical-release”
21. http://www.boxofficemojo.com/yearly/ and http://www.bls.gov/data/inflation_calculator.htm
22. MPAA p.26
23. Brooks Barnes, “Battle for the Bigger Screen,” New York Times, April 11, 2014, http://nyti.ms/ORPuJm
24. See: http://www.gilsoncafecinema.com/index2.htm
25. Anand Giridharadas, “The Screen Is Silver, but the Seats Are Gold: AMC Theaters Lure Moviegoers With Cushy Recliners.” http://www.nytimes.com/2013/10/18/movies/amc-theaters-lure-moviegoers-with-cushy-recliners.html?pagewanted=1&_r=0
26. Ibid.,
27. MPAA
28. See endnote 18 and MPAA
29. N. David Milder, “Many Downtown Movie Theaters Have Closed: Some Lessons For Downtown Organizations,” https://www.ndavidmilder.com/2012/12/many-downtown-movie-theaters-have-closed-some-lessons-for-downtown-organizations.html
30. Joshua Bloom, “Community-owned Businesses: How Communities Become Entrepreneurs,” Main Street Now, March/April 2010. http://www.preservationnation.org/main-street/main-street-now/2010/marchapril-/community-owned-businesses.html. See also Kennedy Smith, “Capital Thinking: Creative strategies to support at-risk businesses”, Downtown Idea Exchange, February 2012 http://www.downtowndevelopment.com/perspectives/dixperspectives020112.pd
© Unauthorized use is prohibited. Excerpts may be used, but only if expressed permission has been obtained from DANTH, Inc.