N. David Milder at DANTH, Inc.

Downtown Revitalization Specialist

Main menu

Skip to content
  • Home
  • About NDM
  • News
  • Downtown Curmudgeon
  • Reports
    • Long Island City (pdf)
    • Manhattan
    • Meredith (pdf)
    • Morristown (pdf)
    • Peoria (pdf)
    • Sherwood, WI (pdf)
  • Downtown Revitalization
  • Contact

Category Archives: Entertainment

Post navigation

← Older posts
Newer posts →

Downtown Restaurants: the Cornerstones for Strong Entertainment and Hospitality Niches and a Vibrant Central Social District

Posted on February 4, 2015 by DANTH

Posted by N. David Milder

Why Restaurants Can Be So Important for Downtowns

1. They Can Strongly Respond to Very  Basic Human Needs. At the most fundamental level, downtown restaurants can be powerful because they can help fill many of the most basic  needs of downtown users. Most obvious is the need for food when people are away from home. Those likely to have such a need include downtown visitors from near and far, those who work in the downtown as well as residents in or near the downtown who want food other than what their pantries and refrigerators can provide. Additionally, to basic sustenance, the food’s quality can provide pleasure or pain, delivering strong incentives for return visits or avoidance.

The context in which the food is provided also can satisfy our basic needs for social interaction and our desires to be with people who we like and enjoy. Responding to these needs, many cultures highly value providing bounteous good food and drink at a meal shared with others as an essential way of displaying hospitality, affection and respect to others. We often go to restaurants to have a good time and that usually means not only enjoying food and drink, but also sharing those pleasures with those we like or love.

Really great restaurant operators understand the drawing power that can be created by an eatery that responds across the board to our needs for sustenance, pleasure and social interaction — and they include themselves in the equation. For example, Jean-Claude Vrinat — under whose leadership Taillevent dominated the Parisian restaurant scene for decades — once explained that great food, great wines and great service were necessary, but insufficient reasons for his restaurant’s success. The key factor was to treat all of his guests as if they were members of his family. His quests, he believed, were looking, most of all, for an enjoyable, entertaining experience and this had a very important social component that his restaurant had to respond to. Of course, his food and wines had to be exceptional (his wine cellar was legendary), but it was the ability to make his guests feel at home while having an exceptional experience that made Taillevent truly extraordinary.

Restaurants also provide pleasure through their ability to function as informal entertainment venues. People watching is perhaps the simplest form of entertainment and restaurants can provide copious opportunities for watching the ways that fellow diners and restaurant staff behave. Many of the staff’s activities are like well-practiced performances: flambéing food, the opening of wine bottles, filleting fish, mixing drinks, the making of pizzas and tandoori foods, etc. Indeed, some restaurants even have chefs tables where guests pay extra to be able to watch their food being made.

Few, if any, of the other types of downtown operations can respond to a similar package of basic human needs. Restaurant operators who understand that they are selling a lot more than just the calories needed to keep their customers’ bodies functional are much more likely to be successful.

2. They Can Perform Critical Social and Economic Roles.  Restaurants are sometimes special neighborhood meeting places where people who live or work in an area go to be with their neighbors, coworkers and friends. British pubs, the “locals,” are great examples of this, but their functional equivalents can be found around the world and in places large and small in the USA. They can provide the “third places” that help generate a sense of community in a district and structure its cohesion.

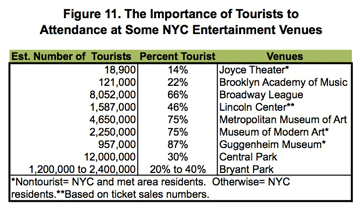
Popular eateries and watering holes within easy reach also can  be a critical amenity for firms in many downtown niches. Hotels, antiques shops, museums, and theaters, for example, typically draw their patrons from a much larger trade area than their downtown’s retailers and these patrons have a high probability of needing food and comfort during their visits.

Downtown retailers also may find that nearby eating and drinking places are pleasing and needed amenities for their customers. Often, a strong downtown restaurant, e.g., the Golden Lamb in Lebanon, OH, or a restaurant niche, e.g., in downtown Rutland, VT or Morristown, NJ, , can bring in customer traffic that can be shared with downtown retailers. In 2010, in downtown Morristown (town population 18,529), there were 77 restaurants and nine cafes/coffee bars and this niche drew more customers downtown than any other economic segment in the district. A ballpark estimate of this niche’s sales was $79.4 million+. The fact that 21 downtown eateries were listed in Zagat is very unusual for a downtown of this size. The 11 rated in Zagat averaged 20+ scores on food, service and décor, indicating that they were well-regarded by their customers (1).

However, in many small and medium-sized districts, a lot depends on how the operating hours of retailers and restaurants overlap. For example, retailers who close at 5:00 pm or 6:00 pm are not likely to benefit much from a popular nearby restaurant that is only open for dinner. Similarly, a shop that opens at 10:00 am is unlikely to benefit much from the customer traffic generated by a nearby eatery for breakfast.

Eating and drinking places also can have some impact on the locational decisions of both residents and businesses, though it is probably not decisive.  Their influence on corporate locational decisions has likely waned over the past 30 years. Back in early 1984, Regional Plan Association surveyed 47 major corporations headquartered in Manhattan about the criteria they used to assess potential back office locations. Fifty-one percent reported that the proximity of restaurants and shops were important (2). It was the sixth strongest of the 19 locational criteria the corporations were asked about. Today, it is doubtful that a similar survey would have comparable results. Large corporations now want to keep their staffs inside their buildings as much as possible. To that end, many have on-site subsidized cafeterias, with some (e.g., Google) famously even providing free food. However, it can be reasonably argued that popular eating and drinking places may be a more important locational factor for downtowns that have a lot of smaller businesses with workers that need to do a lot of social networking, e.g., where there is an innovation district or in county seat downtowns.

According to a 2013 survey done for the National Association of Realtors, about 45% of Americans want to live in a city or suburban area that is near shops, including restaurants (3). The survey also found that 42% of the respondents felt there were too few shops or restaurants within an easy walk of their homes, while 48% felt there was the right amount (4).

Very importantly, restaurants are also often pioneers in revitalizing neighborhoods and commercial centers. Three powerful reasons for this, as will be discussed below, are that:

  • The much venerated real estate adage “location, location, location” seems to hold less power for restaurants than for other commercial operations
  • Restaurant often need to capture a much lower market share to survive than other commercial operations
  • Affordable rents, e.g., less than 10% of annual sales, are critical to a restaurant’s success and often are more easily found in areas that may be distressed, but have “good bones” and an attractive location.

Some Important Factors That Impact on the Success of a Downtown Restaurant Niche

1. Density of Potential Customer Spending Power. When it comes to restaurants and dining out, trade area population size and household incomes are two very important factors. Together, they determine the size of the pool of dollars for which restaurants can compete.

Residential Populations. Obviously, larger towns have more people, who are likely to have, in aggregate, more money to spend in restaurants than the residents in smaller towns. Consequently, the larger towns are likely to have more and stronger restaurants in operation.

For the analytical needs of most communities in the US, the densities in our very largest cities are so great that they stand apart and their restaurant scenes are not salient. For example, in 2007, New York City had 16,921 eating and drinking establishments that captured about $14.4 billion in annual sales (5). Looking within the city, in a 3-mile radius of the Queens Plaza commercial district in the Borough of Queens, there are about 1.18 million residents who spend about $2,9 billion annually on food away from home (6).

Table based on ryans data 012614

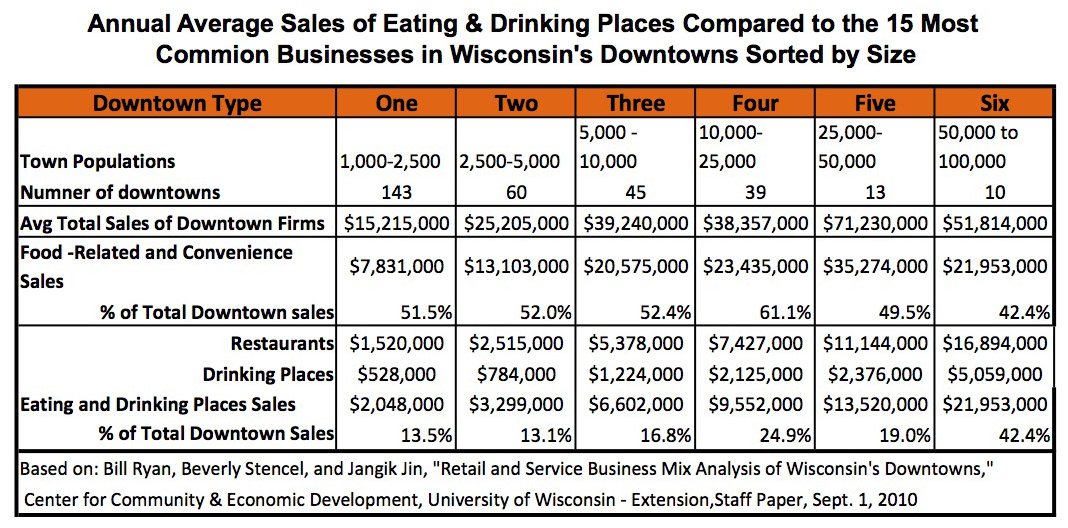
The table above, based on some excellent research by a Bill Ryan led research team, is more reflective of what will be found in most states. It shows some interesting business sales data for downtowns in 303 communities in Wisconsin with populations ranging from 1,000 to 100,000.  It presents the  average total annual sales of eating and drinking places in these downtowns and enables them to be compared to the total annual sales of the 15 most common types of business found in these downtowns, with the results sorted into six categories according to the towns’ population sizes. Some findings to consider:

  • The average total sales in these 300+ downtowns does not rise strictly with the size of their community’s population. Sales peak in the communities with populations between 25,000 and 50,000. This indicates that other explanatory factors are involved. Household incomes is certainly one of them. The size and nature of the downtown’s close-in residential population is probably another
  • Food-related and convenience sales, which includes both restaurant and food store sales, represents at least half of the total downtown sales in all the communities with less than 50,000 populations. Interestingly, they represents just 42% of the downtown sales among those in the 50,000 to 100,000 range. There are no food store sales reported in the 10 downtowns in that category, just sales from eating and drinking places! The lack of food store sales supports the hypothesis that the downtown’s close-in population is an important explanatory variable
  • The total sales of the eating and drinking establishments increases  steadily with population size from about $2 million in the communities with 1,000 to 2,500 populations  to $22,9 million in cities with population between 50,000 to 100,000
  • The sales of the eating and drinking places in smaller communities, with populations under 25,000, range from about $2 million to about $9.5 million. While $2 million is the lowest amount of sales, it is not a negligible finding. First of all, it shows the capability of these eating and drinking places to capture real dollars. Two million dollars are not chump change. Also, in these smaller towns, most of these establishments do not have to be $1 million or even $500,000 operations to survive or perhaps prosper
  • Looking across the six population categories, there is an unsteady trend for the percentage of total downtown sales captured by eating and drinking places also to increase,  with a very slight decline in category “Two” and more substantial decline in category “Five. The latter is not unexpected, since the total sales variable is in the equation .

To get some tangible idea of what such sales might mean in smaller communities, let us consider two small communities in WI, Sherwood and Town-X.  The table immediately below presents some data on their restaurant scenes.

Small town WI restaurant numbers and sales TABLE v4

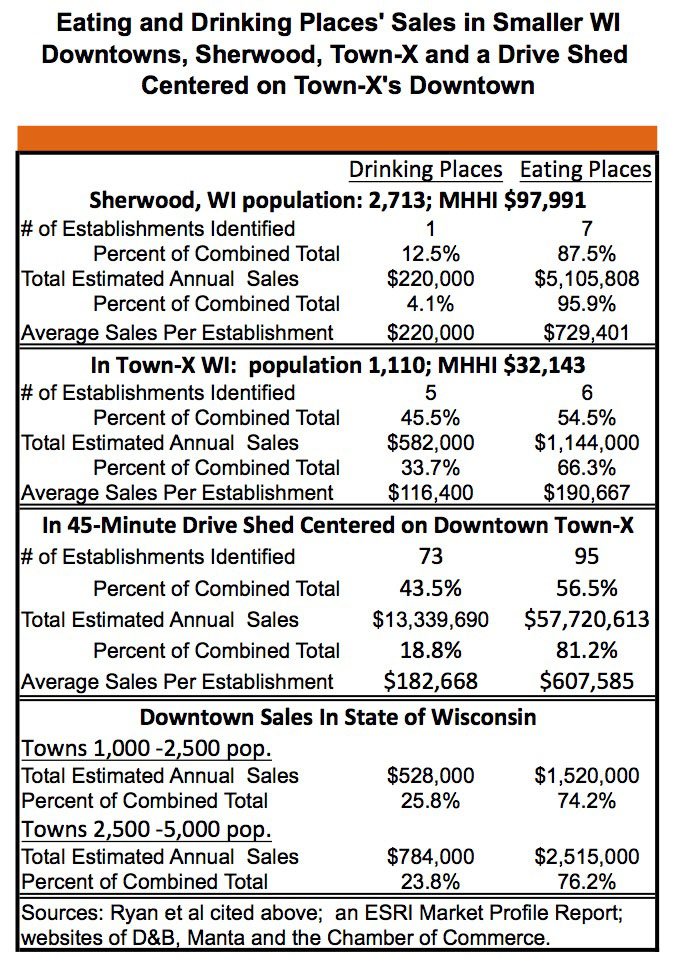
The data demonstrate that despite their size, small towns still can attract quite a few eating and drinking establishments. Sherwood, WI, with a population of 2,713, has one drinking place and seven eating places. (Several of the eating places also have strong bars.) Town-X, WI, with a smaller population of 1,110, has five drinking places and six eating places. Having a lot of drinking establishments appears to be common in the part of WI where Town-X is located: about 45.5% of the eating and drinking places in Town-X are watering holes, while that percentage for a surrounding 45-minute drive shed is 43.5%. An important difference is that the average sales of Town-X’s eating and drinking places are significantly smaller than comparable establishments in the drive shed. Two possible explanatory factors are that parts of the drive shed are more densely populated than Town-X and the town’s median household income is about 14% lower than the shed’s. Nationally, many other small towns will have eating and drinking places with characteristics similar to those found in Town-X: they are relatively numerous, with relatively low sales and a comparatively high percentage of drinking establishments.

From a downtown revitalization perspective, the problem with the restaurants in such smaller communities is often more their quality than their potential to be profitable (which certainly is challenging for all restaurants). In turn, this is influenced by the difficulty in attracting more capable operators, who are likely to find the larger profit potentials of bigger communities more attractive. While many smaller town restaurant operators have the ability to  become more accomplished through training, the bottom line question is: do they have the motivation, time and money to get such training?

Featuring quality local food products and dishes is certainly a sound business strategy, but if having a local focus means operators are responding to undemanding standards for food, service and ambience, be they their own or those of their local customers, they are unlikely to grow their trade areas or attract many tourists.

Sherwood demonstrates another pattern, that is rarer, but happens often enough to deserve notice. Sherwood is located on the fringe of the Appleton Metropolitan Area, near a popular state park that sits on Lake Winnebago. Its residents have a median household income of almost $98,000/yr. Its restaurants have total annual sales, about $5.1 million, far above the $2.5 million average  for towns in the 2,500 to 5,000 population range found by the Ryan team. DANTH’s research found Sherwood restaurant owners reporting that most of their customers were from other communities, yet there was still sufficient leakage of local residential restaurant expenditures to warrant recruiting some new operators (7). Apparently, the Sherwood restaurants’ concepts were more suited to out-of-towners than local residents, so the residents went elsewhere. This is not an uncommon situation in communities benefiting from a strong tourist trade or that are comparatively affluent and their eating and drinking places attract less affluent diners from nearby communities.

Other Downtown Users. Downtown office, blue collar and uniformed workers, tourists and students are other important components of a downtown’s daytime population that heavily structure the demand for downtown food services. A good example of this is Gering, NE, the county seat of Scotts Bluff County. It has a residential population of 8,480. Its downtown daytime population has the following components:

  •  About 1,544 people employed within a 10- minute walk of the downtown’s center. About 1,127 were probably office workers who had an estimated annual expenditure potential of about $1.5 million for food services
  • There are about 3,951 people employed within a 5-minute drive of  the downtown’s center, of which about 1,954 are probably office workers. They had estimated expenditure potentials of $2.6 million for food services
  • The grade school, junior high and high school within reasonable walking distance of the downtown have a total of 1,261 students. The 640 high school students have a direct spending potential of about $0.9 million, a significant percentage of which is for food services
  • Gering has three significant tourist market segments. About 122,000 people visited the nearby Scotts Bluff National Monument in 2012, most passing through the downtown. Roughly 50,000 people attended events at the Gering Civic Center annually. Gering’s hotels had about 29,000 guest nights in 2012. These three tourist market segments annually bring into the county about $4.2 million in purchases from food service operations (8).

A diverse set of downtown of users is possible in towns large and small. These user segments are likely to frequent restaurants at different times of the day: e..g., seniors at mid-morning;  office workers at noon; students after school and residents in the evening.

LICs 3 new local market segments

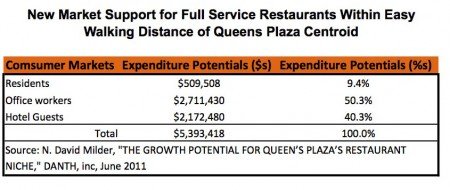
The strength of these user segments and their impacts on downtown eateries can have considerable variation. For example, in some of our larger cities, the residential market may be significant, but not nearly as strong as the daytime workforce or downtown hotel guests. This is the case in the Queens Plaza commercial district. It is located in NYC’s Long Island City neighborhood that has seen considerable economic growth over the past decade, even through the Great Recession. In this district, new restaurants will appear in response to the new residents, office workers and hotel guests that have come into the area. As can be seen in the above table, residents represent only about 9.4% of the new restaurant demand, while the office workers and hotel guests account for much higher shares, 50.3% and 40.3% respectively. In a significant number of smaller downtowns, e.g., Gering NE, the downtown workers and tourists also can be critically important to restaurants because they constitute such a high proportion of their daytime users.

2. Household Income Strongly Influences Food Away From Home Expenditures. Restaurant demand in a trade area is impacted not only by population density, but also by the household incomes of those who live, work and visit the area. Surveys by the Bureau of Labor Statistics (BLS) have consistently found that, unsurprisingly, food away from home expenditures rise with household incomes. As can be seen in the table below households in the highest income quintile (e.g., highest 20%) spent on average $5,366 dollars in 2012 in eating and drinking places, while those in the middle quintile spent $2,164 and those in the lowest spent just $1,086.

Table 2 new

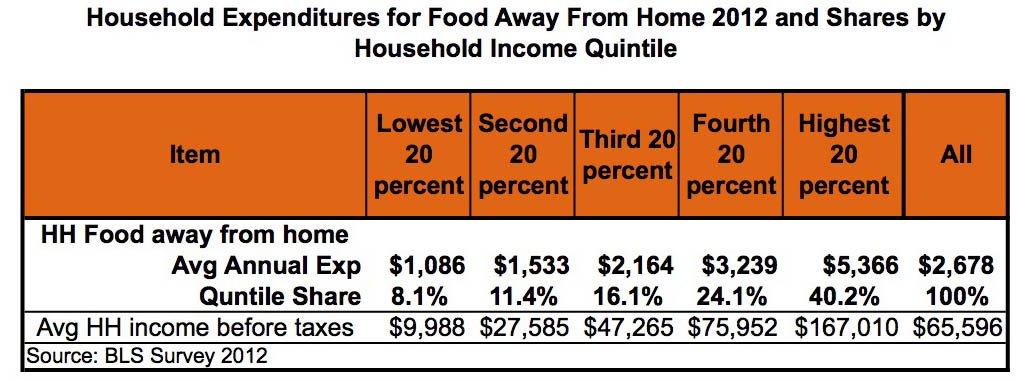
Also, the BLS  consistently has found that the households on the highest rungs of the income ladder account for a very disproportionate share of the food away from home expenditures. As can be seen in the table above, the 20% of the households with the highest income in 2012 had an average income of $167,010 and accounted for 40.2% of the nation’s food away from home expenditures. Combined with the next highest income quintile (the fourth 20 percent in the table), they they represent 40% of the households, but close to two-thirds of all food away from home expenditures.

The ability of a downtown to attract and support eateries and watering holes will be strongly impacted by how household incomes are distributed in its trade areas. Most downtown trade areas will be dominated, in varying degrees, by households in the three national middle income quintiles. Placing the median household income in your downtown’s trade area in its national income quintile can:

  • Provide a quick and easy indication of the strength of your local restaurant demand
  • Help calibrate local expectations about the type of restaurant niche the downtown can reasonably be expected to support

The Decline of Middle Income Households. While, over the past decade, our largest cities have seen strong growth in the number of relatively affluent people who live in or within easy walking distance of their downtowns, most of the other communities in the nation still have downtowns that are dependent on middle income customers. The problem they face is that the number of middle income households — broadly defined as those with incomes between $35,000 and $100,000 — has been decreasing (see the chart below).

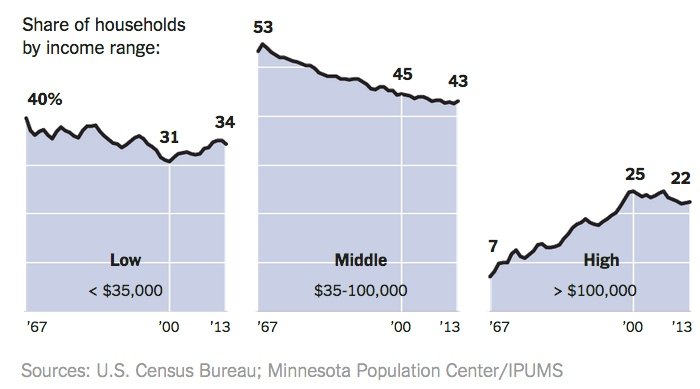
The Decline of Middle Income Households, $35,000 – $100,000, From 1967 to 2013 (NYT 01/26/15)

Another problem is that the incomes of middle income households have been stagnant for many years, even well before the Great Recession. For example, in 2013 dollars, the median household income nationally was $56,800 in 2000, $56,436 in 2007 and $51,939 in 2013 (9).

The reduced number of middle income households and their stagnant incomes have posed demand constraints on restaurants in most of our nation’s downtowns and there are few indications that they will soon or easily go away.

3. Lifestyle Segments and Age Cohorts Impact Restaurant Preferences and Behaviors. People live different lifestyles that entail different sets of consumer preferences and behaviors. This means that even among people with similar incomes, their different lifestyle preferences will lead them to patronize different restaurants and to vary in how often they go out to eat. The table below shows how often three lifestyle segments are likely to visit 19 restaurant chains compared to the national average

Tap segs restaurant visits new

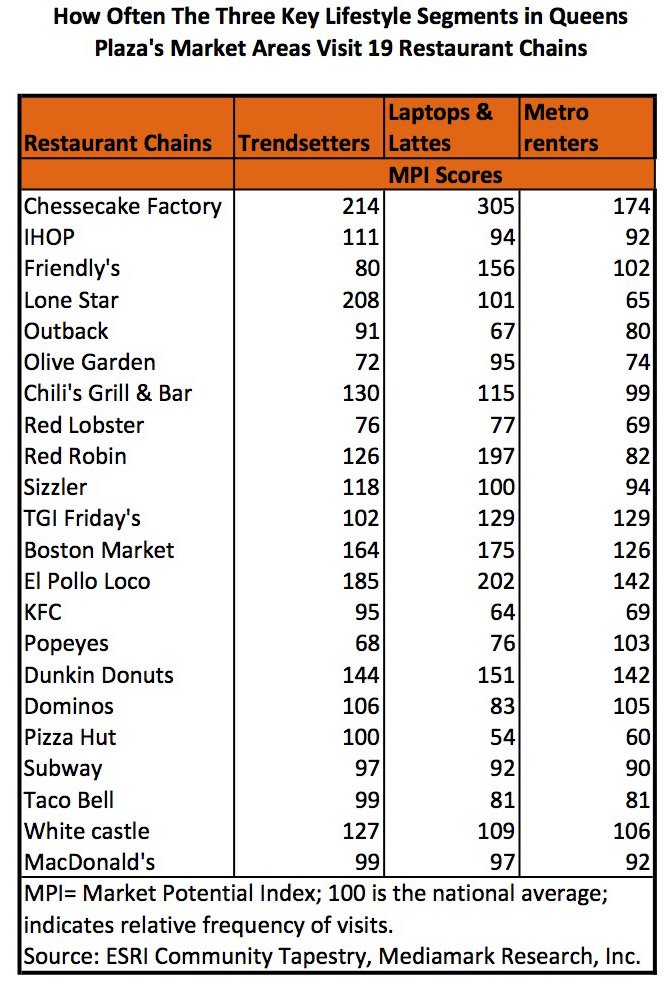
that is expressed in the MPI Score. These data are from ESRI’s Tapestry dataset and cover the market areas of the Queens Plaza commercial district in NYC. There are other vendors of such data and they are available for almost every downtown trade area.

Baby boomers and millennials are the two largest age groups and they each have an enormous impact on ur economy and restaurant industry. The baby boomers are now in or soon entering the retirement portion of their lives. The millennials, aged from 18 to 30 or 35 are the ones that will have increasing impact as they age, nest and make more money. Our pre-Internet retail and restaurant industries were hugely influenced by the baby boomers; today they are increasingly impacted by the 50 million to 60 million millennials. However, more restaurant expenditure dollars now are in the pockets of the boomers than in those of the millennials. The millennials are in the start up phase of the their careers and the Great Recession heightened their unemployment numbers. They also have been much slower than the boomers to marry and buy homes and cars.

Nonetheless, evidence suggests that the millennials are disrupting the restaurant industry.  As one observer noted:”millennials tend to spend their dining dollars sparingly and in a more calculated way” (10). They eat out less often than the baby boomers did at a similar age. Between 2009 and 2013, their restaurant visits dropped by 16%. While they still go to traditional fast-food hamburger chains like McDonalds and Wendy’s, they prefer the newer chains such as Shake Shake, In-N-Out Burger and Smashburger. “Fast casual” chains, such as Chipotle and Panera Bread, are also very popular among millennials (11 ).

While the impact of the millennials will only increase as they age and accrue greater wealth, for many downtowns the boomers probably represent a stronger market segment on which to build their restaurant niches. For example, in rural communities, small towns and rust belt cities, many of their millennials are fleeing to larger, more successful cities that have more and better  jobs as well as hip downtowns and neighborhoods.

Hipster creatives who live in our large successful cities (think of Austin, Charlotte, Atlanta, DC, NYC, Boston) are a subset of the millennials. They probably have a lower unemployment rate and higher incomes than other millennials and may well have less depressed restaurant visitation rates and expenditure levels.

4. The Rise of the Deliberate Consumer.  The Great Recession, much like the Great Depression, brought about important changes in consumer behavior and expenditure patterns. In turn, these consumer behaviors induced most retail chains to rethink how many stores they needed and how large these stores should be. The most important change in consumer behavior is the emergence of the deliberate consumer, whose key characteristics are well summarized by the findings of survey of 8,000 Americans completed in January 2010:

  • “51% (of respondents said) they have become more budget conscious and will consider each purchase more carefully over the next five years.”
  • “60% (of respondents said) they now focus on what they NEED versus what they WANT” (12).

While deliberate consumer behaviors were less prevalent in affluent households, whose numbers diminished as the values of the investment portfolios have returned to or exceeded their pre-recession levels, middle income households still strongly act like deliberate consumers. One area where these deliberate consumer behaviors have played out is food away from home expenditures.

5. Declining Food Away From Home Expenditures, Especially in Middle Income Households.    Supply side data from the Census Bureau on the total sales and per capita sales of food services and drinking places between 2002 and 2012, as shown in the table below,  appear to indicate that, with the exception of 2009, sales in this industry have had a steady path of growth.

Restaurant total annual sales and per capita.xlsx

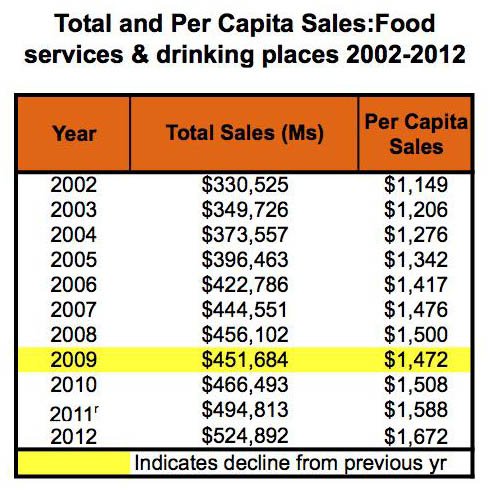
The Great Recession appears to have had just a brief and mildly negative impact.

Table 2005-2012 restaurant CEX


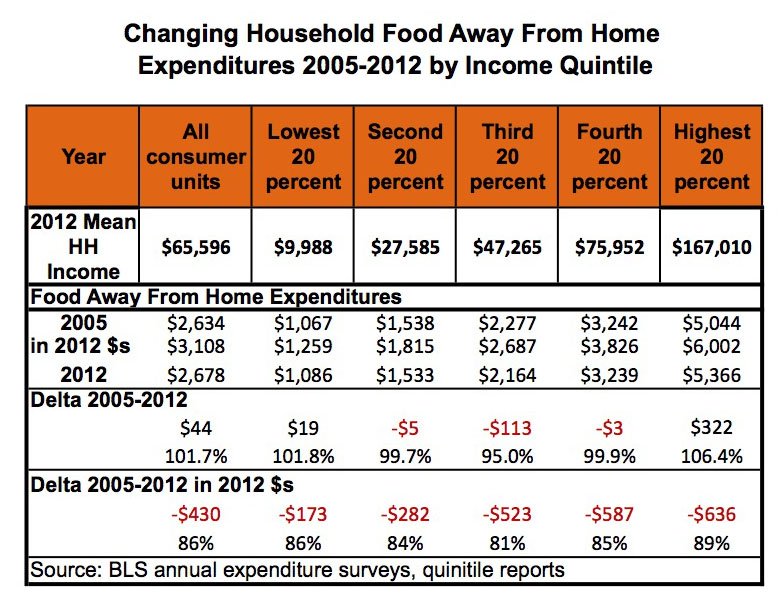
However, demand side data from the BLS, based on large annual, rigorously done surveys, tell quite a different story. The table immediately above shows a comparison of food away from home expenditures for 2005 and 2012 broken down by household income quintiles in two ways, with one converting the 2005 expenditures into 2012 dollars. The analysis using unconverted 2005 dollars shows:

  • A slight percentage growth for all household units of 1.7%
  • A slight increase for the lowest quintile of 1.8%
  • Decreases in the middle quintiles, with those in the second and fourth being slight, but the third quintile had a decrease of 5%
  • The top income quintiles expenditures increased by 6.4%.

The analysis using 2012 dollars for both years paints a much more worrisome picture. Between 2005 and 20012 the value of food away from home household expenditures:

  • Fell by about 14% for all household units
  • They fell by 11% or more across all the quintiles
  • They fell the most in the middle three quintiles: 19% in the third, 16% in the second and 15% in the fourth
  • Even expenditures in the wealthiest quintile fell by 11%.

The BLS data show that the middle income households that most American downtowns and their eating places depend on have significantly reduced their food away from home expenditures.

6. Churn, Upheavals and Closings Among the Restaurant Chains. As of this writing, McDonald’s has just changed its CEO in another attempt to re-ignite sales growth in the USA, where sales of been stagnant in recent years. The mighty McD is worried about its product mix, franchisee disenchantment and increased competition from the growing fast casual chains. But, McD is not alone in trying to rejuvenate their food and operations. Burger King seems to be in a perpetual redo and/or change of ownership. Big Boy and Blimpie closed.

Family eateries also have been feeling a strong pinch. This is understandable since their customer bases were often the middle income households that have reduced their restaurant expenditures. The Darden chain, for example,  has redone or sold Olive Garden and RedLobster. Bennigan’s, Tony Roma, Ground Round, Country Kitchen and Ponderosa have closed.

On the other hand new chains have emerged and grown such as Panera Bread, Chipotle, Shake Shake, Five Guys, In-N-Out Burger, Smashburger, etc.

The tumult among the large restaurant chains reflects forces that are very likely also impacting smaller independent restaurant operators. A search effort found no studies or commentaries on this impact. However, it seems reasonable to suggest that today’s independent operators are facing far more uncertainty than they would have a decade ago.

Some Important Factors That Impact on the Success of Downtown Independent Restaurant Operators

In a very important 2005 article, Parsa, Self, Njite, and King (PSNK) argue that internal factors –e.g., how the restaurant is operated, the operator’s management skill set and ability to maintain family cohesion, the restaurant’s concept — have more impact on a restaurant’s viability than external factors — e.g., competition, location, customer attributes — though the latter are still important (13).  This emphasis on the operator resonated with the findings from DANTH’s interviews over the years with restauranteurs and the salespeople who sell them liquors and wines. DANTH was told repeatedly that it is very hard for a restaurant to succeed and, most importantly, that the operator has to know what he/she is doing, preferably based on significant experience in the industry.

1. Restaurant Competition/Density Within the Trade Area.   PSNK acknowledge that “a restaurant can benefit from close proximity to competition and restaurants are often located in clusters to attract more traffic,” but their data analysis found that restaurant failures were highest in zip code areas having the highest restaurant density. They suggest that:

  • Restaurants need to have clear and effective concepts that differentiate them from their nearby competitors
  • A careful eye needs to be kept on the market area to see if it has become saturated.

DANTH’s research has not found any easy indicator of when a restaurant niche has topped out. The number of restaurants, which is frequently cited by unhappy downtown business operators as an indicator of saturation, is not reliable. For example, the Little India cluster/niche on 6th Street in Lower Manhattan topped out with about 35 restaurants, but the 70+ eateries in downtown Morristown (a much less densely populated community) are still growing.

PSNK’s point is important: restaurant niches can top out at some point because of saturation and it is very important to know when it is about to occur.

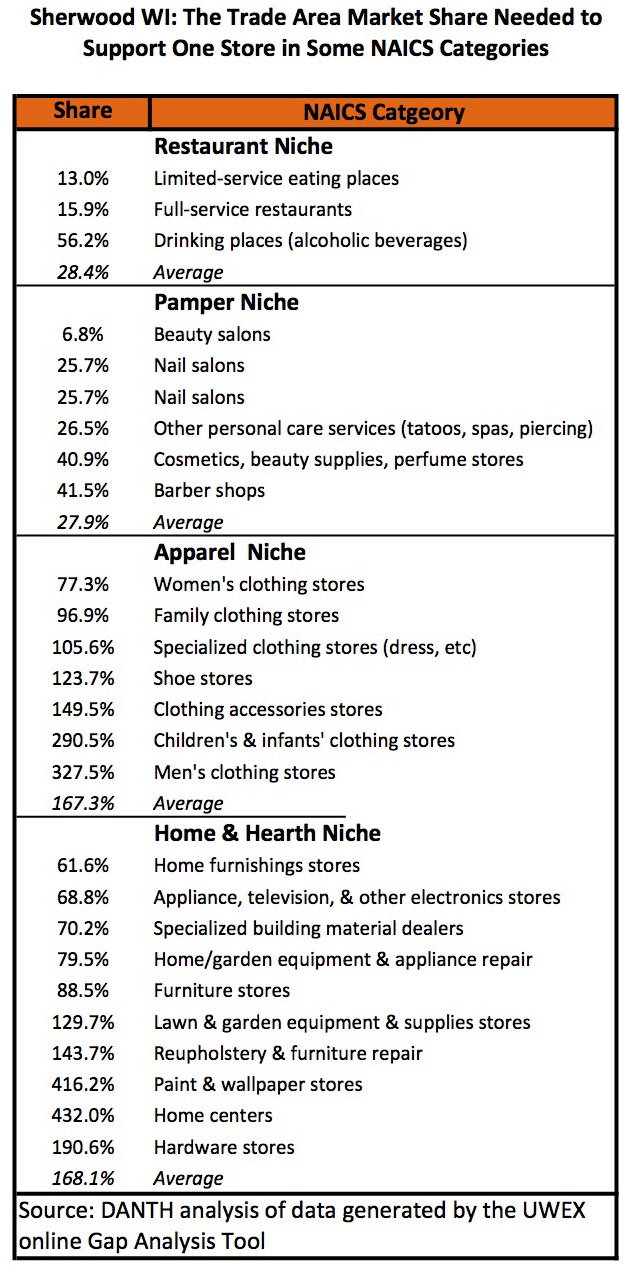
A Positive Market Entry Factor In Smaller Communities. In smaller, less densely populated communities, it may be easier for restaurants to enter the market than is the case for other types of businesses.  As can be seen in the table below, they usually do not need to capture as high a share of the trade area’s consumer expenditures in order to survive as do retail and most personal service operations. This means that restaurant operators, in these communities, need to attain a lower lever of competitive success for their businesses to be viable; they do not need to be as capable as the operators of the other types of businesses.

Table-Market share needed to support 1 store

Location. According to PSNK, where a restaurant is located can influence whether it will succeed or fail. Things like pedestrian and auto traffic, visibility, strong nearby merchants and institutions count. However, very importantly, their research found that while a poor location can hurt, it can be overcome by a great product and operation. On the other hand, PSNK argue, a good location cannot overcome a bad product or operation. This is an extremely important finding for revitalizing downtowns!

Rents. One of the reasons that savvy restauranteurs often select locations that, according to conventional wisdom, are not choice, is that they offer very reasonable and affordable rents. Many restaurant operators have told DANTH that affordable rents are a key variable in where the locate new eateries and whether they will renew leases. Rents are often cited as the reasons why popular restaurants have either moved or closed — even those that are famous. Here in NYC, for example, Bobby Flay recently closed Mesa Grill and Danny Meyer will soon close his Union Square cafe because of substantially increased rents.

Restauranteurs usually can afford to spend about 10% of their annual sales revenues on rent. That means that for every additional dollar spent on rent the restaurant needs to get 10 in sales to afford the increase.

This influences where they are likely to locate. Generally, in  big cities, they avoid downtown streets with the highest commercial rents, though they may be on nearby side streets.

Revitalizing downtowns in cities with significant populations sometimes have their commercial rents rise rapidly beyond what start up restaurants can afford or they still lack the customer traffic the restaurant chains feel the downtown should generate for those rents.

In contrast, smaller towns often have small, non-vanilla box commercial spaces with low asking rents that can be used by a start up eatery. This is another factor that eases market entry and allows low volume eateries to survive.

Restaurant Failure Rates. Regarding failure rates, PSNK  found that:

  • Contrary to the 90% figure often cited (e.g., by American Express), only 26% of the first year restaurants failed, with the number rising to 60% after three years. After that, longevity became a strong predictor that a restaurant would stay in business. Restaurants do have a bigger failure rate than other types of start ups. For example, one broader study found that:”that new establishments with 500 or fewer employees show an average survival rate of 39.8 percent after six years” (14).
  • Small independents had higher failure rates than large franchised restaurants. So while in many communities, it may be easy for them to start up, it also is easy for them to fail.
  • Failure also varied considerably by restaurant industry segment: e.g., the three highest three-year turnover rates were Mexican restaurants 86%, subs and bakeries 76% and Coffee and snacks 70%; the lowest rates were seafood 33%, burgers 33% and Italian 25%. That makes one wonder if there is a connection between survival rates and capital investment rates.

8. Entrepreneurial Factors – what helps a small independent restaurant succeed?  PSNK mention a slew of factors that impact on restaurant entrepreneurial performance. Below are the ones that came across as being the most important.

Implementing a Well-Defined Concept. PSNK found that one of the most important things that can make a restaurant successful is the owner having a concept for the operation that goes well beyond food production. An effective concept is clear, comprehensive and easy to understand and it actually drives activities in the kitchen, business operations and employee and customer relations. Complicated concepts that use too many tools to reach too many customers are apt to fail. Successful restaurants often are good at just adapting and changing as they confront new challenges and opportunities — without the assistance of any complicated strategic plan.

The Operator’s Family is Onboard. Restaurant operators have long and irregular hours. They also often need family members to take on positions within the company — e.g., hostess, bookkeeper, etc. — or to invest capital in it. A frequent result is that the operator’s family is stressed. Successful owners typically have the support of their families and are accomplished  at balancing their home and restaurant lives. Operators often decide  to grow, change or leave the business in order to keep their families whole and happy.

PSNK argue that these “quality of life issues” have greater impact on a restaurant’s survival than previously noted by researchers. Many restaurants are closed because their owners are no longer willing stress their families or work long irregular hours.

The Operator Needs the Appropriate Skill Set , Motivation and Experience. Last, but far from least in importance,  it is critical for the owner-manager to have the specific skills that are needed to run a restaurant. These are usually acquired or perfected through prior work experiences in restaurants. As is the case for all small firms, the owner is often performs the roles of the CEO, COO, CIO, bookkeeper, advertising manager, human resources manager, purchasing agent, etc.  The operator’s drive,  determination and passion can also be critical for a restaurant’s success.

Incompetent and inexperienced operators have been frequently cited by scholars to be a primary factor for explaining small-business failures generally. This is certainly the case in the restaurant industry.

Some Take Aways

  • Restaurants can have great impacts and make strong contributions to a downtown’s success
  • As the performance of central social district functions and the growth of entertainment niches become more important in downtowns of all sizes, so does the importance of its restaurants
  • Restaurants can be critical assets and amenities for other downtown niches
  • Restaurants can have these important impacts even in smaller communities
  • The decline in the number of middle income households and the stagnation in their income growth have placed serious constraints on the growth potential for restaurants in most downtowns
  • Even in small downtowns,diverse sets of visitors impact on restaurant demand, both in terms of the expenditure potentials and the types of eating places customers like
  • While restaurants can definitely benefit from geographic clustering, too much density within a trade area can stimulate failures. Within a cluster it’s essential for a restaurant to differentiate itself from its close by competitors. It’s also important to recognize when a restaurant niche has topped out, i.e., when the market area has become saturated
  • In smaller communities, restaurants often need to capture a smaller market share than other types of retail and personal service operation, which makes their market entry comparatively easier
  • While a poor location can hurt a restaurant, it can be overcome by a great product and operation. On the other hand, a good location cannot overcome a bad product or operation
  • Restauranteurs usually can afford to spend about 10% of their annual sales revenues on rent. That means that for every additional dollar spent on rent the restaurant needs to get 10 in sales to afford the increase.
  • Only 26% of the first year restaurants fail, with the number rising to 60% after three years.Small independents had higher failure rates than large franchised restaurants.Significantly, failure also varied considerably by restaurant industry segment: e.g., the three highest three-year turnover rates were Mexican restaurants 86%, subs and bakeries 76% and Coffee and snacks 70%; the lowest rates were seafood 33%, burgers 33% and Italian 25%.
  • Entrepreneurial Factors – what helps a small independent restaurant succeed:
    • Implementing a well-defined concept
    • The operator’s family is onboard
    • The operator needs the appropriate skill set, motivation and experience.


Endnotes

1.  N. David Milder,  “Downtown Morristown: A Retail Revitalization Strategy And Action Plan,”  DANTH, Inc., September 2010, p.23

2.  Armstrong, Regina B., and N. David Milder. “Employment in the Manhattan CBD and Back-Office Locational Decisions.” City Almanac 18.1/2 (1984): 4-18.

3. Myers Research and Strategic Services, “NATIONAL COMMUNITY PREFERENCE FREQUENCIES, September 18-24, 212,” p.3. This reports the responses to a national survey with 1,500 respondents that was done for the National Association of Realtors

4 Ibid., p.2.

5. Census Bureau, 2007 Economic Census.

6. N. David Milder, “REPORT on: THE GROWTH POTENTIAL for QUEEN’S PLAZA’S RESTAURANT NICHE,” June 8, 2011, DANTH, Inc. p.3

7. DANTH, Inc. and Short Elliott Hendrickson Inc. “Village of Sherwood: Downtown Market Analysis and Strategy,” August 2012.

8. DANTH, Inc. and Short Elliott Hendrickson Inc. “City of Gering Downtown Revitalization Plan,” February 2014, p.15.

9. Data from the website of the Economic Policy Institute:  http://www.stateofworkingamerica.org/charts/real-median-household-income/

10. Stephanie Strom, “Restaurant Chains Try to Woo a Younger Generation,” New York Times, June 7, 2013   www.nytimes.com/2013/06/08/business/as-eating-patterns-shift-restaurant-chains-aim-at-younger-generation.html?pagewanted=print 1/5

11. Ibid.,

12.  Cited in: White Hutchinson Leisure & Learning Group White Paper, “The Great Recession: Its Long-Term Impact on Consumers and Location-based Businesses,” February 2010:https://www.whitehutchinson.com/leisure/articles/groundedconsumer.shtml

13. H. G. Parsa, John T. Self, David Njite, and Tiffany King, “Why Restaurants Fail,” Cornell Hotel and Restaurant Administration Quarterly, August 2005, pp. 304-322, p.

14. Phillips, Bruce D and Kirchhoff, Bruce A., Formation, Growth and Survival; Small Firm Dynamics in the U.S. Economy (1989). Small Business Economics, Vol. 1, Issue 1, p. 65-74 1989. Available at SSRN:http://ssrn.com/abstract=1504489

© Unauthorized use is prohibited. Excerpts may be used, but only if expressed permission has been obtained from DANTH, Inc.

Posted in Business Recruitment, Central Social Districts, Deliberate Consumer, Downtown Merchants, Downtown Niches, Downtown Redevelopment, downtown retailing, Economci Development, Entertainment, Entertainment niche, Entrepreneurship, Informal entertainment venues, New Normal, Small Merchants, Small Towns, Trends |

Three Informal Entertainment Venues in Smaller Communities: Bryant Park Series, Article 4

Posted on December 14, 2014 by DANTH

Posted by N. David Milder

Introduction

Over the last few years, my thinking has increasingly focused on how, under the new normal for our downtowns, it is increasingly important to strengthen the central social district functions of all downtowns and the challenges faced by downtown revitalization efforts in smaller communities. Strong entertainment niches, which can have formal and informal components, help assure the vitality of central social districts. So far in this series of articles on informal entertainment venues, the focus has been on Bryant Park (BP) as a model of that type of venue. In the previous parts of this series, the data and arguments presented supported the proposition that these informal venues can be more affordable to create and operate than the formal entertainment venues and consequently better able to serve as early cornerstones upon which a strong entertainment niche can be built. Since BP is located in our nation’s largest city, many may question its relevance for smaller communities where populations, attendance, and resources are likely to be substantially thinner. Consequently, this article will take a closer look, often using BP as a lens, at the three informal venues in smaller communities that were presented in Parts 2 and 3: Central Park Plaza in Valparaiso, IN; Mitchell Park in Greenport NY and Division Street Plaza in Somerville, NJ (1).

The Roles of the Informal Entertainment Venues in the Three Smaller Communities.

Before looking at the three informal entertainment venues, it is useful to look at the communities where they are located to get both a sense of the roles these venues play in their downtowns and an idea of why I selected them for analysis.

Figure 15

Valparaiso, IN. Earlier this year, I searched the Internet for the best public spaces in smaller communities. The most useful result I found was a list on the Planetizen website naming the 100 best public spaces in the nation. However, among those listed, I could not find any in communities with populations under 35,000 that were appropriate (2). I then sent out emails to people I know who are either consultants specializing in public spaces, the coordinators of state Main Street programs, or consultants who specialize in smaller communities, asking for information about really good public spaces they knew of in smaller communities.

The sole reply was from Bob Kost of SEH, who had designed the Central Park Plaza in downtown Valparaiso IN. Bob and I recently had worked together on a project in Gering NE. My follow-up research revealed that the park had significant attendance and just a few months after its opening, in 2011, it had won so much popular and political support that the city committed to its expansion (which is now under construction). In September 2014, I visited the park and met with local officials, who graciously have provided me with the information I pesteringly requested (3).

Valparaiso is located in northwest Indiana, about an hour’s drive from Chicago and is the county seat of Porter County. It has a population of about 32,000. “Valpo” is a real middle-income town: its households have a median income of $50,182 that, nationally, is in the 3rd income quintile. About 2,472 people are employed within a quarter mile of Central Park Plaza, with 41% working for the county or the city (4). The four largest employers in the city are the health system, the university, the local school system and the county government. The downtown residential population is, unsurprisingly, not dense, though the available units, located mostly above shops, have few vacancies. The local chamber claims that in recent years the city has seen substantial economic growth, with “…$40 million in public investment, nearly $700 million in private investment, redevelopment of a five-block downtown area, and two key corridors into the city” (5).

The city’s leadership sees downtown revitalization as critical to the economic health of the whole community. For example, at the groundbreaking for Phase 2 of Central Park Plaza, Mayor Jon Costas stated:

“Years ago when we started thinking about how we could make Valparaiso stronger, one of the things we identified was the downtown. I knew intuitively that the downtown is the heart of our city, and the heart has to be healthy for the whole body to function”(6).

Moreover, the city leaders are strategically savvy about how to accomplish that goal: by building a strong “hospitality niche” in which Central Park Plaza is seen as an essential cornerstone. Restaurants and watering holes are the other key downtown components of this niche. The leadership’s aspirations for growth as a tourist destination are levelheadedly calibrated, focusing regionally on the NW Indiana market area in which they believe they already have significant recognition and penetration. Also, they seem to understand that entertainment events and opportunities will draw far more people than can just the performing or visual arts, though the performing arts are certainly given a significant place on the park’s event schedule (7).

Greenport, NY. To find the other informal entertainment venues I needed for this article, it seemed best to look at those in smaller communities that I knew about and liked. Mitchell Park in Greenport, NY was one of them. My wife and I have been going out to Greenport NY for day or weekend trips since 1988. Over the years, I had observed the troubled waterfront properties, then watched as they were turned into Mitchell Park and since stopped by the park on every return visit. I was taken by the fact that a community this small could complete such a large, complicated and attractive project. Victor Grgas and I gave a presentation at the IEDC’s 2006 annual conference in which Mitchell Park was one of three downtown projects I discussed. To prepare for that presentation, I interviewed several residents and local merchants as well Mayor David Kapell, who provided information about the park’s development challenges, costs, attendance and impacts. For this article I revisited the park in July 2014, when I spoke to the village administrator and people who were managing the marina and carrousel.

Greenport is located on the North Fork at the eastern end of Long Island. It has a significant waterfront with docking facilities for pleasure boats, a small fishing fleet and a ferry to Shelter Island. It also has the terminus for an important line of the Long Island Railroad located near the ferry and the park. Within easy drives of the village are over 40 wineries that attract heavy tourist traffic to their tasting rooms. There are three of historical sites abutting or near the park including a working blacksmith shop and a maritime museum. It is a significant tourist destination and transit point.

Greenport has a year round residential population of 2,200, but its daytime population increases significantly during the tourist season with transient guests and the return of second homeowners. While its median household income is $48,578, the spending power present in the community increases noticeably with the return of second homeowners and the influx of boat owners and other financially comfortable transient tourists. The seasonality of the local economy is reflected in many of the shops and restaurants closing for the winter, something that happens in many other tourist dependent communities. Only about 399 people normally are employed within 0.25 miles of Mitchell Park (8).

The properties that eventually became Mitchell Park occupied a geographically strategic position on the waterfront in the downtown’s core. They also were on Front Street, the village’s main entry corridor and close to or abutting the historic sites, the ferry, waterfront restaurants, the movie theater, the post office and many shops and eateries. Decades back, the site was occupied by a successful restaurant and marina business. In 1979 it burned down and the site remained blighted for over 15 years. It also had some serious brown field issues. It was viewed by many residents as a “cancer” on the community (9). The process to revitalize it took 14 years and was often arduous, conflictual, and political. After a design competition, SHoP was selected as the park’s designer. Its planning process had considerable public input. The development of the park was done in three phases and finally completed with the opening of the marina in September `2006.

After the post WW II closing of two shipyards and the decline of its fishing fleet, the village’s economy sputtered for decades. The Mitchell Park project was seen by many local leaders, especially Mayor Kapell, as a critical component of the village’s economic revival. Making the park a strong attraction for local children and families was understood, in effect, as a means of strengthening the village’s downtown as its central social district, as Greenport’s version of a Roman forum. That became the project’s primary goal. However, there were some local residents who argued for condo development on the site because of the potentially large tax revenues for the village (10).

Drawing more tourists was another important goal of the Mitchell Park project, with the business community pushing for a new marina as the means of achieving it:

“In addition to the park, the adopted plan included redevelopment of the shoreline of the property as a transient recreational boating marina and a major deep-water pier to accommodate tall ships and other large visiting vessels. This component was widely viewed by the business community as essential to strengthening the village’s increasingly tourist-based economy” (11).

The revived waterfront has certainly proved to be a strong asset for attracting tourists. For example, an annual three-day Maritime Festival reportedly draws about 40,000 visitors and the less frequent, multi-day Tall Ships events can attract over 60,000.

Somerville, NJ.  This borough, with a population of about 12,000, is the county seat of Somerset County, which has a population around 323,000. The county’s residents are relatively affluent. Their median household income of $98,571 squeaks them into the nation’s top income quintile. There is also a strong presence in the county of people in “creative class” occupations, though they tend to be the mature creatives who have nested and not so much the young, single hipsters. DANTH estimated that in 2011, about 39% of the county’s workforce were in creative occupations, as were 51% of its residents, the highest percentage for any county in NJ (12).

Somerville has a median household income of $72,271, placing it in the nation’s second highest income quintile. The borough was the second downtown in NJ to create a SID, NJ’s version of a BID, that is managed by the Downtown Somerville Alliance (DSA). However, for many years, its downtown’s revitalization did not keep pace with other communities such as Westfield, Englewood and Cranford. Recently, however, that pace has quickened, with some major mixed used projects, a new supermarket and a parking garage being either completed, under construction or planned. Downtown residential growth may be significant. One important factor in this surge of redevelopment is that Somerville will now have direct rail service to Manhattan on NJ Transit’s Raritan line. All over NJ, the provision of this service has sparked downtown residential development and a general lift in property values near the stations.

According to Beth Anne Macdonald, the executive director of DSA, Division Street is strategically important because: “It is located in the geographic heart of the Downtown, it was (and is) critical for it to be a heart full of life. It used to act as a visual and physical deterrent for foot traffic and it now acts as a magnet” (13). It is a two-block long side street that provided easy access to the local post office and commuter rail station that has 622 boardings per day. With an aging infrastructure, a 30% street level vacancy rate and a 50% rate for second floor commercial, it was considered a blight in an otherwise healthy downtown (14). In 2008, Division Street was designated as the arts district for Somerville and a pop-up art gallery event was created to combat vacancies.

In 2011, the Borough Council, municipal planner and DSA began to think about more substantial and permanent changes. This eventually resulted in the implementation of a plan to focus on one 420-foot long block, to be named Division Street Plaza. That block, the Plaza, was rebuilt in 2012 and closed to traffic for a trial period of one year. In effect, this created a trial pedestrian mall. In 2013, after that trial was officially deemed a success, it was closed permanently to traffic. A new one block long pedestrian mall was officially born. That does not happen too often these days.

During this birthing period, the DSA became increasingly responsible for the Plaza and instrumental for its success. It was designated as the Plaza’s manager, responsible for its events and maintenance, except for snow removal. Most importantly, it was the DSA that came up with the plan for programming the Plaza in terms of both events and infrastructure, and it was responsible for the plan’s implementation. In this regard, two big influences on DSA’s thinking were PPS’s Porch Project in Philadelphia and BP – the Plaza’s chairs, tables and umbrellas are just like those in BP. Remarkably, there had not been any planning about event and infrastructure programing until DSA took on the task.

Division Street Plaza caught my attention back in 2013 because its apparent success countered my long held skepticism about pedestrian malls. True, some of my favorite downtown places — e.g., Church Street in Burlington, VT, Fremont Street in Las Vegas and the Third Street Promenade in Santa Monica, CA are thriving examples of such spaces. However, I have witnessed many others that failed and still others that were deeply troubled at one time or another, e.g., the one block-long 165th Street Mall in Jamaica Center, NY. Furthermore, research has consistently shown that the vast majority of the pedestrian malls that were built — perhaps as many as 89% — had to be closed or repurposed (15)!

Some research indicates that pedestrian malls are more likely to succeed if they are:

  • Located near to or integrated with a major anchor such as a university or hospital
  • Close to a beach
  • Short in length, only 1-4 blocks long
  • In a town/city with a population under 100,000
  • Located in a major destination for tourists (16).

Based on my own field observations over the years, I also would argue that pedestrian malls rarely are the cure for a declining commercial corridor, an objective that motivated the creation of many, if not most, of them. Instead, when successful, pedestrian malls play a role akin to a supercharger in a car — not its engine — and allow a commercial corridor of modest success to provide visitors with a new, distinct and improved experience that produces even greater commercial success.

I have visited Somerville several times since the late 1980s, most recently in October 2013, when Macdonald gave me a tour of Division Street Plaza. She has since graciously responded to my information requests.

The Plaza’s success – that is supported by a number of indicators discussed below — makes it a rare, interesting bird. It also is a noteworthy example of a “third place” informal entertainment venue that was cobbled together and now operates on a relatively modest amount of financial and staff resources. However, recent research findings do not seem to adequately explain the Plaza’s success:

  • While short in length and located in a low population town, it lacks the types of very strong nearby anchors other observers have suggested are essential for a pedestrian mall’s success
  • The prior conditions on Division Street seemed to require a lot more than a “supercharger” to remediate.

One conclusion, though, seems certain: some very right things are being done to cause/facilitate/nurture the Plaza’s current success. My hunch is that the Plaza’s short length is definitely a factor as are the proximity of the Post Office and 2,100 downtown workers. However, the DSA and the Borough’s actions, in some ways, also have helped. The physical improvements and activation of the space through the Plaza’s events probably helped.  I suspect that the impact of the legitimation it received from its successful performance trial on the way the public saw and felt about it was another important factor — and one likely to be overlooked.

Division Street Plaza

Looking at the Three Essential Functions of Informal Entertainment Venues. Our analysis of BP as a model informal entertainment venue showed that such venues can perform three important and essential functions:

  • Providing visitors with a green refuge for resting in peace and quiet;
  • Providing infrastructure assets and programs that stimulate visitors to engage in activities (i.e., to “perform”)
  • To present events visitors can attend (17 ).

The Refuge Function. BP performs this function by providing lots of chairs, tables, attractive greenery and both shaded and sunny areas where people can sit, relax and observe.

Among these amenities, appropriate seating is the most basic. If you want people to stay in your informal entertainment venue, they will need a place to sit. As William H. Whyte wrote: “The most attractive fountains, the most striking designs, cannot induce people to come and sit if there is no place to sit” (18)

Smaller communities obviously have smaller populations, lower commercial density, lower pedestrian flows and less hustle and bustle. People who live in or visit these communities usually do so precisely because of these characteristics. Consequently, one might expect informal entertainment venues in these communities will have a much lower demand for and consequently tend to put a much lower priority on providing a refuge for peace and quiet. Many of them do just that. For example, Washington Borough, NJ, (population 6,460), recently opened a downtown pocket park that has no chairs, benches or tables and little shade. Still others provide some seating, but little shade.

Figure 16. Division Street Plaza's Cafe Tables and Bistro Chairs

Figure 16. Division Street Plaza’s Cafe Tables and Bistro Chairs

Division Street Plaza, though in a small town, probably has a need for refuge function amenities because it is a pedestrian mall. The successful pedestrian malls all provide these amenities. Also, DANTH very recently estimated that the Plaza’s integrated 30 businesses attract between 116,000 to 128,000 shoppers annually (roughly 380 to 420 per business day), many of whom may appreciate a place to rest or relax. The Plaza has the amenities to meet such needs: 16 cafe? tables, 64 bistro chairs, 8 market umbrellas, 21 planters and 13 hanging baskets (see Figure 16). Additionally, some Plaza eateries have outdoor seating.

These amenities have also helped improve the physical appearance of the block.

The “Engage in Activities” Function. Currently, this probably is the Plaza’s strongest function because it now is succeeding as a pedestrian mall. Visitors come to shop, dine, attend a dance or yoga class, see a doctor or accountant, etc. However, it is important to note that, as the prior blighted condition of this block indicates, this strength is dependent on something quite other than the mere presence of commercial activities. The creation of the Plaza has created an urban ecology that somehow has enabled commercial entities to be more prosperous and/or attract stronger firms. In turn, this has helped attract more visitors.

This integration of commercial activities into an informal entertainment venue is not confined to the pedestrian mall variant; BP and many other urban parks have food related enterprises present year round, while a growing number now have something akin to BP’s seasonal Winter Village of numerous retail and food operations occupying corridors of kiosks.

Aside from the limited opportunities provided by some events, such as the heavily child-oriented Festiville, the Plaza currently lacks other activity opportunities for visitors, though I believe seasonal ice-skating is being considered. BP offers a myriad of such opportunities, e.g., a carrousel, ping pong, petanque, chess and many other board games, and ice-skating. Mitchell Park has a carrousel, ice-skating and a shoreline walk. Grand Central Plaza has a spray pad and soon will be adding an ice rink and possibly “climbing art.” The DSA will face several understandable challenges, if it wants to expand its visitor activity opportunities. They are largely defined by the Plaza’s small physical size and the DSA’s relatively small budget: Where can the new activity opportunities be placed on the Plaza? How can their development and operations be funded?

While spray pads, carrousels, ice rinks, and shoreline walks require considerable costs to create and operate, it is interesting to note that none of the three informal venues analyzed here have provided the lower cost activity opportunities, e.g., ping pong, chess and other board games, boules, etc. found in BP. My suspicion is that it would be hard to justify the cost of the staff required to, for example, supervise the distribution and return of equipment given, the probable modest use levels and revenue potentials typical of these low density environments. A carrousel and ice rink can charge user fees and win sponsorships; rentals of chess sets and board games likely have far lower earning power.

BP involves related outside groups with a lot of its activities, e.g., chess, petanque, bird watching. Perhaps these informal entertainment venues in smaller communities can involve social organizations in their communities, e.g., local chess clubs, seniors groups, women’s organizations, etc.

Another possibility is the installation of equipment that is comparatively affordable, can be used directly by visitors and does not require staff to monitor or supervise. The climbing art being considered for Central Park Plaza is one possibility. Swings for adults are another (19). I’m sure they will raise questions about liability, but both have been installed in numerous public spaces in the US and Europe.

The “Present Events” Function. These events are probably the most visible part of DSA’s Plaza involvement. DSA runs events on 50 days during the year and reports they attract around 100,000 visitors annually. That averages to an impressive 2,000 people per event day. Events include movie showings, FestiVille (see Figure 17), art shows, concerts, a Farmers Market, a beer festival and holiday festivities. Macdonald also reports that:

“In addition to our own events, we have had several downtown businesses host events on Division Street as well as outside businesses come to us wanting to use it. We have an entire application process now for events (loosely based on Pioneer Square in Portland” (20).

Figure 17. The Plaza's FestiVille Event

Figure 17. The Plaza’s FestiVille Event

Most events are free, though modest fees are charged for things like children’s rides and petting zoos during Festiville.

Because the Plaza is an outdoor venue, its events schedule thins during the colder winter months. This is a problem that BP, Central Park Plaza, Mitchell Park and many other informal entertainment venues around the country also faced and, in response, all opened or will open ice rinks. The DSA, I believe, would like to follow suit. Because the Plaza is a pedestrian mall it has a version of BP’s Winter Village already built in.

Management and Budget. Of the three venues in small communities, the Plaza is the smallest in area and cost the least, about $675, 000, to create. Financing came from an NJ-DOT grant, municipal investment and DSA funding. However, while the NJ-DOT grant for $500,000 was awarded, it has not been paid and may not be, since the street was permanently closed. The Borough may be left with that funding responsibility, in which case, it may then try to offload the obligation onto the DSA.

The DSA, which is mainly funded by Special improvement District (SID) assessments, now manages the Plaza, responsible for its programing and maintenance. Just as happened with BP, the stewardship of the venue shifted sectors, from public to private. This shift certainly was fortuitous when it came to the Plaza’s programing, both event and physical. One of the most important contributions the DSA made was to broaden the Plaza’s positioning from being an arts district to an entertainment venue in which the arts would still have a significant role. This repositioning is consistent with national market trends and how BP, Grand Central Plaza and Mitchell Park are all positioned (21).

In my opinion, the Plaza venture probably would have failed without the DSA’s taking on its programming and management. The Borough, though, is to be commended for bringing about that shift.

According to the DSA, it spends about $62,500 annually on the Plaza, including staff costs. Again, this is the lowest of the three venues being analyzed. The DSA’s Plaza program, however, is relatively young and still establishing itself. I believe it is very likely that the DSA, in the near future, will want to provide more activity opportunities for visitors to engage in as well as to make its events even more robust. These improvements obviously will require additional staffing and revenues. Following the BP model as well as what Central Park Plaza and Mitchell Park have done, perhaps the DSA might then look to ways of monetizing its offering through fees, admissions, sponsorships, naming rights, etc.

The Plaza’s Impacts. The DSA has assembled a good deal of evidence about the Plaza’s impacts and I find them impressive, especially for a pedestrian mall:

  • Within two years the street changed from being blighted, somewhat scary and a pedestrian desert to a location where annually businesses are attracting 116,000 to 128,000 patrons and events are attracting about 100,00 visitors. It has transitioned from being a potent liability to a strong asset
  • Within 18 months of completion, the street went from having severe vacancy problems to a 100% first and second floor commercial and residential occupancy rate
  • Commercial offerings grew to include vintage clothing, bridal store, cigar bar, lingerie boutique, yoga studio, retro arcade, artisan shops, and ethic restaurants. Macdonald also notes that many of the newcomers are skilled merchants who also have locations in NJ’s suburban Class A downtowns
  • In all, 10 new businesses located on Division Street in less than two years creating 40 new jobs, generating $150,000 in construction permits and over $1,500,000.00 in total private investment (22)
  • The Plaza’s positive impact has apparently splashed beyond its boundaries. In a survey, 47% of the downtown’s merchants reported that they saw an increase of foot traffic since the Plaza opened. Potential tenant interest in nearby commercial spaces on Main Street is reportedly much stronger (23).

An interesting and important question is how much of Division Street’s economic improvements can be attributed to the creation and operations of the Plaza? After all, downtown Somerville is now experiencing a welcome wave of redevelopment. In response, Macdonald argues that these improvements all appeared before any of these other projects – e.g., a new supermarket and the multi-use Somerville Town Center – were completed.

Too often impact analyses use “multipliers” generated by input-output models. From a downtown revitalization point of view, it can be argued that the information DSA provided is far more relevant and probative than any multiplier generated analyses. The Plaza’s erasure of blight, its visitation numbers and lowered vacancy rates speak directly to the critically important status of downtown Somerville’s urban ecosystem — a system that is influenced by social, psychological as well as economic factors. In contrast, the “multiplier” determined estimates of the direct, indirect or induced impacts of the jobs and expenditures generated by the Plaza would speak mostly to a geographic area reaching well beyond the downtown, Somerset County, and to a short list of economic variables.

Many downtown organizations do not accumulate impact related information. Those, like the DSA, that are affiliated with a state Main Street program are much more likely to gather and use such information. Downtown managers, like Macdonald, who have experience recruiting retailers and developers, are also more likely to appreciate the value of such information and to gather it.

Central Park Plaza

Figure 18. Orville Redenbacher Statue at Entrance to Central Park Plaza, With Amphitheater in Background

Figure 18. Orville Redenbacher Statue at Entrance to Central Park Plaza, With Amphitheater in Background

Looking at the Three Essential Functions. Central Park Plaza (CPP) is a larger space, with more physical features than Division Street Plaza and has a significantly higher level of annual expenditures. As a celebration of Indiana born Orville Redenbacher and popcorn, downtown Valparaiso has been the location of a popcorn festival since 1979. From 2011, it has been held in CPP –in the above photo, that’s a sculpture of Orville sitting on a bench at the park’s entrance. The event is a very strong attraction – see Figure 19’s “before” photo of its September 2014 crowd. In 1999, the downtown business organization merged with the organization running the popcorn festival, and it is now known as Valparaiso Events (24). It runs the CPP’s events. Combining this organizational expertise with an attractive amphitheater, it is not surprising that the CPP currently performs these three functions with a very heavy emphasis on events.

Figure 19. CPP Before and After the September 2014 Popcorn Festival

Figure 19. CPP Before and After the September 2014 Popcorn Festival

The Refuge Function. Valparaiso’s population is roughly 2.6 times larger than Somerville’s and the downtown has serious aspirations of being a regional tourist destination. Added to this are the 2,472 people who are employed within a 5-minute walk of the park, a very important pool of potential noontime guests, and the uncounted folks who visit nearby city and county offices. Together, these factors point to a potential demand for seating where people can just sit, rest and observe The new downtown housing city leaders are hoping for could add to that potential demand. I would argue that tourists might especially appreciate that opportunity – even more so if tied in with access to clean and safe restrooms. The number of refuge seeking visitors to CPP may never be more than small fraction of BP’s, but for downtown Valparaiso, it still could be significant. However, currently there are no available data on how many people visit CPP just to rest and relax in a pleasant green location.

As can be seen in Figure 19’s “after” photo, there are a number of benches placed throughout the park. CPP also has restrooms. Most of the seating now is in sunny areas, but that will probably change as this young park’s young trees grow. The CPP’s warmer weather shaded area will also grow when a key feature of the park’s expansion, a “Pavilion,” is completed. It will shelter a skating rink during the colder months.

The “Engage in Activities” Function. The CPP’s strongest current infrastructure feature for stimulating visitors to become active and perform is a spray pad for children, see Figure 20. Unfortunately, there are no statistics on how many children use the spray pad.

Figure 20. CPP's Splash Pad. Photo by SEH

Figure 20. CPP’s Splash Pad. Photo by SEH

The new skating rink to be built in CPP’s Phase 2 will certainly strengthen the park’s assets in this functional area. It will also give people a good reason to visit the park during its currently slow winter season.

Consideration, at one point, was given to adding climbing art during the park’s expansion as another attraction for children. If that idea has been discarded, I hope that some other feature that can activate children, preferably year round, will be adopted.

Shopping opportunities are available at the Central Park Plaza Market two mornings a week, June through September. The Market offers: “fresh local produce, handmade products and beautiful plants and flowers” (25).

There are several in-event opportunities for people to be active, not just passive audience members. They seem to especially revolve around eating and drinking: e.g., the Popcorn Festival, the Valparaiso Brewfest and the Valparaiso Wine Festival.

CPP has also become a popular location for private events in which attendees might be active, such as weddings, parties, business meetings, church services, etc. The CPP is rented out for these occasions through the Valparaiso Department of Parks and Recreation (VDPR). The CPP’s expansion will include a new building for skate rentals and for holding these private events year round.

Figure 21. A Concert on CPP's Porter Health Amphitheater. Sale of Naming Rights is an Important Source of Income.

Figure 21. A Concert on CPP’s Porter Health Amphitheater. Sale of Naming Rights is an Important Source of Income.

The “Present Events” Function. Today, this is the CPP’s strongest informal entertainment venue function. The attractive amphitheater (see Figure 21) is a critical asset for holding successful events and, through naming rights, an important source of income.

According to Valparaiso Events, CPP is the site of events on 80 days during the year and last year they attracted about 130,000 people. That was a very substantial increase over the 100,000 of the prior year (26).

In 2014, the CPP’s events included: Central Park Plaza Market, outdoor movies, Summer Rhapsody Music Festival, Summer Jam Music and Food Festival, Valparaiso Wine Festival, Valparaiso Popcorn festival, Valparaiso Brew Fest, the Great Downtown Tailgate, Fall Harvest Festival, and Holly Days.

In other years, plays have been performed on the CPP’s stage and I believe one is scheduled for 2015. However, within about a 3-minute walk of the CPP is Valparaiso’s Memorial Opera House. Its website calendar indicates that it has about 40 to 50 performances a year, including musicals, symphonic and chamber orchestras, cabaret type events, etc (27). Though there is some overlap between what the CPP and the Opera House do, they appear to differ in some important ways:

  • Most of the Opera House performances occur during the cooler months when the CPP’s event schedule is leaner
  • The Opera House’s events lean toward the arts, while the CPP’s focus more on broader entertainment.

As is the case with the vast majority of informal entertainment venues, admission to most of CPP’s events is either free or low cost. However, a few events have a kind of stratified admissions structure with fees reaching into the $30-$60 range (28). These higher admission fees surpass those for the Opera House’s performances, may appear at odds with the solidly middle incomes of local households, and, more generally, are unusual for an informal entertainment venue. This type of fee structure poses some interesting questions about if and when less affordable fees for admission or participation in an event (e.g., higher fees open access to more expensive beers and wines or better seats) are appropriate for a municipal venue.

According to Tina St. Aubin, the executive director of Valparaiso Events:

“Most of what we do is family friendly, and most of what we do is also free to attend. We have a few ticketed events but those funds help keep everything else free. So when someone buys a ticket they are indirectly helping the market, the movies, everything else we do” (29).

Adequate funding for venues such as the CPP is always an important issue and many – e.g., BP and Mitchell Park – have also tried to develop streams of earned income. Without such revenue, the venue’s attractions, drawing power and service to the community would be severely diminished. As St. Aubin argues, the CPP’s higher fees make a number of other events financially feasible.

Nevertheless, the friction between a venue’s need for earned income and the public’s need for affordable admission fees is not one that I think can be settled permanently. Venue managers probably will continually have to grapple with it based on the array of current economic, social and political conditions they face.

Management and Budget. By the 1970s, In NYC and many other cities, parks owned by the municipality had fallen into decline with the local government being unable to manage or fund their proper maintenance and improvement. In response, nonprofits emerged to take over the physical maintenance and programming of the parks based on their abilities to use effective management techniques and to mobilize substantial funds from the private sector. While the municipality retains title to parks and may contribute funds and some services, these nonprofits really run these operations. The Central Park Conservancy and BP are two good examples of this trend in NYC.

Public Private Partnership. In Valparaiso, a kind of hybrid model has been adopted for managing the park in which the public sector has a stronger role. The Valparaiso Department of Parks & Recreation (VDPR) has responsibility for the overall management of CPP, its physical maintenance and renting it out for private events, e.g., weddings, parties, etc. Valparaiso Events, a nonprofit that basically has the mission of marketing the downtown, has been brought in to handle the CPP’s events that are open to the general public. This arrangement is a great example of a public-private partnership, one that inherently acknowledges and capitalizes on the relative strengths and weaknesses of each sector in Valparaiso. It also shows that the strengths of the public and private sectors may vary considerably in different communities, with accompanying important implications for the management organizational model best suited for the local informal entertainment venue.

These Are Significant Organizations. These two organizations provide CPP with the organizational capability that is essential to its success. VDPR manages several parks and two golf courses. It is not negligible in size or annual expenditures and has many business-like operations. It has 28 full-time employees, 185 part-timers and, many, many volunteers (30). Its expenditures in 2013 totaled around $3.6 million. The VDPR knows how to run earned income operations. Earned income is an important part of its revues, with fees bringing in about $1.35 million annually (31).  John Seibert, VDPR’s director, reports that fee-based revenues from the CPP cover almost all of his department’s $100,000 annual operational costs for the venue. The naming rights for the CPP’s amphitheater now brings in about $67,500 annually, but Seibert believes that soon could increase substantially. I was surprised by how much income naming rights could raise in a city of Valparaiso’s size. Other communities with downtown informal entertainment venues might want to take a closer look at this revenue source.

Its CPP partner, Valparaiso Events, also is not of negligible size for a downtown organization in a city having a population of 32,000. It has annual expenditures of $663,000, with at least half probably going to support CPP events. During the event busy summer, it has five full-time employees, with two full-time and two part-time during the rest of the year (32). According to St. Aubin: “The city gave Valparaiso Events a $175,000 grant for 2013. Other funding comes from sponsorship, membership and event revenue” (33).

Together, the VDPR and Valparaiso Events annually spend over $460,000 on the CPP.  This is a relatively substantial budget. My sense is that  both organizations are consequently trying to find new earned income streams and increasing the yields of existing ones. The CPP’s expansion may provide good opportunities to do that with:

  • The ice skating and skate rental fees
  • Increased rental fees from private events that will able to be held year round; the new facility also will allow more complex and higher revenue producing private events, possibly like a catering venue
  • A large shaded space that can be used, instead of tents, for summer public events, and its increased weather protection and fire pits might increase the number of months in which they can be held.

Funding the CPP’s Construction and Expansion.  Phase 1 of the CPP cost about $3.256 million (see Figure 22) and it came from four basic sources. Two of them were local and accounted for 52% of the total: about $1.5 million in TIF funds (47%) and around $160,000 in private donations (5%). Federal stimulus funds of about $226,000 accounted for 7% of the total. Major Moves, a State of Indiana program, contributed about $1.347 million, 41% of the total.

Figure 22 CPP Construction Costs

The cost of Phase 2 is more than double that of Phase 1, around $8 million. All of it will be raised from local sources. One family has already donated $3 million and other private donations are expected to raise another $1 million. The remaining $4 million will come from TIF funds.

While few smaller communities might expect similarly large private donations, many are in states where the TIF legislation allows this incentive to be effectively used, even in smaller communities. Indiana type TIF laws in NJ and NY would have made the funding to create Division Street Plaza and especially Mitchell Park much easier and more certain.

The Impacts of Central Park Plaza. When I asked Patrick Lyp, the city’s Economic Development Director, for data related to the impacts of the CPP, he replied that they did not collect them in any formal way because the downtown had seen a lot of projects and it would be hard to isolate which had what kind of impacts and how much of each impact could be attributed to the CPP.  For example, all the city officials I spoke to felt that their ability to get more “3-way” liquor licenses enabled the downtown to attract more and stronger eateries and watering holes, which now anchor the downtown’s hospitality niche  and they, in turn, also have had a great impact on the downtown’s ability to attract visitors, other firms and new investors. Today, they also have a mutually reinforcing relationship with the CPP. He and the other city officials, however, felt very certain that the CPP’s impact was very positive and very strong. While Lyp did not have statistics on before and after rents, vacancy rates, new jobs or investments, etc., he knew, from what he has personally heard and observed, that the CPP is extremely  popular among city residents and in the downtown business community — and the large crowds its events attract are undeniable evidence of this. But how much of the increased interest in investing in downtown projects, or the almost full occupancy of downtown housing can be attributed to the CPP or the new eateries and watering holes or to the new liquor licenses he felt was hard, if not impossible, to determine.

These Valpo city officials correctly put their fingers on the serious “attribution” problem that so often arises in downtown impact analyses.  Their position also spotlighted that downtown impact analyses must look at a lot of other variables besides sector jobs and sales that are well beyond the scope of an I-O economic model.

Mitchell Park

Figure 23. Aerial View of Mitchell Park .

Figure 23. Aerial View of Mitchell Park .

Looking at the Three Essential Functions. Mitchell Park (MP) stands out in a number of respects from the two other informal entertainment venues in this analysis. Though located in, by far, the smallest of their three communities, MP has the highest attendance, about 390,000/yr. In part, this is because it alone has the development gold of an active waterfront (see Figure 23) and the strong tourist traffic that can bring. It was the most expensive to create and very probably is the most expensive to operate. However, MP has the strongest earned revenue streams, and they very probably cover most of the park’s annual expenditures.

This array of factors has helped sculpt both the degree and manner in which MP performs the three essential functions of an informal entertainment venues. For example:

  • The “engage in activities” function is dominant in MP anchored by an antique carrousel, a marina, a waterfront walk and a wintertime ice rink (see Figure 23)
  • The refuge function has a much more obvious presence in MP than in the other two informal venues
  • There is no venue management organization, such as the DSA and Valparaiso Events, that runs the events in the park, yet MP is a location for a good number of events.

The “Refuge” Function. Given Greenport’s small population, on summertime visits I expected that. except for event days, I would be likely to find a pretty empty park,  save for those few who might be riding the carrousel or going to and from from their boats in the park’s marina. I did not expect to see the numbers of people sitting, resting, relaxing, observing other visitors, looking at the waterfront scenery or the rest of the park. Their numbers certainly did not rival BP’s level of refuge seekers, probably never exceeding 25 or 30 people. Nevertheless, they were enough to make MP look active and attractive. The photos in Figures 23 to 26 were taken over the same Friday afternoon last July in different parts of MP.

Figure 24. Resting and Relaxing UnderTrees by the Carrousel House.

Figure 24. Resting and Relaxing UnderTrees by the Carrousel House.


Figure 25. Resting and Relaxing by the Marina

Figure 25. Resting and Relaxing by the Marina


Figure 26. Resting and Relaxing on the Shaded Benches.

Figure 26. Resting and Relaxing on the shaded benches.

My MP field observations found that,  just as in BP, shaded seating areas were greatly appreciated by a lot of people and that some benches were never used because they were never shaded. Many of the visitors were local residents, with a high proportion of them being teenagers. However, a large number of the MP visitors were also tourists. To me, this all suggests that, despite their communities’ low populations and cultural  aversion to urban hustle and bustle, outdoor small town informal entertainment venues need to have the infrastructure to perform the refuge function, just as do their larger cousins. This means ample comfortable seating, with a large portion of it shaded.

The “Engage in Activities” Function. This is MP’s strongest function. The antique Carousel is probably its strongest attraction, with 100,000 riders annually that generates  $200,000 in revenues from ticket sales. It was built by the Herschell-­Spillman Company in 1920 and donated to the village by the Northrop­ Grumman Corporation in 1995. It is open most of the year, though its hours are reduced during the colder months.

Figure 27. The antique carrousel was built in 1920 and donated to the Village in 1995.

Figure 27. The antique carrousel was built in 1920 and donated to the Village in 1995.

The carrousel is an obvious attraction for tourists during the summer, but it probably still draws from eastern Suffolk County when open during the colder months.

However, the park’s biggest money maker is probably its marina. It has become very popular among boaters. I would not be surprised to learn that the marina’s revenues exceed $500,000/yr.

The park’s main draw during the winter is its ice skating rink (see Figure 28). Having a children’s hockey league and renting it out for parties increases usage at a time of the year when skaters are likely to come from the Village or nearby.


Figure 27. Ice Rink in Front of the Carrousel House.

Figure 28. Ice Rink in Front of the Carrousel House.

Another activity generating feature is Harbor Walk. It runs through the entire park and links it to the ferry, train station and Maritime Museum on its western flank and piers and commercial establishment on or near Main Street to its east.

Figure 29 shows part of this walk — and one of the probably unintended uses of this park. On several visits over the years, I have noticed that teenagers have found the park’s varying topography and surfaces make it an irresistible  place for riding their bikes.

Figure 28. Unintended Uses

Figure 29. Unintended use?


Figure 30. The park's unique camera obscura

Figure 30. The park’s unique camera obscura

In Victorian England, many estates had “follies,” a term used to describe “extravagant buildings that serve no purpose.”  However, in more modern times, follies often have proven to be “curiosities” and something of a tourist attraction. One of MP’s intended activity opportunities, its camera obscura,  seems to have turned out to be a folly/curiosity. Housed in a pleasantly mysterious looking, windowless building, this optical device, with a 2,000 year old ancestry, is able to capture something akin to a photographic image of the outside. MP’s is one of the few in the world putatively open to the public. However, in all of my visits to MP, I have never, ever seen anyone going in or coming out of that building. That is probably because It is only open by appointment and if the weather permits. But, the camera obscura does seem to have some strength as a curiosity; I have often heard people ask about that “funny looking building.”

My hunch is that local leaders may be proud of having such a rare device in the history of photography, but find it a pain in the butt to make it more accessible to the public, given the combination of entailed staff costs and probable modest demand for its use. In contrast, for example, both the carrousel and the marina are staffed – but, they generate revenues that probably are more than sufficient to cover these staff costs.


The operating hours of the Maritime Museum and Blacksmith Shop, both located very close to MP, are also rather sparse and probably also explained by the probable low demand and staff costs. Over he years, I have visited a number of other small town museums and other attractions in NY, VT, MA, OH, WI and NC that are similarly hindered.

Greenport’s Farmers Market does not use Mitchell Park. There also are no BP-like commercial activities in the park. Attempts to establish them would probably provoke strong opposition from nearby merchants.

Much like Central Park Plaza and Division Street Plaza, MP does not offer the type of activity opportunities that have relatively low capital costs, such as board games, ping pong, boules, etc. The associated staff cost is probably one strong explanation. Counter intuitively, these three examples suggest that capital costly activity opportunities now are more viable in small town informal entertainment venues than the less expensive ones because they can generate enough revenue to cover staff costs. However, this might be countered by providing facilities that do not require staffing such as adult swings (see Figure 31) or climbable art.

Figure 31. Swings for adults in Tel Aviv

Figure 31. Swings for adults in Tel Aviv

Similar to Valparaiso’s Department of Parks and Recreation, the administration of the Village of Greenport is experienced in managing operations that yield streams of earned revenues. In 2013, the Village’s electric, water, sewer and recreation operations had revenues around $6.14 million; recreation accounted for about 17% of the total  (34). Small towns with comparable municipal management experience and capability are probably good candidates for successfully developing and operating streams of earned revenues for their informal entertainment venues.

The “Present Events” Function. Communities of Greenport’s size tend to have relatively few business establishments. Even those that swell in number during the tourist season are inclined to thin in the off- season. Consequently, their local business organizations usually have modest budgets, little or no paid staff and limited capabilities to carry out programs and events.

The local chamber for Greenport, officed in Southold, is the Greenport Southold C of C. It is nested within the larger North Fork C of C – evidence that chamber type functions need to have a larger geographic area from which to draw members, if the organization is to be financially viable. However, there is the Greenport Village Business Improvement District. It has been around at least since the early 1990s (35). For a BID, it has a very modest annual budget of about $45,000, of which about 20% ($9,000) is “allocated for a marketing/social media/public relations program” (36).

With this very limited budget and apparently no paid staff, the BID has adopted the strategy that very savvy BID directors employ when faced with meager resources: they get someone else to do it. On its page on the Village’s website, the BID announces: “Event Funding: Greenport Village Improvement District offers funding for events that benefit the Village” (37). That offer does not mean that the events will be entirely funded by the BID, but the offered dollars could provide the needed incentive for other organizations or individuals to put on events in the Village and probably in MP.

Other organizations do get involved in MP’s events. The North Fork Chamber, for example, held an arts show in MP a few years back. However, the organization that apparently leads the charge on the most important events held in the Village, the Maritime Festival and the Tall Ships, is the East End Seaport & Marine Foundation. It acts in partnership with the Village of Greenport and the BID on these events. The foundation also runs the Maritime Museum and Blacksmith Shop in Greenport.

The Maritime Festival is quite complex. It …”attracts over 40,000 people annually, features nautical arts & crafts, classic wooden boats,  activities for children and families, music, pirate shows, local produce and seafood, wines and craft beer, fireworks, and excursions to Bug Light, (the foundation’s) lighthouse” (38).

Figure 32. Dancing in Mitchell Park. Katharine Schroeder Photo

Figure 32. Dancing in Mitchell Park. Katharine Schroeder Photo

Figure 33. Greenport Band concert in MP

Figure 33. Greenport Band concert in MP


Figure 34. Maritime Festival activities in MP

Figure 34. Maritime Festival activities in MP


Figure 35. The inverted use of the park's amphitheater

Figure 35. The inverted use of the park’s amphitheater

The Tall Ships events do not occur annually. The last one was in 2012 and the next one will be on the July 4th weekend of 2015. However, they attract the most visitors, an estimated 60,000 for the multi-day event. Greenport apparently has significant recognition among the tall ships. Next July it will be visited by the Hermione, a replica of Marquis de Lafayette’s 18th century frigate. The other ports the Hermione will visit are: Yorktown, Va.; Washington, D.C.; Annapolis, Md.; Baltimore, Md.; Philadelphia, Pa.; New York, N.Y.; Boston, Mass.; and Halifax, Nova Scotia (39). Not bad company for Greenport to be in.

The Maritime Festival and the Tall Ships are events too big to be confined to MP, though it definitely is a location used by them. However, it seems very likely that most of their very large crowds would walk through the park at some time during their visit, given its strategic waterfront location and attractiveness.

The Village’s calendar over the summer indicated that the park was used for two recurring events:  public dancing in the park (see figure 32) and concerts by the Greenport Band (see Figure 33).  From the information I have been able to gather, MP seems to have less than 30 event days in 2014, but the attendance on some of the days associated with the Maritime Festival and Tall Ships may be in the 5,000 to 10,000 range.

MP has an amphitheater that is basically a very large tiered area with bench-like seating that faces the marina and harbor. It lacks a formal stage, such as the one in Valparaiso’s Central Park Plaza. That has led to situations such as the one pictured in Figure 35. Some events, e.g., dancing in the park, do not use the amphitheater at all.

Management and Budget.
When I asked the village administrator about MP’s budget, he replied that the park was not an entity that the Village’s financial system reported on. I thought this was telling:

  • On one hand, from our brief conversation, I am pretty sure that they know how each of the park’s “enterprises” (carrousel, marina, ice rink) are doing on a profit and loss basis
  • Yet, there apparently is no one person like a Dan Biederman, a Beth Anne Macdonald or a John Seibert who is managing an organization that is charged with taking overall care of the park
  • This was consistent with the decentralized way that events are done
  • Perhaps the Village’s governmental structure is so small and the park is so important that overall responsibility and supervision is in the hands of the mayor, the village administrator and the village board
  • The park shows little sign of failure or decay.  All signs indicate a continued success
  • This all can happen in Greenport, because it is so small that interpersonal networks where everybody knows everybody can be meshed with a small group of political and administrative decision-makers who have the needed competencies — or know how to acquire them.
Piecing together various bits of information, my guess is that MP’s annual income exceeds $700,000 and probably operates in the black.The funding for building MP, which occurred in three phases, was very complicated. It came from three types of sources. One was the Village, which had plenty of skin in the game. The Village spent a total of $4 million of its own money on the $14.9 million project. It also acquired part of the the site from a bank that had foreclosed on the property, using funds raised from a $1.2 million general obligation bond offering. Park development was also funded with $1.5 million from the Village’s Capital Improvement Fund.

Grants were another source, and they provided most of the money. The Village obtained 25 grants from a wide range of local, state and Federal agencies. One can only imagine the time, energy and money this required. The need for fewer grants might have also significantly cut the time needed to complete the park. 

Finally, there was some private funding.The estate of Pauline Mitchell, of the family for which the park is named, provides funds  for park maintenance. The Northrop Grumman Corporation donated a full-sized, antique carrousel that has become a critically important park attraction (40).

Figure 36. Next to MP is the 35 room Harborfront Inn that opened in 2004, induced by the park's creation

Figure 36. Next to MP is the 35 – room Harborfront Inn that opened in 2004, induced by the park’s creation

Mitchell Park’s Impacts. 
Induced by the creation of MP,  a new 35-room motel, the Harborfront ( see Figure 36), was built before the final Phase 3 work on the park was completed in 2007. Together, they improved the waterfront and filled some very unattractive holes in a long blockface on the important Front Street downtown entryway that also has the post office and the town’s movie theater. The improved appearance certainly made this part of downtown Greenport a more desirable business location. My observations, which friends living in the Village support, are that the quality of the nearby retail shops and eateries have improved since work on MP was completed. MP’s attractions — e.g., the carrousel and ice rink — also have drawn visitors from well beyond the Village’s borders in eastern Suffolk County. However, I cannot provide statistical information to support these observations.

The limits of MP’s possible impacts are demonstrated by this essential fact: many of Greenport’s merchants still close during the colder months because there is not enough customer traffic for them to stay open.

Over the past 15 to 20 years, the North Fork of Long island has become increasingly popular as a place to visit and own second homes. This, too, has had an impact on business and real estate conditions in downtown Greenport. As a consequence, any analysis of MP’s impacts will have a significant attribution problem: how much of an impact can be attributed to the park, how much to regional economic growth?

ENDNOTES

1- See Pt 1: https://www.ndavidmilder.com/2014/08/bryant-park-the-quintessential-downtown-informal-entertainment-venue-part-1.html

Pt 2: https://www.ndavidmilder.com/2014/09/bryant-park-part-2-a-comparison-to-other-entertainment-venues-on-attracting-tourists-user-frictions-and-costs-to-create-or-significantly-renovate.html

         Pt 3: https://www.ndavidmilder.com/2014/11/bryant-park-part-3-a-comparison-to-other-entertainment-venues-on-annual-expenditures-and-annual-expenditures-per-visitor.html

2- Tim Halbur, George Haugh, Ethan Kent, Sarah Goodyear, “The Top 100 Public Spaces in the U.S. and Canada,” Planetizen, October 27, 2011, http://www.planetizen.com/toppublicspaces

3- I want to thank John Seibert, Director of the Dept of Parks and Recreation; Patrick Lyp, Economic Development Director; Bill Oeding, City Administrator and Tina St. Aubin, Executive Director of Valparaiso Events for their assistance and cooperation.

4- Census Bureau, OnTheMap

5- From Chambers website: http://www.valpochamber.org/community/index.php

6- Pam Antonetti, “Groundbreaking Held for Central Park Plaza Expansion,” Valpolife,com, Spet 29, 2014, http://www.valpolife.com/community/parks/46238-groundbreaking-held-for-central-park-plaza-expansion

7- Personal and phone conversations with Valparaiso officials.

8- Census Bureau’s OnTheMap

9- David Kapell, “Creating The ‘There’ In Greenport,” Build A Better Burb at http://buildabetterburb.org/creating-the-there-in-greenport/

10- Telephone interview with David Kapell.

11- See endnote #9.

12- N. David Milder, “So…Surprise! You have a lot of suburban creatives…” The Downtown Curmudgeon, July 3, 2013, https://www.ndavidmilder.com/2013/07/so-surprise-you-have-a-lot-of-suburban-creatives.html

13- Email from Beth Anne Macdonald

14- Ibid.

15- See: Cole E. Judge, “The Experiment of American Pedestrian Malls:Trends Analysis, Necessary Indicators for Success and Recommendations for Fresno’s Fulton Mall,” Downtown Fresno Partnership, November 11, 2013.

16- Ibid

17- See Bryant Park Pt 1 referenced above in endnote #1.

18- Cited in Lawrence Houstoun, “Watching All the Crowds Go By” http://lhoustoun.wordpress.com/public-spaces/chapter-2-watching-the-crowds-go-by/

19- See: Winnie Hu, “Mom, Dad, This Playground’s for You,” New York Times, June 29, 2012. http://www.nytimes.com/2012/07/01/nyregion/new-york-introduces-its-first-adult-playground.html?pagewanted=all&module=Search&mabReward=relbias%3Ar%2C%7B%221%22%3A%22RI%3A7%22%7D

20- Email from Beth Anne Macdonald. I also want to thank Beth Anne for all the information she provided as she patiently responded to my questions.

21- See: N. David Milder, The New Normal’s Challenges to Developing a Downtown Entertainment Niche Based on Formal Entertainments: Part 2 the audiences ,The Downtown Curmudgeon, https://www.ndavidmilder.com/2014/03/the-new-normals-challenges-to-developing-a-downtown-entertainment-niche-based-on-formal-entertainments-part-2-the-audiences.html

22- Email fromBeth Anne Macdonald.

23- DSA’s 2013 Community Survey, n=600.

24- Heather Augustyn, “History of Valparaiso Events – Past, Present and Future,” nwitimes.com, September 04, 2014. http://www.nwitimes.com/news/local/porter/valparaiso/history-of-valparaiso-events-past-present-and-future/article_34213756-41a7-5544-8e49-eeba164a0be6.html

25 – http://www.valparaisoevents.com/central%20park%20plaza%20market/

26 – Telephone conversation with John Seibert

27 – See: http://www.memorialoperahouse.com/events

28 – See for example: http://valpobrewfest.com/main.html . Note the mention of VIPs.

29 – See endnote #24

30 – Valpo Parks 2013 Annual Report

31 – ibid.

32 – Se endnote #24

33 – Email from Tina St Aubin.

34- Incorporated Village Of Greenport, New York Financial Report, May 31, 2013, p. 17,  http://villageofgreenport.org/annual-financials/Final%20Fin%20Stmt%20Greenport%202013.pdf

35 – See: http://www.greenportvillage.com/business-improvement-district/    .

36 – Jen Nuzzo, “New Greenport BID board members elected,” The Suffolk Times, 11/25/2012,http://suffolktimes.timesreview.com/tag/greenport-bid/

37 – See endnote #35

38 – See: http://www.greenportvillage.com/maritime-festival/

39 – Jen Nuzzo, Replica of Lafayette’s ship Hermione visiting Greenport at Tall Ships, The Suffolk Times, 11/14/2014       http://suffolktimes.timesreview.com/2014/11/53887/lafayettes-ship-hermione-visiting-greenport-at-tall-ships/

40 –  Funding information from 2006 telephone conversation with Mayor Kapell

© Unauthorized use is prohibited. Excerpts may be used, but only if expressed permission has been obtained from DANTH, Inc.

Posted in BIDs, Central Social Districts, commercial nodes, Creative Class, Downtown Niches, Downtown Redevelopment, Economci Development, Entertainment, Entertainment niche, Entrepreneurship, Formal entertainment venues, Informal entertainment venues, Innovations, New Normal, Pedestrian traffic, Planning and Strategies, Public Spaces, Small Towns, Suburban Downtowns, The Arts |

Bryant Park: Part 3: a comparison to other entertainment venues on annual expenditures and annual expenditures per visitor

Posted on November 26, 2014 by DANTH

Posted by N. David Milder

Introduction

Part 1 of this article focused on describing Bryant Park as a model informal downtown entertainment venue through its performance of three key functions:

  • Providing visitors with a pleasant, green refuge from a downtown’s hustle and bustle
  • Offering opportunities for visitors to actively engage in fun activities, with their resulting performances entertaining nearby people watchers
  • Holding entertaining events for park visitors that are performed al fresco, often on multi-tasked locations within the park, using temporary infrastructure, e.g., stages, movie screens, ice rinks, seating, etc.

Part 1 also demonstrated that Bryant Park is a very strong entertainment attraction for the Midtown Manhattan CBD. In terms of annual attendance, it either closely rivals or surpasses such world-class formal entertainment venues as the Lincoln Center for the Performing Arts (LCPA), the Metropolitan Museum of Art (Met), the Museum of Modern Art (MoMA), Madison Square Garden (MSG), Yankee Stadium and Citi Field. Bryant Park’s magnetism demonstrates the powerful contribution an informal downtown entertainment venue can provide for a district’s entertainment niche as well as its economic well-being.

Part 1 can be found at: http://lnkd.in/d-KKyw6

Part 2 focused on:

  • Bryant Park’s comparative strength as a tourist attraction in NYC
  • Its user frictions compared to other major NYC entertainment venues
  • The cost of its rebirth in 1992 compared to how much it cost to create 18 other significant entertainment venues or to do a major renovation of them.

Part 2 can be found at: http://tinyurl.com/mkkqo37

Here in Part 3, the discussion will continue the comparison of Bryant Park to other entertainment venues by comparing the total annual expenditures of the corporation that operates Bryant Park to those of the organizations that operate 20 other formal and informal entertainment venues located across the nation.

The upcoming Part 4 will focus on three informal entertainment venues in small and medium sized communities. A discussion of entertainment venue economic impacts will follow in Part 5.

Comparing the Annual Expenditures of Formal and Informal Downtown Entertainment Venues. 

Figure 14 with title 112814

Why Entertainment Venue Expenditures Are Important. Downtown leaders working to create or expand an entertainment niche probably will want to look at how much money the various types of new entertainment venues will likely need to take in annually, since it is a good indicator of the amount of money that will have to be raised annually through: earned income, grants from governments, foundations and businesses and individual gifts and donations. This will likely impact on their financial feasibility.

The Hypothesis. Based on many years of field observations, DANTH, Inc. developed the hypothesis that the organizations that run formal entertainment venues (e.g., PACs, theaters, arenas, stadiums, etc.) usually have higher annual expenditures than those that are responsible for informal entertainment venues (e.g., Bryant Park, other public spaces and third places). If true, this finding probably should be an important consideration for any downtown that is formulating a strategic plan to create or expand an entertainment niche — especially in locations where financial resources are likely to be scarcer (e.g., in small and medium sized communities or in cities lacking a significant affluent population). The data in Figure 14, though they admittedly represent a very small sample, are presented because I believe they nevertheless shed some light on the viability of this hypothesis.

About the Data. The data in Figure 14 are related to the annual expenditures of the organizations that run 13 formal and 8 informal entertainment venues in towns and cities, large and small, though the largest number,7, are located in NYC. The selection of venues was mainly based on the reasonable availability of the data; statistics about other venues might have been obtainable with a lot more time and effort that I unfortunately could not afford to invest. I have personally visited 19 of the 21 entertainment venues presented in Figure 14.

The data in Figure 14 were mainly collected from the website postings, annual reports, IRS 990 filings or economic impacts studies posted by the venues listed. They are mostly for a recent year in the 2011-2014 period, but a venue’s expenditure and attendance data points were not always for the same year. Data for Discovery Green came from the PPS website. The data for the three smaller informal entertainment venues are based mostly on site visits and interviews with local officials. The Mitchell Park data are DANTH estimates, since the Village does not break out expenditures for the park in its financial reporting. The expenditure number is taken from a recent village financial report and is the total amount spent on recreation by the entire village for that year. Given that the Village also has a campground and four other parks and playgrounds, it is plainly an overestimate of Mitchell Park’s expenditures. However, that helps make the conclusions of the ensuing analysis conservative. The Mitchell Park attendance data were given to me by the then mayor in 2006. Recently, the Village official in charge told me that the park’s carrousel has about 100,000 users per year. Our counts of carrousel and non-carrousel users on day visits in the summers of 2006 and 2014 were then used to recalibrate the attendance number. That recalibration produced a number that was pretty close to the 2006 number. Consequently, we decided to stick with it. The attendance estimates for Division Street Plaza in Somerville, NJ, and Central Park Plaza in Valparaiso, IN, are only for events, which are their strongest draws, but they consequently under report, to some unknown degree, total attendance. Local officials in both Somerville and Valparaiso provided a wide range of information, much of it in emails and personal and telephone interviews. The Millennium Park expenditures data combine information provided by the city about its expenditures with a DANTH extrapolation from a prior foundation report that discussed the private sector’s annual expenditures.

Many of the organizations that run these entertainment venues, such as the Bryant Park Corporation, are dedicated solely to the management and stewardship of their particular entertainment venue. Others have missions that cover other entities and functions. Lincoln Center for the Performing Arts, for example, is not only a cluster of performance venues, but also contains two professional schools, operates arts education programs that cover the city and now has its own informal entertainment areas. Similarly, Division Street Plaza is managed under just one the Downtown Somerville Alliance’s many programs. A few are operated by two organizations. For example, Central Park Plaza is part of the Valparaiso Department of Parks and Recreation which takes care of the park’s physical needs and leases it for weddings, parties and business meetings, etc. However, the main drivers of this park’s attendance are the 80 days on which events are held, and they are managed by a nonprofit, Valparaiso Events. In these instances, information is presented in two ways: first the expenditures for the entire “parent” organization(s) and then with the organization’s expenditures just for that entertainment venue.

Two of the primary objectives fueling downtown efforts to create or improve an entertainment niche are to bring more people downtown and to encourage visitors to stay longer. Consequently, the third column in Figure 14 presents the annual attendance for each of the 21 venues, and the fourth column provides a computation of the managing organization’s annual expenditure per visitor

The lack of uniformity in data collection means that there probably are error factors. I am nevertheless presenting these data because:

  • The main differences I am trying to establish are those between informal and formal entertainment venues
  • The statistical differences between them are so large – 100s of percent, not 10s of percent — that I believe they can easily absorb the range of the probable errors.

Bryant Park. Our model informal downtown entertainment venue, Bryant Park, has annual expenditures of $11.20 million. That is far, far smaller than the expenditures of some of NYC’s other major formal entertainment venues:

  • MSG’s $309.57 million, is about 27 times larger than Bryant Park’s
  • Met Museum’s $252 million, is about 22 times larger than Bryant Park’s
  • MoMA’s $164.4, is about 14 times larger than Bryant Park’s
  • LCPA’s $774.9 million, is about 69 times larger than Bryant Park’s
  • LCPA’s $399.95 million expenditures, just on performance and production costs, but still 35 times larger than Bryant Park’s
  • Brooklyn Academy of Music’s $40.99 million, about 3.66 times larger than Bryant Park’s.

It is noteworthy that, despite the huge differences in their costs to renovate/create (see Part 2), Bryant Park’s expenditures seem to be in the same range as downtown Chicago’s Millennium Park’s $12.80 million. Manhattan’s Central Park has much higher annual expenditures, about $58.3 million, but that is to be expected since it is about 80 times larger in acreage than Bryant Park.

Bryant Park’s annual expenditure per visitor is just $1.87. Again, it is a fraction of the expenditures per visitor of four of NYC’s major formal entertainment venues:

  • MSG’s $77.39, about 41 times larger than Bryant Park
  • Met Museum’s $40.22, about 21 times larger than Bryant Park
  • MoMA’s $53.38, about 28 times larger than Bryant Park
  • LCPA’s $154.98, about 83 times larger than Bryant Park
  • LCPA’s $115.93 just on performance and production expenditures, but still 62 times larger than Bryant Park
  • Brooklyn Academy of Music’s $74.53, about 39 times larger than Bryant Park

The six formal entertainment venues located in smaller communities –their populations range from 566 to 25,340 — unsurprisingly have annual expenditures considerably lower than Bryant Park’s, averaging $3..51 million. However, their annual expenditures per visitor are vastly higher, ranging from $26.00 to $80.45 with an average of $42.83.

These findings for Bryant Park are consistent with the hypotheses that informal entertainment venues require organizations that tend to have significantly lower annual expenditures, but with one qualification: the analysis needs to control for the size of the community in which they are located. However, the Bryant Park findings also suggest that the analysis does not need such a qualification when comparing expenditures per visitor – Bryant Park’s is lower than any of 13 formal venues regardless of the size of the community in which they are located.

Comparing the Informal Venues and Formal Venues Presented in Figure 14. The direction of the above findings about Bryant Park compared to four major NYC formal entertainment venues holds when the annual expenditures and expenditures per visitor of the 8 informal venues presented in Figure 14 are compared to those of the 13 formal venues:

  • The formal entertainment venues’ average annual expenditures are $121.4 million, 10.3 times larger than the $11.7 million of the informal venues
  • The formal entertainment venues’ average annual expenditures per visitor are $64.11, 32 times larger than the $2.00 of the informal venues. In terms of attracting visitors, the informal entertainment venues appear to get a significantly greater bang for their bucks than their formal counterparts.

Taking the Size of the Community Into Account. The formal and informal venues presented in Figure 14 are also divided into Larger Communities and Smaller Communities categories. There are nine venues located in smaller communities:

  • The formal entertainment venues located in Farmington, CT; Shelburne, Rutland and Weston, VT; Morristown and South Orange, NJ. They include both rural and suburban communities. Their populations range from 566 to 25,340, averaging 14,007
  • The informal venues are located in: Greenport, NY; Somerville, NJ and Valparaiso, IN. Their populations range from 2,200 to 32,014, averaging 15,458.

The venues from larger communities are located in NYC, Chicago, Cleveland, Houston and Paris, France.

Because the number of venues in these four groups are small, ranging from three to seven, the findings presented below should be treated with caution. Though not definitive, I believe the findings are still worthy of consideration:

  • As expected, the entertainment venues located in larger communities, be they formal or informal, have significantly larger annual expenditures than their brethren in small communities. The formal venues in larger communities average annual expenditures of $206.1 million, 58.6 times larger than the $3.51 million average for the smaller communities. Among the informal venues, those in larger communities average $18.50 million, 38.5 times higher than the $480,000 average in the smaller communities.
  • However, this pattern is weaker when we look at expenditures per visitor. Among the formal venues, those in the larger communities average $82.35 per visitor, only about 1.9 times larger than the $42.83 in the smaller communities. Significantly, among the informal venues, the size of the community seems to have little impact: the average for the large communities is $2.02 and that for the smaller communities is $1.99, a meager $0.03 difference. The expenditures per visitor for all seven informal venues range from $0.63 to $3.54, considerably lower than the ranges for the formal venues, e.g., $26.00 to $80.45 in the smaller communities. Regarding visitation, it appears that regardless of whether they are located in smaller or larger communities, informal entertainment venues get a much bigger bang for their bucks than do the formal venues.

Take Aways

Over the years, I have learned that some solid lessons can still be learned from studies that have relatively few cases to analyze, with prudence and care governing the scope and wording of the conclusions.

Based on attendance, Bryant Park is one of NYC’s major entertainment venues. There are perhaps 10 or 15 venues in the city that are in the same league and they constitute the relevant analytical population. The above analysis has data on seven of these venues. Consequently, it can be argued that our sample is far from small. However, this means that our conclusions must be framed within the context of NYC’s major entertainment venues and not the nation or universe.

Within that constraint, I believe the findings of the above analysis can be taken with a good deal of confidence. They are:

  • Bryant Park’s annual expenditures are significantly lower than NYC’s major formal entertainment venues, not by just a few percentage points, but by several hundreds of percent
  • With regard to attendance, Bryant Park gets a much greater impact for its expenditures than NYC’s major formal entertainment venues. Its annual expenditures per visitor are $1.87 compared to the $40.22 to $115.93 of the five major formal venues in the study.

Bryant Park is our model informal entertainment venue and it was compared to five of NYC’s major formal entertainments. Consequently, the analysis above also tried to gain some indications about whether informal and formal venues across the nation differ similarly on these important variables. Here is where the analysis’s small sample problem is located: 21 entertainment venues were analyzed, while there are probably tens of thousands of them spread across the nation.

Given this situation, our conclusions can gain some firm footing by referencing “some” rather than “all.” For example, the more general analysis did find that, among those analyzed, informal and formal entertainment venues across the nation differed on their annual expenditures and expenditures per visitor variables as they did in NYC — with the qualification that, on expenditures, the size of the community needs to be controlled. While certainly having some evidential value, the sample is too small to warrant generalizing these findings to all entertainment venues in the USA. However, the following can be said with a good deal of confidence: the analysis shows that

  • In communities of similar size, some informal venues have annual expenditures significantly lower than some major formal entertainment venues
  • In communities regardless of size, some informal venues have a much greater impact for its expenditures than some formal entertainment venues.

Even restated, these findings can be important considerations for downtown leaders who are trying to either create or expand an entertainment niche. They might, for example, deduce from these findings that well-crafted informal entertainment venues can require far less money having to be raised each year, while attracting far more visitors for each dollar spent. That thinking might not result in a strategic preference for building and operating an informal venue, but it probably will win it careful consideration. In communities with modest financial resources, our restated findings will probably be of even greater relevance.

I would also argue that the analysis of the data does provide some indications that our findings, with additional research, may well be found to apply to all informal and formal entertainment venues. They do have a kind logic ( e.g., the need to control for community size on expenditures) and consistency  (e.g. the relationships hold whether you look at larger communities or the smaller ones and the range of expenditures per visitor for the eight informal venues are just a few dollars apart). In my experience, this augurs well for them being strongly confirmed in a larger study.

© Unauthorized use is prohibited. Excerpts may be used, but only if expressed permission has been obtained from DANTH, Inc.

Posted in Central Social Districts, Creative Class, Downtown Niches, Downtown Redevelopment, Economci Development, Entertainment, Entertainment niche, Formal entertainment venues, Informal entertainment venues, Innovations, New Normal, Pedestrian traffic, Public Spaces, Small Towns, Uncategorized |

Bryant Park Part 2: a comparison to other entertainment venues on attracting tourists, user frictions and costs to create or significantly renovate

Posted on September 27, 2014 by DANTH

Posted by N. David Milder

Introduction

Part 1 of this article focused on showing how Bryant Park is a model informal downtown entertainment venue. That entailed describing how it performed three key functions:

  • Providing visitors with a pleasant, green refuge from a downtown’s hustle and bustle
  • Offering opportunities for visitors to engage in fun activities, with their resulting performances entertaining nearby people watchers
  • Holding entertaining events for park visitors that are performed al fresco, often on “flexible use” locations within the park, using impermanent infrastructure, e.g., stages, movie screens, ice rinks, etc. Here the visitors are usually observersrather than participants (1).

Part 1 also demonstrated that Bryant Park is a very strong entertainment attraction for the Midtown Manhattan CBD. In terms of annual attendance, it either closely rivals or surpasses such world-class formal entertainment venues as the Lincoln Center for the Performing Arts (LCPA), the Metropolitan Museum of Art (Met), the Museum of Modern Art (MoMA), Madison Square Garden (MSG), Yankee Stadium and Citi Field. Bryant Park’s magnetism demonstrates the powerful contribution an informal downtown entertainment venue can provide for a district’s entertainment niche as well as for its economic well-being.

Part 1 can be found at:  http://tinyurl.com/kv36u4s

Here, in Part 2, the discussion will continue comparing Bryant Park to some formal entertainment venues from a downtown economic development perspective by focusing on:

  • Bryant Park’s comparative strength as a tourist attraction in NYC
  • Its user frictions compared to other major NYC entertainment venues
  • The cost of its rebirth in 1992 compared to how much it cost to create 18 other significant entertainment venues — or to do a major renovation of them.

Because covering those topics requires about ten pages, I now am planning on writing a Part 3 of this article that will cover:

  • A comparison of the total annual operating expenditures of the corporation that operates Bryant Park to those of the organizations that operate 20 other major entertainment venues located across the nation
  • A look at Bryant Park’s economic impacts compared to those of other major entertainment venues. This comparison will occur within a discussion I have subtitled: Arts Venues’ Economic Impact Studies – Watch Out for the Horse Puckey.

Comparing Bryant Park to Some Formal Entertainment Venues from a Downtown Economic Development Perspective (continued from Part 1)

The Tourist and Local Audience Mix. Tourism is a major component of the New York City economy, as it is for many other communities across the USA — be they large or small. In 2013, for example, the direct spending of tourists in NYC was about $39.4 billion, with their overall economic impact valued at $58.7 billion (2). Consequently, Figure 11 takes a closer look at Bryant Park’s ability to attract tourists by comparing it to other major NYC entertainment venues. The selection of these comparable venues was simply a function of finding those for which the needed data were available (3). They were not easy to find. Also, the available data are not uniform: MoMA, the Guggenheim and the Joyce Theater categorize guests who come from beyond the NY Metro area as tourists, while the other venues define guests who come from beyond NYC to be tourists.

Compared to the Guggenheim’s 87%, the Met’s 75%, MoMA’s 75% and the Broadway League’s 66%, Bryant Park scores much lower on the percentage of its visitors who are tourists, 20% to 40%. In this regard, it stands with the other public park listed in the table, Central Park, which has tourists accounting for 30% of its annual attendance. However, when we look at the absolute numbers of tourists who visit each venue, it is Central Park that is the hands down winner with 12 million tourist guests annually. Bryant Park also shows significant strength: it probably has more tourist guests than the Guggenheim and likely is giving the formal entertainment venues at LCPA and MoMA a run for their money. Bryant Park is not just an “amenity” for people employed in nearby buildings or local residents.

Downtown entertainment niches can be strategically tasked to attract more visits and capture more dollars from tourists as well as from locals (e.g., trade area residents and people who work in the downtown). All too often, in our meetings in smaller downtowns that have had some measurable success with penetrating the tourist market:

  • We’ve heard leaders describe the dissatisfaction local residents have with the downtown’s tourist-oriented retail, food and entertainment establishments that are seen as catering to outsiders rather than the local community’s tastes and needs
  • There is an unspoken assumption that vibrant public spaces are really for “the locals,” while formal entertainment venues—e.g., PACs, theaters, museums, arenas – are much more capable of attracting tourists and consequently better able to bring in lots of outside money and serve as the cornerstone of a downtown entertainment niche.

The data in Figure 11 support concluding that both Bryant Park and Central Park are able to serve the local community while also attracting significant numbers of tourists. This suggests that informal downtown entertainment venues have the potential for achieving comparatively similar success in other communities, even in smaller ones. This is not to say that such success is assured, but to argue that it is worthwhile to seriously consider an informal downtown entertainment venue as a tool to bring both more tourists and more local folks downtown.

The Brooklyn Academy of Music and the Joyce Theater are well-known and very highly regarded cultural institutions that have been around for several decades. Their comparatively modest penetrations of the tourist market demonstrate that a formal entertainment venue may not always be an effective strategic vehicle for attracting tourists, but it still can be popular with local residents. It may even be that the managements of these two organizations, and their donors, prefer focusing on their local audiences. One might suspect that, across the nation, a significant number of the managers of downtown PACS, theaters and museums have a similar preference. In our firm’s experience, dreamer arts advocates – not venue managers — are usually the ones who see formal entertainment venues as the path to capturing tons of tourist dollars.

That the Met, MoMA, the Guggenheim and the Broadway League’s theaters have tourists –of which a high percentage likely come from abroad — accounting for the vast majority of their audiences probably contributes to their being considered world class institutions. These museums are also legendary fundraisers, mostly from very wealthy local and regional donors who often have substantial national or international reputations. One might reasonably suppose that these donors strongly support the orientation of these institutions toward a world audience and their having the “products” to win substantial amounts of prestige and market share in it. Relatively few other arts organizations in the USA are in a similar position or can even hope to get there. That also suggests that few of them can realistically hope to bring in comparatively huge numbers of tourists into their downtowns or communities by becoming world-class institutions.

Furthermore, the importance of “location, location, location” frequently comes into play, providing important limits on the size of the potential tourist market. The locations of many communities make it difficult for them to tap the national tourist market because their interstate highway, rail and airline assets are relatively weak. Also, many communities frankly lack other strong assets, such as scenic beauty, places of significant historical import, sports activity opportunities, attractive hotels and restaurants, etc. Few communities can grow into a Las Vegas, Nevada or a Branson, Missouri – and many do not want to. It is much easier for an entertainment venue in a small town or small city to capture tourist patrons when there are lots of tourists already visiting other places in its market area, than for the entertainment venue to become the magnet that will be the area’s primary tourist attraction.

Small town and small city entertainment venues probably can be more successfully positioned within a regional tourist market. However, then regional consumer entertainment preferences also can come into play. For example, a few years ago, we visited a very interesting and attractive downtown museum in a midwestern city with a population of over 100,000 people. Its county’s tourism agency reports servicing about 85,000 sports tourists annually, averaging out at about 282 per day. In our opinion, the museum’s holdings were unique, high quality and impressive; many other museums would probably love to have holdings of comparable quality. Yet, we were surprised to find, on Thursday and Saturday afternoon visits, that we only could count fewer than 20 other guests on each occasion. In this, and many other communities across the nation, high brow arts-based events and venues may be far weaker customer magnets than other entertainment venues.

Frictions on Visitation. Entertainment venues, be they formal or informal, face a varying array of non-physical constraints that help structure when and how often people will visit them. Some of these frictions are:

  • Their operating hours – the days and hours they are open to receive guests. If they are not open, guests cannot be received and a substantial part of the venue’s potential impact on local businesses cannot be felt directly
  • Their admissions. The higher the fees, the more guests are likely to be people with lots of disposable income. Also, venues in larger cities featuring sports events, concerts and Broadway shows often sell tickets in a way that leads to a large percentage of them being resold at substantially higher prices by brokers or individuals in a secondary market. This can both increase the skew towards those with more discretionary dollars and annoy the hell out of those who are less affluent. If and when admission fees/tickets need to be obtained, the more lines one has to stand on and the longer they are, the more annoyed a potential customer can get
  • The need for an “appointment.”  Scheduled events like shows, concerts and sports games really require the user to make something analogous to an appointment that, too often, only is available when it is convenient for the other party. The more one likes a performer, the more one is likely to adapt to the performance’s dates by altering one’s own schedule and by paying a premium ticket price
  • They require a lot of time. Because of the length and timing of most scheduled events, they cannot capture a very important segment of a downtown’s entertainment demand: the people who, mainly during the daytime hours, are looking, in a spontaneous and unplanned manner, for entertainment opportunities that last 45 minutes or less. Those with a short-time period type of entertainment demand can include nearby residents, people employed in the downtown who are within a 5-minute walk of the venue and tourists. Office workers and adults with children are especially likely to appreciate daytime downtown entertainment opportunities that last less than 45 minutes. Downtown office workers are most likely to visit a nearby informal entertainment venue on their lunch hours. These days, their lunchtime out-of-office trips only last about 45 minutes (4). Also, research has suggested that parents often need to find an entertaining activity for their children that will last for less than about 45 minutes (5).

Figure 12 describes where Bryant Park stands on these four factors, while facilitating a comparison to some of Manhattan’s other major formal entertainment venues. Bryant Park – as is the case with other informal downtown entertainment venues – poses potential users with far fewer obstacles to visitation than the formal entertainment venues:

  • It is open 15 to 16 hours a day, daytime and evening, daily, almost year round
  • There are no admission fees
  • Most visits are driven by the users’ schedules. Those wanting to attend the Park’s scheduled events will, of course, have to adapt to their timing. But, there are lots and lots of other things to do in the park for those who spontaneously decide to visit
  • The park definitely attracts a lot of users who stay for 45 minutes or less. Visits can be short or long, depending on the individual’s needs and desires. The lunchtime peak in Bryant Park’s visitation suggests that a large proportion of the visitors are employed in nearby buildings and they probably are office workers. My field observations and recent chats with park users support that conclusion. My field observations also suggest that a lot of the mid-morning and mid-afternoon park users stay for less than 45 minutes.

Movie theaters cannot accommodate those with 45 minutes or less to fill, but they are open during both day and evening hours, their admission fees are affordable and their films have frequent showings that facilitate match-ups with a potential guest’s schedule. The formal venues of the Met and MoMA can meet the needs of those with only 45 minutes or less to fill, and guests’ schedules can drive the timing of their visits during the daytime. However, the museum’s admission prices are about twice that of local movie theaters.

The venues that present concerts, shows and sports events are those that have the strongest user frictions. All of these events last longer than 45 minutes, and it is usually difficult to spontaneously gain admission to them — unless one is prepared to pay a high dollar premium. Their events are mostly scheduled for evenings and a few weekend afternoons. Their average ticket costs are magnitudes higher than that of the average nearby cinema that my recent purchases in NYC found to be around $13. For example:

  • At Lincoln Center, the average ticket for an evening at the opera costs $156; tickets for the New York Philharmonic, at series subscription prices, range from $29 per concert for a highest tier, nosebleed seat, to $112 for a seat in the more preferable orchestra section (6)
  • The average seat for a Broadway show during the 2012-13 season was $98.44. However, a good number of the Broadway tickets are resold in the “secondary market” where prices can soar, with some reaching $1,000+ (7)
  • The costs of concert tickets through Madison Square Garden’s box office will vary with the performer, but generally are close to the range of the $64 to $124 charged for a Billy Joel concert. The average box office prices for NY Knicks basketball games and NY Rangers hockey games are $125 and $78 respectively. However, lots of the tickets to these MSG events also end up being resold in the secondary market where prices can exceed $1,000 per ticket. (8)

Obviously, these are New York City prices and the premium dollars extracted in our secondary ticket markets are less likely to occur in much smaller towns and cities. However, the prices for shows and concerts in such locations can still be several times the price of a local movie ticket. For example, in one city with a population of about 17,000 that is located in a state with a population under one million persons, a movie ticket costs about $6.50, while the ticket costs to some concerts in the downtown’s attractively restored theater are:

  • Aaron Neville $44.75 to $49.75
  • BB King $65.75 to $95.75
  • Jazz at Lincoln Center $74.75 to $84.75
  • Season pass to Metropolitan Opera HDTV performances $160 to $200.

Bryant Park has many fewer frictions to entry and use than any of the NYC formal entertainment venues it has been compared to in this analysis. It presents nowhere near the economic barriers to entry that the formal venues do, and it most readily accommodates spontaneous visits of fewer than 45 minutes. In these respects, Bryant Park exemplifies some of the important advantages informal downtown entertainment venues have over the formal venues, even in small and medium-sized downtowns.

Comparing the Costs to Create, Expand or Renovate Downtown Entertainment Venues. What has really struck me over the past few years, as I looked into downtown entertainment venues, is how many reports have been done since the early 1990s on the positive economic impacts performing and visual arts venues have on their communities and how much media attention they have attracted. In contrast, there has been relatively little discussion about the comparatively high costs of creating and operating these arts venues. Also, it should be remembered that an organization’s strong economic impacts do not necessarily correlate with its financial viability. For example, in 2008, the Big Three automakers were on the verge of bankruptcy, but they directly and indirectly supported 3 million jobs, many of which were well-paying.

This focus on the robust economic impacts also was surprising since — as I have detailed in prior articles in this series — there now are two disturbing trends in the arts, one for consumer demand to be far more uncertain, changing and often in decline and another for donations and grants from government, foundation and corporate sources to be falling-off and far harder to obtain. These trends support the hypothesis that a downtown organization wanting to create or strengthen an entertainment niche might want to identify the types of venues that require the fewest financial resources to first create and then operate.

The data presented in Figure 13 are related to the costs of the creation or major expansion/renovation of 20 entertainment venues in towns and cities of all sizes, though the largest number are located in NYC (9). To facilitate comparison, I have presented these capital costs in 2014 dollars. The data are neither exhaustive nor systematically collected. They are presented because a discussion about them can be, though not definitive, nevertheless suggestive and useful.

The cost for the critical renovation of Bryant Park that was completed in 1992 is presented in two ways: the far larger estimate includes the cost of putting book storage space for the NY Public Library under the six acres of Bryant Park that are behind the library’s building. This was included because a pre-publication reader maintained that the work on the library’s book stacks probably reduced, to some unknown degree, the cost of renovating the park, most likely related to demolition work. The $57.9 million number is presented in recognition of that possibility, but the lower number will be used in the analysis since I believe it is much closer to the true renovation cost.

Comparing the cost of renovating Bryant Park in 1992, $13.9 million (without the subterranean library improvements), to the other projects in NYC shows that it was:

  • About as much as renovating one of Broadway’s major theaters ($11.3 million – $13.2 million)
  • Less than two percent of what it cost to expand MoMA in 2005, $1 billion
  • Far less than the $1.2 billion needed for the LCPA renovation completed in 2012
  • Also far less than the cost of the 2014 renovation of MSG, $ 1 billion.

If we look at projects listed under “Elsewhere” in Figure 13, the costs to renovate all but one the theaters and to create the PAC in South Orange, NJ are in the same league as the cost to renovate Bryant Park. This suggests that lots of other communities can mobilize the funds to create their own version of a Bryant Park.

If we look at the three Newark projects, again we find that the informal downtown entertainment venue, Military Park, had renovation costs, $5 million, that were a small fraction of the $431 million needed to build the Prudential Center sports arena or the $277 million spent on creating the NJPAC. To some degree, this cost differential may be due to the fact that the city already had possession of the park, so there was no land acquisition cost. However, I doubt that accounts for a significant amount of the differences. The Military Park renovation is very recent and it will be interesting to see how its attendance in five years compares to NJPAC’s and the Prudential Center’s.

Looking at Millennium Park in Chicago, we see an entirely different situation. The full cost of building the park, in 2014 dollars, was over $605 million. That’s about $25 million per park acre. It cost considerably more than the new Modern Wing of The Art Institute of Chicago, $277 million. This, of course, demonstrates that creating an informal downtown entertainment venue will not always cost less than creating a formal entertainment venue. However, taking a closer look at the situation suggests that the high costs are inevitable when two factors are involved:

  1. There are numerous and very complicated infrastructure improvements that are considered essential to the project. In Millennium Park, for example (in 2006 $s):
    • $105 million was spent on an under the park garage that can accommodate over 2,100 vehicles
    • $60 million went to improve the under the park superstructure for Metra’s commuter rail system
    • $14.5 million went for the BP Pedestrian Bridge—designed by Frank Gehry
    • The Nichols Bridgeway, designed by Renzo Piano, that connects the Lawn of the Pritzker Pavilion to the third floor of the Art Institute’s Modern Wing, was built at a significant, but unpublished cost
    • $7 million was spent for the Exelon Pavilions’ four solar energy generating structures
  2. There are a lot of expensive fixed attractions and fixed event venues for visitors. For example, in Millennium Park:
    • The Jay Pritzker Pavilion, an outdoor amphitheater with 4,000 fixed seats, cost $60 million and also was designed by Frank Gehry
    • The Harris Theater (that is mostly underground because of height restrictions) also cost about $60 million
    • The Crown Fountain cost $17 million
    • The Cloud Gate sculpture, a.k.a, The Bean, cost $23 million
    • Lurie Garden cost $13. 2 million
    • Boeing Gardens, outdoor art exhibition spaces, cost $5 million (10).

The significance of these two factors is also attested to by an informal downtown entertainment venue, Mitchell Park, in the small community of Greenport, NY (population 2,200). That four acre waterfront park cost $14.9 million to create (in 2014 $s) largely because of serious brown field issues that had to be resolved, land acquisition costs and a design calling for a 60+ slip marina, a glass building to protect a full sized carrousel, a camera obscura and a building to provide offices for the park and harbor master as well as a viewing point of the harbor.

On the other hand, Division Street Plaza in downtown Somerville NJ (population 12,000) and Central Park Plaza in downtown Valparaiso, IN (population 32,000) show that effective informal entertainment venues can be created at significantly lower costs, $0.6 million and $3.39 million respectively. I will go into greater detail about the Greenport, Somerville and Valparaiso informal downtown entertainment venues in an article scheduled for late October 2014.

The differences between Bryant Park and Millennium Park are probative and go well beyond the vastly different costs of renovating/creating them. For example, Millennium Park has many expensive fixed infrastructure elements that enable visitors to attend events and connect the park to other adjacent attractions. In contrast, Bryant Park’s infrastructure for events is basically temporary and cost far less. It also is firmly embedded in Midtown Manhattan’s street grid and consequently does not require connecting bridges. Much of the seating in Millennium Park is fixed (about 4,000 seats); in Bryant Park it is flexible, with visitors able to move their chairs to wherever they want to put them. Bryant Park provides copious opportunities for visitors to perform by engaging in activities ranging from ping-pong to chess to yoga, while Millennium Park encourages visitors to behave more like observers.

Fundamentally, these differences probably are based on the divergent professional backgrounds of those who had the strongest influences on the designs of these two great parks. Millennium Park’s design was most influenced by famous architects. In contrast, the design and programming of Bryant Park were the products of urbanists who believed that public spaces should be designed to reflect how people are likely to behave in them.

Take Aways

Bryant Park is admittedly not the strongest tourist attraction in NYC, but it certainly holds its own compared to some of the city’s best-known formal entertainment venues, e.g., MoMA, LCPA and the Guggenheim Museum. Its strength with tourists demonstrates that informal entertainment venues can be important magnets for tourists as well as for downtown workers and trade area residents. That ability should be of strategic interest to downtowns that want to create or strengthen their entertainment niche, especially those in small and medium-sized communities.

In many key respects, Bryant Park is far more user friendly than NYC’s major formal entertainment venues. You can pretty much use it when you want or need to. There are no admission fees to pay or lines to stand on. Your visit can last three hours or ten minutes, depending, again, on your wants and needs. Your visit does not require an “appointment.” As a result, Bryant Park can attract the many tourists and other downtown users who have less than 45 minutes to spend in an entertainment venue. Here again, it exemplifies a trait of informal entertainment venues that should be of strategic interest to downtowns that want to create or strengthen their entertainment niche.

The 1992 renovation of Bryant Park was not its creation, but more akin to its recreation. The cost of that recreation, whether you chose the number that includes the cost of the NYPL’s subterranean 40 miles of bookshelves or the smaller and more probable amount, is dwarfed by the costs of renovating NYC’s formal entertainment venues that can compete with it in terms of attendance. While Chicago’s Millennium Park demonstrates that this is not always the case, Bryant Park does demonstrate that informal entertainment venues capable of attracting very strong visitor flows can be created for far less money than formal entertainment venues. For any downtown that wants to create or strengthen its entertainment niche, this should be an important strategic consideration — most especially for those in small and medium-sized communities, where financial resources are likely to be limited.

Endnotes

1. Given some reactions by readers of Part1, I want to clarify that: a) I am a very frequent patron of all of the NYC entertainment venues I discussed, save MSG and the Broadway theaters and b) I think that the venues I do not visit frequently still are strong economic assets for NYC and I am glad that we have them.

2. Michael Howard Saul, “New York City Sees Record High Tourism in 2013: Hotel Room Rates, Bookings Up; Number of International Visitors Doubled in 12 Years,” Wall Street Journal, Dec. 10, 2013 http://online.wsj.com/news/articles/SB10001424052702304744304579250521791383050

3. Most of the data on the tourist component of an entertainment venue’s attendance came from: http://www.thirteen.org/metrofocus/2012/08/tourists-help-the-nyc-arts-economy- thrive/ . However, some tourist data was obtained directly from an organization’s staff or its website

4. ICSC 2003 survey of office workers

5. Randy White, “The shifting nature of leisure time and expenditures”, “Leisure eNewsletter – January/February 2008,”

6Daniel J. Wakin “The Met Will Lower Ticket Prices,” New York Times, February 26, 2013. http://www.nytimes.com/2013/02/27/arts/music/metropolitan-opera-to-reduce-ticket-prices-next-season.html. Info on ticket costs for the New York Philharmonic taken from its website http://nyphil.org/

7. The Broadway League, “Broadway Statistics at a Glance 2013,” http://www.broadwayleague.com/editor_files/broadway_statistics_at_a_glance.pdf

8. Claire Suddath, “Billy Joel Will Play Madison Square Garden for the Rest of His Life,” BloombergBusinessweek, Dec 4, 2013. http://www.businessweek.com/articles/2013-12-04/billy-joel-will-play-madison-square-garden-for-the-rest-of-his-life; Forbes. NBA Team Valuations: New York Knicks. http://www.forbes.com/teams/new-york-knicks/ ;Forbes. NHL Team Valuations: New York Rangers. http://www.forbes.com/teams/new-york-rangers/

9. A wide range of sources, both on the Internet and in personal conversations and communications was used to obtain this data. Paul Goldberger’s May 3, 1992 review of Bryant Park gave me $8.9 million as the cost of its renovation, which I have converted to 2014 $s. Another NYT article around that time gave me the cost of NYPL’s subterranean work, that I turned into 2014$s and added to the updated Goldberger number to get the highest cost estimate. (All of the other cost numbers I found were also updated to 2014 $s.)The cost of the SOPAC project comes from an “Evaluation of SOPAC” done by Harac Consulting in 2011. The cost of Division Street Plaza in Somerville comes from an email from Beth Anne Macdonald, the executive director of the Downtown Somerville Alliance. Mayor David E. Kapell, who spearheaded the development of Greenport’s Mitchell Park, gave me the cost for creating it in a July 2006 telephone conversation. The costs of the remaining projects were obtained from Internet sources, mainly local newspaper articles

10. All of the cost estimates for specific parts of Millennium Park come from an article in Wikipedia: http://en.wikipedia.org/wiki/Millennium_Park . However, I found other sources that confirmed each of them.

© Unauthorized use is prohibited. Excerpts may be used, but only if expressed permission has been obtained from DANTH, Inc.

Posted in BIDs, Central Social Districts, Creative Class, DANTH, Downtown Niches, Downtown Redevelopment, EDOs, Entertainment, Entertainment niche, Formal entertainment venues, Informal entertainment venues, Innovations, movie theaters, New Normal, Planning and Strategies, Public Spaces, Small Towns, The Arts, Trends |

Bryant Park: The Quintessential Downtown Informal Entertainment Venue – Part 1

Posted on August 19, 2014 by DANTH

Introduction

Informal Entertainments in Public Spaces. A major goal of this series of articles on downtown entertainment venues is to demonstrate that great public spaces and third places can be very strong components of the entertainment niches that are now critical to the magnetism, health and well-being of our downtowns. Too often, when downtown leaders want to create or strengthen their entertainment niche, they look only at formal entertainment venues such as PACs, museums, concert halls, theaters, arenas, etc. Ignored are the entertainment values of great public spaces that, compared to the formal entertainment venues, often can attract larger audiences, cost less to operate and maintain and have bigger economic impacts on the surrounding downtown areas. These are especially important advantages in small and medium-sized downtowns that typically have weaker customer traffic generators and fewer financial resources.

Great public spaces are being described as informal entertainment venues because:

  • They provide opportunities for guests to engage in activities that they enjoy and that also interest and amuse nearby people-watchers. In contrast, formal entertainment venues guests are almost always a passive audience
  • Yet, informal venues often also provide a calm refuge from a downtown’s hustle and bustle
  • They facilitate conversation and social interaction among attendees. In many types of formal entertainment venues guests must act as a whispering, if not completely quiet audience
  • Their events are held in informal settings, usually outdoors or within a temporary structure (e.g., a tent), often using temporary stages and screens. In contrast, formal venues have buildings, often lavish, with a lot of fixed infrastructure such as stages, screens, seating, etc.
  • Access to them is usually free and when there are charges for such things as equipment rentals and rides, they are reasonably priced. In contrast, formal venues usually charge admission fees, and frequently they are unaffordable for 60% to 80% of American households
  • Guests usually can time their visits to informal venues to suit their own schedules; with formal venues potential guests must adjust their schedules to the timing of the event they want to attend.

The Park. I have been visiting New York City‘s Bryant Park for about 34 years. In my opinion, it is the quintessential informal entertainment venue. A lot can be learned by taking a close look at it. I certainly did.

The park was not always a success. Back in the 1970s and early 1980s, Bryant Park was such a notorious place for drug use and sale, prostitution and associated crimes that the police, at one point, completely closed it down. Landlords and real estate brokers then involved in properties facing the park reported that its problems and ill repute made leasing commercial spaces very difficult and suppressed rents (1). During those troubled days, Bryant Park stood out as the paragon of a failed public space, a stark demonstration of what can happen when a public space, even in a great location, is badly managed, poorly designed and unsuccessfully programed. In contrast, today, Bryant Park is a paragon of a successful public space, deservedly acclaimed, extremely popular and a model from which others can learn.

Many factors were involved in the park’s astonishing turn around, e.g: the involvement of important actors from the private and nonprofit sectors; the creation of a nonprofit organization with a very effective management team, under the leadership of Dan Biederman, to revitalize and manage the park; the use of novel revenue sources of which BID assessments were just one component; effective plans for both physically improving the park and programing it into an extremely attractive and very strong informal entertainment venue.

Its Strong Location
Bryant Park occupies some of Manhattan’s choicest real estate: 9.6 acres in the midtown CBD that are bounded by Fifth Avenue, Avenue of the Americas, 40th and 42nd Streets (2). The main informal entertainment functions of the park, that are the focus of this article, occur in the approximately six acres located behind the large and famous Beaux Arts building of the Main Branch of the New York Public Library. It sits on Fifth Avenue between 40th and 42nd Streets. The library annually draws about 2.3 million visitors (3). Underneath the park, the library has about 40 miles of shelf space for its books.                          

Figure 1. Major buildings near Bryant Park

Figure 1. Major buildings near Bryant Park

Three entrances to the subway system abut the park and provide access to five train lines.

The surrounding blocks are densely filled with high rise office buildings — many of architectural merit — and a large number have ground floor storefronts. About 78,000 people are employed within a 5-minute walk just of the park’s 42nd Street and Avenue of the Americas entrance; within a 10-minute walk employment reaches to about 315,000 (4). Also, there are 29 hotels within 0.2 miles of the park (5). Times Square is within a three minute walk, while the Grand Central Terminal, Macy’s and Rockefeller Center are all within roughly six minute walks (6). The park’s management estimates that, on an average weekday, about 250,000 people walk by on the sidewalks of the four streets that surround the park; a significant number are probably tourists.

The park has become so successful that the Bank of America Tower proudly proclaims its address to be One Bryant Park, and a new hotel is named the Bryant Park Hotel. Back in the early 1980s, this simply would have been unthinkable!

A strong location was not enough. Because of the park’s location, it is surrounded by a huge pool of potential visitors who are either within easy walking distances of the park or walking by its perimeter on their trips to other destinations. The flow of pedestrian traffic near the park during its troubled days was probably lower than today, but still relatively strong when compared to downtown locations in other cities. What turned the tide was not the new and renovated office buildings and hotels that have appeared since 1992 — they came after the park became a success– but what was happening in the park, the new “products” it offered and how they were “packaged.” That’s what drew all the visitors into the park and encouraged them to stay. A superb location was not enough. Obviously, few downtowns in America have similarly dense locations, certainly not those in small and medium-sized communities. Yet, the success of Bryant Park demonstrates the critical importance of the variety and quality of the products an informal entertainment venue offers, be it in dense Midtown Manhattan or in a small or medium-sized downtown.

The Park’s Informal Entertainment Venue Features

It’s an attractive and welcoming place to sit, relax and observe. Many New Yorkers and many tourists often appreciate opportunities to have a respite in a green open space from the city’s high energy and rapid pace of activities. Other park visitors may seek a pleasant place to spend their down times between appointments.  Small towns, in this respect, are like Bryant Park; they are places where people go to live or vacation in order to find refuge from urban hustle and bustle.

Bryant Park responds strongly to those needs. For example, the park’s management reports that in a “survey conducted in the summer of 2013, visitors to the park consistently noted the park’s beauty, and used words like ‘oasis,’ ‘wonderful,’ and ‘lovely’ to describe the park.” With 4,200 French park chairs, 800 French café tables, and 55 umbrellas Bryant Park offers visitors ample places for them to sit comfortably in a very pleasant green setting. Moreover, they can chose to sit on the open one acre lawn or shaded under one of the 220 London Plane trees. Visitors can also enjoy the park’s carefully designed and maintained greenery that features 75 species of plants. Visitors are also able to easily access the Internet since the park is a WiFi hotspot. Significantly, the park has a far too often undervalued urban feature: clean, safe and easily accessible bathrooms.

Figure 2. Sitting in the shade with places to buy food nearby

Figure 2. Sitting in the shade with places to buy food nearby

Figure 3. Sitting in the sun on The Lawn

Figure 3. Sitting in the sun on The Lawn

The people sitting will naturally be observing and probably people watching – ready to be entertained by what is happening within their view sheds in the park. This is a critical audience building step for most informal entertainment venues.

Figure 4. Ping Pong players

Figure 4. Ping Pong players

A substantial portion of the park’s infrastructure is dedicated to facilitating visitors’ engagement in activities that they can enjoy – while entertaining the people who may be observing them. Bryant Park offers an extraordinary range of activities that visitors can engage in – while others can watch them “performing:”

  • There are numerous places where people can get food and drink in the park ranging from the white table cloth Bryant Park Grill to several Witchcraft kiosks specializing in sandwiches and salads, coffee, frozen yogurt or gelato
  • Visitors can use, at no cost, 35 strategy, board, word, party and card games to entertain themselves and their friends or relatives. The park also runs “game socials” and mah jongg clinics
  • The Chess Area provides visitors with chess and backgammon boards for free
  • On The Green, visitors, at no cost, can practice their putting or play kubb, a game from Sweden that resembles lawn bowling
  • There is a playing area for pétanque, which is similar to boules and bocce. The park provides lessons and runs pétanque tournaments
  • A ping pong table is also available for visitors to use
  • The “Winter Village at Bryant Park” features a 170′ x 100′ skating rink (admission free) on its lawn and 125 boutique-style shops in the park’s tree-lined allées. The winter ice rink’s attendance peaks between Thanksgiving and Christmas, and reached over 261,000 total skaters in the 2012-13 season
Figure 5. Children’s Reading Room (parents allowed)

Figure 5. Children’s Reading Room (parents allowed)

  • A “Reading Room” provides opportunities for visitors to find and use reading materials. There also is a special Reading Room area near the carrousel for children with appropriate books and child-sized furniture. This attention to detail in meeting potential user needs helps make the park such a standout
  • Le Carrousel is a popular ride for children and costs $3.00 per ride
  • There are also Tai Chi, Yoga, fly fishing, fencing, juggling, knitting, modern dance and language lessons. The summer yoga series attracts about 800 guests
  • NYC Audubon provides birding tours of the park. Having other expert organizations involved in an activity is a smart way to increase a venue’s attractions, while constraining costs. Small venues might want to look into this
  • Dancing in Bryant Park – A series of social dance party after work in the late spring and summer
  • The complete list of these activities can be found on the Bryant Park website at: http://www.bryantpark.org/things-to-do/grounds.html

The number, diversity and quality of these activity offerings are very impressive. Some have a uniqueness that is prone to arouse visitor curiosity. Several are sponsored, e.g., the Winter Village by Bank of America and the Reading Room by HSBC. The year round food and Winter Village retail operations also are revenue sources for the park.

As any longtime visitor will attest, the park’s management is constantly refreshing these offerings. It does not let the park’s success degenerate into a debilitating same-old, same-old staleness. Many downtown leaders elsewhere would do well to follow suit.

Numerous events are held, mostly after 5:00 pm, in Bryant Park using temporary structural assets and/or repurposing existing fixed structural features. Bryant Park’s management is masterful in the way it uses The Lawn and other parts of the park in many different ways over the course of a calendar year by deploying temporary structural assets. The Winter Village with its temporary ice skating rink and temporary boutique retail kiosk-like structures is the largest and most complex example of this.

Without having any formal permanent stage or any permanent fixed seating or a permanent movie screen, Bryant Park puts on a very diversified and appealing series of events, that includes:

Figure 6. Temporary movie screen and stage

Figure 6. Temporary movie screen and stage

  • The HBO Bryant Park Summer Film Festival presents 10 films on the Lawn using a temporary screen. It attracts about 9,000 guests. It is sponsored by Bank of America and three other corporations
  • Several concert series over the spring and summer such as Bryant Park After Work. They use the Park’s Upper Terrace
  • Plays such as the Bryant Park Shakespeare on the Upper Terrace Steps
  • Dance recitals such as Bryant Park Presents Modern Dance on a temporary stage.

In other words, the park stages many events that are very similar in type, if not in scale, to those put on in the formal entertainment venues such as performing arts centers, theaters and concert halls, but in much more informal, lower cost to create and maintain, outdoor and temporary settings. In contrast, Millennium Park in downtown Chicago has the Jay Pritzker Pavilion designed by Frank Gehry that reportedly cost $60 million to build and includes 4,000 fixed seats plus a Great Lawn that can accommodate another 7,000 people (7). Many small and medium-sized downtowns might benefit by taking their cue from Bryant Park: to have a useful and affordable performing arts venue, they may not need to go to the expense of creating a PAC or renovating a theater if they can fully utilize their existing public spaces by multi-tasking them.

Bryant Park’s events help keep it and the surrounding area active after dark. Moreover, their diversity strengthens the park’s drawing power by offering potential visitors greater choice.

Comparing Bryant Park to Some Formal Entertainment Venues from a Downtown Economic Development Perspective

Downtown management organizations likely are interested in entertainment venues because of their abilities to attract and retain customer traffic and their positive economic impacts on their districts. These impacts may be on the demand for residential, office or retail spaces, retail and hospitality establishment sales and/or in the generation of jobs.

Attendance. The abilities of an entertainment venue to bring people into the downtown, keep them there or make them happy to be there are valuable assets for any downtown. Bryant Park is a very powerful attraction for Midtown Manhattan. According to its management, Bryant Park’s attendance now has grown to approximately 6 million users per year. Attendance peaks in the summer months and around lunchtimes. Average 1:00 pm weekday snapshot counts from April to October range from 2,100 to over 3,000 guests per day. One significant shift in attendance is that the percentage of women has come to exceed 50%, a good sign of a healthy park. A 2013 survey of park guests showed that about 30% were tourists. Given that many tourists are foreigners who may be hesitant to participate in a survey because of iffy English language skills, the park’s management prudently suggests this estimate should be treated with great caution. However, allowing for a large 33% margin of error would indicate that tourists probably account for 20% to 40% of the park’s attendance, which supports a less definitive, but still informative conclusion that tourists have a significant presence in the park. Furthermore, the park’s geographic location relative to Grand Central Terminal, the Public Library and Times Square argues strongly for a probable significant tourist presence.

Top-city-parks-in-USA-by-visits

Comparisons with some other attractive and successful urban parks help show the strength and density of Bryant Park’s attendance. Among city parks across the nation, in 2013, Bryant Park was the 13th most visited. However, Bryant Park is, by far, smaller in acreage than any of the other top ranked parks in attendance (see Figure 7). Consequently, on a measure of attendance density Bryant Park far outshines all the rest with 625,000 annual visits per park acre (see Figure 7). Similar findings emerge if Bryant Park is compared to other NYC parks such as Coney Island Beach & Boardwalk, Prospect Park and High Line Park. Millennium Park in Chicago, another downtown park, comes closest, with 204,000 visits per acre, but it is still 67% below Bryant Park (8). NYC’s 843 acre Central Park (which is not in the Midtown CBD, but borders it) has many more visits than any other city park in the nation, but its ratio of 47,000 visitors per acre is 92% lower than Bryant Park’s (9).

Bryant Park’s attendance certainly more than holds its own when compared to the strongest formal entertainment venues in NYC’s outer boroughs. For, example, Yankee Stadium in The Bronx and Citi Field in Queens, homes to the Yankee and Mets baseball teams, had only 3.3 million and 2.1 million tickets sold in 2013, see Figure 8 below (10).

Looking at some of Manhattan’s strongest formal entertainment venues, Bryant Park again more than holds its own when it comes to attendance.

top-NYC-entertanments-by-visits

Madison Square Garden (MSG). Creating downtown sports arenas has often been a key objective for many big city downtown revitalization efforts, e.g., Charlotte NC and Newark NJ. Manhattan has one of the oldest, most successful and most famous: MSG. Reports indicate that attendance, after a three year $1 billion renovation, will return to the 4 million customers per year level that was reached as far back as 1995 (11). That means that Bryant Park attracts 50% more guests than the MSG.

Broadway’s Theaters. It also is interesting to compare Bryant Park’s attendance not to just one or two Broadway theaters, but to all of them. According to the Broadway League, the total attendance for all Broadway theaters in the 2013-14 season, which included 44 new productions, was 12.2 million (12). Bryant Park’s attendance equals about 50% of the patrons drawn by all of Broadway’s theaters.

Metropolitan Museum of Art (Met). The most recent attendance estimate we could find for this museum was 6.2 million visitors per year (13). That is the second highest in the world, after The Louvre, for an art museum. An unknown part of the Met’s 6.2 million visitors comes from guests  at the off-site Cloisters that is 7.8 miles to the north. The Met’s attendance statistic  is just three percent more than Bryant Park’s 6 million. This slight difference might be accounted for by, besides the Cloisters’ attendance, divergent counting and estimation procedures.

The Museum of Modern Art (MoMA). It reported about 3.0 million annual visitors, which is equivalent to about half of Bryant Park’s attendance (14).  However, a potentially important new twist just has been added. For decades, MoMA’s Sculpture Garden was a favorite refuge of knowing New Yorkers and tourists to escape the Big Apple’s hustle and bustle. Access was tied to first gaining entry to the museum, which usually involved paying an admission or membership fee. However, in recent weeks, MoMA has made the Sculpture Garden open to the public, free of charge, starting at 9:00 a.m., before the museum’s official 10:30 opening, and closing at about 10:30 p.m., well after its normal closing times. Consequently, the Sculpture Garden has been turned into an informal entertainment venue and it will be interesting to see how this will impact MoMA’s overall attendance in the coming rears.

Lincoln Center for the Performing Arts (LCPA). It claims 5 million guests per year, which is about 20% lower than Bryant Park’s attendance. However, LCPA is not a pure play cluster of formal entertainment venues, especially after its recent $1.2 billion renovation program. LCPA reported selling 3.2 million tickets in 2012 (15). That suggests that the attendance of its formal entertainment venues only equals about 53% of Bryant Park’s annual attendance. Moreover, the formal entertainment venues accounted for about 64% of the LCPA’s claimed total visits. The other 36% might be explained by:


Figure 9. LCPA’s Koch Theater on a Friday afternoon – a lone soul in view

Figure 9. LCPA’s Koch Theater on a Friday afternoon – a lone soul in view

  • The LCPA being the venue for New York’s Fashion Week (232,000 visitors), movie premieres and high profile corporate and media events
  • The people on the 1,300 tours of the center given each year.
  • Perhaps most importantly, the LCPA’s informal entertainment attractions. For example, the David Rubenstein Atrium is an indoor public space where visitors can sit, relax, get something to eat, attend occasional free concerts, have WiFi Internet access, obtain information about the LCPA, buy tickets and get on tours of the LCPA.. It reportedly has attracted well over 1 million visitors since opening in 2009. The LCPA’s recent renovations also produced several new outdoor public space seating areas such as Barclays Capital Grove, Illumination Lawn and the Credit Suisse Information Grandstand as well as several new restaurants. The LCPA also has a summertime series of 150 free outdoor concerts that utilize temporary stages and seating and are attended by about 250,000 people.
  •  The guests drawn by its educational programs.  
Figure 10. LCPA’s “Grove” on that same afternoon – more people in view, others sitting under the trees

Figure 10. LCPA’s “Grove” on that same afternoon – more people in view, others sitting under the trees

 The Take Away. Downtowns prosper economically when they can agglomerate relatively large numbers of people. Although downtown parks are often thought of simply as attractive green places for folks to enjoy nature and get some fresh air, they also can be incredibly strong magnets that draw as many as or more guests than any PAC, arena, theater or museum. Bryant Park demonstrates this power more than any other public space I have visited. Its informal, entertainment opportunities, as demonstrated above, enable it to rival the magnetism of any world class formal entertainment venue.

Downtowns of all sizes might learn from this and ask if a public space offering informal entertainment opportunities might be a more powerful and easier to create attraction than a PAC, arena or theater they are considering.


ENDNOTES

1. During 1982-1984 I spent a good deal of time researching Bryant Park for Regional Plan Association’s Downtown Safety, Security and Economic Development Program. This research included frequent park visits, a survey of about 200 park users and interviews with park drug dealers and users, nearby landlords and commercial brokers active in the area
2. I want to thank Dan Biederman and Maureen Devenny of the Bryant Park Corporation for responding so graciously and helpfully to my request for statistical information about the park. Information about its activities and infrastructure also were garnered from its website and countless visits to the park over the past 34 years
3. Reported by library staff in a telephone interview
4. Employment data from the Census Bureau’s OnTheMap reports. The total number of people employed within five and 10 minute walks of the park is even larger because also measuring from the entrances to the east and south would include many more office buildings. Still, the numbers from just that one entrance are sufficient to demonstrate the point that a heck of a lot of people work within an easy walk of the park.
5. Based on a count of hotels reported in that ring by Yelp
6. Distances measured in Google Earth, walking time estimates based on a speed of 3 MPH
7. Wikipedia: http://en.wikipedia.org/wiki/Jay_Pritzker_Pavilion
8. Millennium’s attendance data from: MILLENNIUM PARK QUADRUAPLE NET VALUE REPORT, Texas A&M University and Depaul University, Summer 2011, pp.78, p.16. I want to thank Jamey Lundblad at the Chicago Department of Cultural Affairs and Special Events for sharing it with me.
9. Central Park Conservancy, REPORT ON THE PUBLIC USE OF CENTRAL PARK, New York, NY April 2011 pp.64, p.6
10. Attendance stats from: http://www.baseball-reference.com/
11. Thom Duffy, “Best Seats In the House: Nation’s Largest Markets Lead the Way In Venue Renovation Boom,” Billboard February 14, 2014. DANTH cited the 4 million attendance number in a report we did in 1995 for the 34th Street Partnership
12. The Broadway League, “BROADWAY SEASON STATISTICS AT A GLANCE” http://www.broadwayleague.com/editor_files/broadway_statistics_at_a_glance.pdf
13. The Metropolitan Museum Of Art, Annual Report for the Year 2012–2013, pp.153, p.6. and Hrag Vartanian, “2012 Museum Attendance Numbers Show a Diverse Global Art Scene” http://hyperallergic.com/68051/2012-museum-attendance-numbers-show-a-diverse-global-art-scene/
14. PricewaterhouseCoopers LLP, The Museum of Modern Art Consolidated Financial Statements June 30, 2012 and 2011, October 2012, pp.79 p.13 f
15. LCPA press release October 11, 2012: “Dedication of President’s Bridge on October 1, 2012 Marks Completion of Lincoln Center’s Redevelopment Project.”

© Unauthorized use is prohibited. Excerpts may be used, but only if expressed permission has been obtained from DANTH, Inc.

Posted in Central Social Districts, Change Agents, commercial nodes, Creative Class, Downtown Niches, Downtown Redevelopment, Entertainment, Entertainment niche, Formal entertainment venues, Informal entertainment venues, New Normal, Planning and Strategies, Public Spaces, Small Towns, The Arts |

Post navigation

← Older posts
Newer posts →

Recent Posts

  • Now is the Time for Many Downtowns to Grow Older Adult Member Communities
  • How downtown multifunctionality is packaged is a key to its success
  • “How Our Downtowns’ Three Most Important User Groups Can Help Their Sustained Recoveries”
  • The Cockamamie Conclusions andAssumptions of the Downtown Doom Loop Analysis
  • More Visitors, Not the 100% Return of Office Workers, Are the Key to the Full Recovery of Our Downtowns

Labels

  • 15 minute neighborhoods (2)
  • automated cars (4)
  • backdoor retailing (5)
  • BIDs (27)
  • Business Recruitment (29)
  • Captive Markets (10)
  • Central Social Districts (38)
  • Central Social Functions (6)
  • Change Agents (24)
  • clean sidewalks (2)
  • clean streets (2)
  • commercial nodes (11)
  • Contingent workers (4)
  • convenience (6)
  • Creative Class (31)
  • Crime (8)
  • CSDs (7)
  • DANTH (13)
  • Deliberate Consumer (13)
  • Downtown Garages (4)
  • Downtown Merchants (30)
  • Downtown Niches (64)
  • Downtown Redevelopment (70)
  • downtown retailing (66)
  • Downtown Visitors (5)
  • driverless cars (4)
  • E commerce (27)
  • Economci Development (54)
  • Economic Development (8)
  • EDOs (27)
  • Entertainment (44)
  • Entertainment niche (35)
  • Entrepreneurship (14)
  • fear of crime (9)
  • Financial tools (5)
  • Formal entertainment venues (28)
  • Formats Facades Signs (6)
  • Functional Diversity (2)
  • Housing (11)
  • Informal entertainment venues (26)
  • Innovations (33)
  • Jamaica Center (3)
  • Jobs (7)
  • Leakages/gaps (7)
  • Live-Work (6)
  • Living donor (1)
  • Luxury retail (7)
  • Market research (7)
  • movie theaters (23)
  • Moving People (3)
  • multichannel retailing (20)
  • Multifunctionality (2)
  • New Normal (50)
  • Office Development (11)
  • Older Adults (1)
  • Pamper Niche (9)
  • Parking (5)
  • Parks (3)
  • Parksmand public spaces (6)
  • Pedestrian traffic (19)
  • Planning and Strategies (52)
  • Public Spaces (25)
  • Remote work (4)
  • Remote working (2)
  • retail chains (30)
  • self-driving cars (4)
  • Seniors (1)
  • Small Merchants (36)
  • Small Town Entrepreneurial Environments (8)
  • Small Towns (36)
  • Social Media (3)
  • Sprawl (3)
  • Suburban Downtowns (21)
  • Superstar downtown (2)
  • technology (11)
  • teenagers (4)
  • The Arts (28)
  • time pressure (5)
  • Tourism (10)
  • Trends (50)
  • Uncategorized (34)
  • Up for Grabs shoppers (2)

Links

  • CCED
  • Planetizen

BACK TO TOP

83-85 116th Street, Ste 3D
Kew Gardens, NY  11418
Phone: (718) 805-9507
[email protected]

Copyright © ndavidmilder.com