Downtown Formal Entertainment Venues: Part 3

By N. David Milder

Revised April 26, 2014

Introduction

On our downtown revitalization assignments over the years, DANTH has heard many local leaders suggest as a major strategic element either creating a formal entertainment venue or improving an existing one. In many instances, this concern was focused on the issue of maintaining or attracting a movie theater, but in many others, the issue was either the saving and renovation of an old theater or the creation of a performing arts center. Additionally, I have either lived in or frequently visited a number of cities where such issues have arisen. Consequently, I used these communities as an informal sample to investigate how their formal entertainment venues operate. Some of the communities included in this sample were: New York City and White Plains in NY; Newark, Rahway, Englewood and South Orange in NJ; Cleveland and Columbus in OH; Carlisle, PA, and Rutland, VT. Admittedly, this sample is both small and not systematic, but I think the observations presented below still are pretty much on target.

Advocates of these formal entertainment venues often advance a two-pronged argument for them that is well articulated by Cleveland’s PlayhouseSquare on its website:

  • “As the country’s largest performing arts center outside of New York (it has eight venues), the not-for-profit performing arts center utilizes the arts to engage individuals and attract over one million guests per year to its 1,000+ annual events. These audiences act as the catalyst for economic growth and vitality within the region….
  • Stage activity on our multiple performance spaces draws over one million people annually to downtown…people who also dine, shop, work, vacation and help neighborhood businesses thrive.” (Italics added.)

In other words, the audiences of these formal entertainment venues are supposed to have positive impacts on the city or regional economy while generating a lot of new pedestrian and customer traffic for nearby businesses, especially for nearby restaurants and retailers.

In too many instances recently, such advocates also see these formal entertainment venues as providing the missing revitalization engine, the silver bullet solution for their downtown’s renewal. Such advocacy, for example,  is frequently to be found voiced in many downtown revitalization related LinkedIn group discussions.

When are these entertainment venues open and why is that an important question?

We visited the websites of the venues in our sample to count how often and when they were open. The vast majority:

  • Had an event (sometimes two) on between 80 and 150 days per year; though some venues were as low as four events a month. Most days and evenings of the year they are “dark”
  • Most entertainment events occur on weekends; most dark days are midweek
  • Daytime midweek events tend to be “educational,” with a lot of school kids being bused in and out
  • Most entertainment events are scheduled for the evenings
  • A vast majority of these venues are “dead” for three months during the summer, with very few if any events during this time period.

First, it should be noted that most of the venues we looked at do not attract anywhere near the one million visitors a year claimed by Playhouse Square. More typical for smaller communities with populations of less than 25,000 is Theater X, that has 838 seats and in a recent year had 140 events. That translates into a maximum attendance of 117,320, assuming every seat at every event being filled.

More importantly, the audience traffic these venues attract will be arriving at a time of day when most businesses – especially in small and medium sized downtowns — are either closed or getting ready to close. Restaurants and watering holes are the businesses most likely to benefit from this audience traffic. The size of this impact will obviously be related to the size and spending power of the audience flow and the number of events held at the formal entertainment venue.

But, the need for pre-theater meals tends to abbreviate the time available for pre-theater shopping, especially on workweek evenings, even in those shops – most likely chain stores – that are open that late. The truth of the matter is that during most weekdays these venues are generating little or no pedestrian traffic that nearby retail businesses are likely to tap. The same is the case for most evenings and both daytimes and evenings during three summer months.

This, in turn, strongly suggests that the direct positive economic impacts of the formal entertainment venue audiences often are appreciably over-estimated, even the more probable impacts on restaurant revenues. For example, Theatre X claims that it generates about $4 million a year in revenues for nearby downtown eateries and watering holes. That would mean that every one of its maximum 117,320 person audience would: 1) eat a pre-theater dinner downtown and 2) spend $34.09 per dinner. It also means that its downtown eateries can handle a pre-theater dinner rush of 800+patrons. It is very doubtful that every theater patron would have either a pre or post theater dinner downtown or spend on average about $68 for a dinner for two. Also, I seriously doubt that this downtown’s eateries can handle a pre-theater dinner rush of that size in that price range.

Programming: culture, popular entertainment, education

The term “performing arts center” may conjure up expectations of programs filled with high brow cultural events such as classical music, ballets, operas, classic and Broadway plays, jazz, etc. Such performances (including Metropolitan Opera HD broadcasts) are indeed to be found on the calendars of the arts venues we looked at. However, it is interesting to note that PlayhouseSquare says on its website that entertainment is its core and that most of the performing arts venues in our sample have programming that is focused on a broad range of popular entertainments such as:

  • Concerts by acts featuring various types of music: popular, rock and roll, folk, ethnic, etc.
  • Family shows
  • Speakers
  • Comedians
  • Screenings of the broadcasts of NFL playoff games
  • Educational programs and plays for children
  • Motion pictures: some show classics on a limited basis; others show new films in cinemas built into their building or on their campus.

Obviously, these organizations are doing what they feel they need to do to drive patrons through their doors and win the earned revenues that will help them stay in business. For example, Eric Mallette, the programming director of Rutland’s Paramount Theater, says “that he pays a lot of attention to what the local market responds to and tries to book shows and adjust ticket costs to fit those trends” (1). For many years that meant popular music and family entertainment, including the booking of a lot of comedians. According to Bruce Bouchard, who runs the Paramount Theater: “We started booking comedians and it just took off” (2).

The importance of making ends meet is demonstrated by the fact that many of these venues rent out their spaces for business meetings, weddings, bar mitzvahs, etc.

It seems to me that, save for one or two exceptions, entertainment center is a far better descriptor of these venues than performing arts center. This is not pilpul, since the distinction can lead to differing expectations for a formal entertainment venue, how it is designed and the operational decisions its management makes.

Some of these venues provide homes for resident performing arts companies — orchestras, dance companies, theatre companies, performing arts schools, etc. This will influence a venue’s programing and the paths and strengths of its economic impacts. It is one of the things, in my opinion, that differentiates a performing arts center from a theatre or a group of theatres.

Have successful formal entertainment venues directly generated more pedestrian traffic, produced stronger retail or been the prime engines of successful revitalization?

A caveat: the following are my personal observations and conclusions, based on my field visits (often over many years or decades) and limited research efforts that involved internet searches and some personal interviews. Obviously, they are not based on a systematic research effort — that would require resources well beyond those available. Nevertheless. I am hopeful that the reader will find the evidence and arguments presented below convincing.

Lincoln Center for the Performing Arts, New York City. This center is the home of 11 world class resident organizations such as The Chamber Music Society of Lincoln Center, Jazz at Lincoln Center, Julliard School, Lincoln Center Theater, Metropolitan Opera, New York City Ballet, New York Philharmonic and the School of American Ballet. Conceived as an urban renewal project in the 1950s and parented by the Rockefellers and Robert Moses, it opened the doors of its main buildings during the 1960s.

Though it has had its fair share of problems, I think it is accurate to say that Lincoln Center is generally viewed in all quarters as a successful home and vital asset for its resident organizations as well as a very strong cultural and economic asset for the city as a whole.

In the 50+ years since its inception, the Upper West Side of Manhattan, where Lincoln Center is located, has experienced such a strong rebirth as a residential area that many now argue it is the priciest and most coveted in the city. As the old adage goes, retail follows roofs. Retail on the Upper West Side has changed significantly, but mostly over the last 10 to 15 years, when many prestigious retail chains discovered the area (and rising retail rents forced many independents to close). This retail growth lagged, for decades, far behind the success – and audience attendance – of Lincoln Center, but followed more closely the construction of many new high-end condo buildings.

Lincoln Center did stimulate the development of a cluster of nearby restaurants and bars, but the quality of this cluster and the larger Upper West Side restaurant scene also improved substantially with the neighborhood’s residential resurgence. This suggests that Lincoln Center has indeed been an important revitalization engine, but that its most direct impacts have been to make the neighborhood a more attractive place to live in, not by providing more customer traffic for local retailers, restaurants and bars. It also should be noted that the residential rebirth of the Upper West Side cannot be attributed alone to Lincoln Center. The neighborhood’s proximity to Central Park, Riverside Park and the Midtown Manhattan CBD as well as its subway and bus lines also were important factors. Nevertheless, since it has helped attract a larger and more affluent local residential population, Lincoln Center most probably has impacted positively, if indirectly, on the economic well-being of local merchants. Note that this indirect impact flows independent of the center’s performance schedule.

Lincoln Center’s urban renewal heritage also gave it a design that, combined with the operating hours of its venues, made it difficult for local merchants to benefit from the large audience traffic they generated. As Roberta Brandes Gratz wrote so perceptively back in 2003:

“…Lincoln Center has never really worked. This island of culture stands apart from the city like a fortress, with an elevated plaza on the east offering a lukewarm welcome to one segment of society while concrete walls shut off the less fortunate segment represented by the public housing to the west. Centers like this deaden urban street life, bringing a rush of traffic and human activity all at one time and then lying almost dormant the rest of the day, like a stadium without a game” (1).

To rectify this situation, in 2010, Lincoln Center completed a widely acclaimed project aimed at making the center more permeable and to increase the public’s use of its plaza spaces during the daytime hours when there are no performances. On my daytime visits since 2010, I have observed far more people using these public spaces than I had in the past. This has made the Lincoln Center area “stickier” for visitors, which is bound to benefit local businesses.

Some other large PACs around the nation also suffer from being “islands of culture” with impermeable designs and considerable amounts of time when they are “dark” and inactive. This especially seems to occur when they are inserted into a decayed, low income area. Sports stadiums and arenas inserted into a downtown or city residential area also tend to suffer from being functionally dead for substantial amounts of time. Of interest: the planned renovation of Chicago’s Wrigley Field and the area adjacent to it has components specifically aimed at keeping the area activated on non –game days.

The Paramount Theater, Rutland , VT. Rutland is a small city of about 17,000 people, often referred to as a blue collar, beer drinking type of town, that is also the financial and commercial center of central Vermont. During the 1990s DANTH completed two major reports for the Downtown Rutland Partnership and in both we advocated for the renovation of the Paramount Theater as a way of growing the downtown’s entertainment niche. I last visited the theater sometime around 2000, when it was in its final stage of renovation.

For decades, the region’s economy has been slow growing and it did not fare well during the Great Recession. Through these years, Rutland’s downtown has had its ups and downs. In recent years the challenges have grown with the closings of many of its longtime retail shops as well as its movie theater. (Happily the movie theater re-opened under a new owner who upgraded the projection to digital and 3D and it now appears to be doing well).

After reopening in 2000, the Paramount first struggled to establish itself and then, through the Great Recession, grew in strength. Its annual budget increased from about $700,000 to $1.3 million and the number of performances it presented per year swelled by 75%. The renovated theater gave the community a very attractive and badly needed venue for a wide array of entertainment events — and one local residents could take pride in.

In a recent conversation, I asked Dick Courcelle, the former executive director of the Downtown Rutland Partnership, if what the Paramount does for the downtown today was worth all the blood, sweat and tears that went into its renovation or would they have been better off investing in some other type of project? “It’s absolutely done what we wanted it to do; it was well worth all the effort and resources,” he replied.

In terms of economic impacts, the Paramount’s growing success by itself could not turn the tide for Rutland’s downtown retailers, though it obviously has had some benefits for downtown eateries. Neither could the combination of the Paramount and a rejuvenated movie theater serve as a silver bullet cure for the ills of downtown retailers.

Thinking about the situation in downtown Rutland brought to mind the fact that during the deterioration of the Times Square area here in NYC during the 1960s and 1970s, the many legitimate theaters in the area continued to do a brisk business. Their strength, too, could not prevent severe challenges of social disorder and physical decay from emerging in the neighborhood.

PlayhouseSquare, Cleveland, OH. My association with Ohio goes back to the late 1950s when I went to Kenyon College and then I worked in Columbus for 10 years in the 1960s and 1970s. I have returned on personal and professional visits since then, the most recent being two trips to Cleveland in 2009 and 2010.

Cleveland has long been one of my favorite cities because of its treasures in the arts and sports. The Cleveland Museum of Art and the Cleveland Orchestra playing right across the street in Severance Hall are both world class and worthy of repeated visits. They are part of the University Circle cluster of cultural facilities located about five miles east of the downtown’s Public Square, that also includes the Cleveland Institute of Music, Cleveland Institute of Art, Cleveland MOCA, Cleveland Botanical Gardens and Case Western University.

The city also has many active theatres that date back many decades. For example, the Cleveland Play House, America’s first professional regional theatre, was founded back in 1915. Over the years it has staged more than 1,300 productions that included over 100 world and/or American premieres. For many years, CPH was located on a campus well  beyond the downtown on Euclid Avenue near the Cleveland Clinic and about a mile west of the University Circle culture cluster. Recently, it moved downtown to PlayhouseSquare where it will have three venues, including the new Allen Theatre.

PlayhouseSquare is a performing arts center that not only operates eight theaters in downtown Cleveland’s theatre district, but takes on neighborhood real estate development functions and helps local artists obtain needed resources.  The theatre district is a 13 to 15 minute walk from Public Square and Tower City Center. It neighbors Cleveland State University. Its spine is Euclid Avenue which runs from Public Square through the theatre district and then goes on through CSU, the Cleveland Clinic and University Circle.


Figure 1. The Ohio, State and Palace Theatres in downtown Cleveland's Theare District

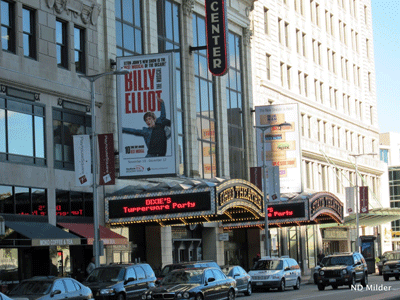
Figure 1. The Ohio, State and Palace Theatres in downtown Cleveland’s Theatre District


Figure 2. Looking down the sidewalk as the theater district meets the CSU campus

Figure 2. Looking down the sidewalk as the theatre district meets the CSU campus

I first visited Cleveland’s theatre district with friends in the mid 1970s and took a closer look at it, at the suggestion of the Greater Cleveland Growth Association., in the early 1980s when I was working on Regional Plan Association’s downtown security and economic development program. On my more recent visits to Cleveland, in 2009 and 2010, I walked about the district and drove through it on several more occasions at various times of the day and evening. My impression was that the district was in good physical condition and appeared to be on an upward revitalization path. Together with the CSU campus, it provided an attractive  geographic core upon which additional redevelopment might be attracted. While new eateries were evident, I noted little significant retail. I also observed few pedestrians on the streets, save in the early evenings before showtimes. This, I observed in my field notes, was typical of the theater districts I have visited over the years.

The statistics PlayhouseSquare cites also indicate that it is a popular and successful operation:

  • One million + guests per year
  • 1,000 events per year
  • $4 million per year in contributions.

The revitalization of downtown Cleveland is very much still a work in progress. The strength of PlayhouseSquare is obviously a significant asset in that process, but not the sufficient condition for the downtown’s success. The paths of its positive impacts do not involve generating significantly heightened flows of daytime pedestrian traffic in the district or making the area stickier so visitors will stay around longer. Instead, the direct positive impacts are likely to involve such factors as:

  • Making the neighborhoods near the theater district, as well as the larger Cleveland metro area from which PlayhouseSquare draws it patrons, more desirable places to live
  • The jobs and salaries it generates for people who live in the region, especially for those in arts-related occupations
  • The dollars spent in the metro area by PlayhouseSquare productions
  • Making the Cleveland area a more popular tourist destination.

These impacts are primarily regional in nature. The rest of the downtown probably benefits from them in terms of how it fits into the region. On a more local level, PlayhouseSquare’s impacts probably have been:

  • Providing an effective redevelopment organization for an important downtown area that also helps find resources to support the creativity of local artists
  • Creating a healthier and more appealing commercial area, one that also may be attractive to non-entertainment  and non-retail types of businesses
  • Stimulating a district restaurant niche

In the past, I have argued that the geographic dispersion of Cleveland’s cultural assets had weakened the downtown. However, the regional character of so many of PlayhouseSquare’s probable positive impacts suggests that the downtown might get its share of such benefits regardless of where a performing arts venue is located — as long as it is within a reasonably easy travel time of the city’s center. The University Circle culture cluster is only about a 12 to 18 minute drive from the downtown’s Public Square or about a 35 minute trip along Euclid Avenue on a Healthline bus.

In contrast, visual arts entertainment venues, such as museums and galleries, can attract substantial amounts of pedestrian traffic downtown during daylight hours, as the lines outside MoMA in Manhattan often demonstrate.  Viewed from that perspective, not having either the Cleveland Museum of Arts or Cleveland MOCA located downtown is probably a loss. However, a great number of important art museums are not located in or near their downtown’s core. Many are located in park-like settings that would be difficult to recreate given the existing building densities s and high land costs found in many of today’s downtowns.  Moreover, today many museums feel they need very large exhibition spaces  such as those in London’s Tate Modern and Paris’s Gare d’Orsay. The former is a converted power station, while the latter used to be a rail station. As these conversions suggest, finding sites to build such large museums on in choice downtown locations is likely to be difficult and very expensive. DIA’s decision to build in Beacon NY instead of Manhattan is a good example of this.

Similarly, gallery owners are often forced by high rents to locate in secondary neighborhoods near the CBD — that they often help revitalize and the resulting higher rents then forces them to move to yet another neighborhood, that they help revitalize….

Some observations and take-aways

If downtown leaders want to attract more daytime pedestrian traffic and keep visitors longer in their districts, formal performing arts venues probably are not the strategic vehicles to use. The number of events they present and when during the day they are presented prevents them from being effective in this manner. Other potential elements of a downtown entertainment niche, such as well activated public spaces, are probably better able to generate more pedestrian traffic and make the downtown stickier.

PACs with island fortress designs make it difficult to establish a pedestrian friendly environment.

Nor are these venues likely to have direct positive impacts on downtown retailers. To some degree the downtown retailers themselves are at fault here — especially those in small and medium sized communities — since they are loathe to stay open into the early evenings. However, theater goers all too often have very little time to stroll and shop before their events start.

Furthermore, performing arts centers are certainly not silver bullet solutions to downtown revitalization problems. They cannot and do not by themselves produce such a result and their successes can have a substantial lead time on the rebirths of the rest of their downtowns.

Many of the benefits produced by these formal entertainment venues are regional in nature and the other parts of the downtown would probably share in them even if they were located elsewhere. Primary, in my opinion, are their abilities to make the area a more desirable place to live and to provide employment and financial support for those in arts-related occupations.

From a more local perspective the creation or rehabilitation of such venues can lead to the physical improvement of one or more buildings as well as streetscapes in a part of a downtown. They also can stimulate the development or growth of a nearby restaurant niche.

Sometimes, as in the case of PlayhouseSquare, these entertainment centers are managed by organizations that have evolved to perform important real estate development and arts support functions. CAPA, in Columbus OH, is another such organization that comes to mind. They are real assets for their downtowns and their communities. They also have greater economic impacts than those venues that just focus on events/performances. Unfortunately, most of the entertainment venues we looked at did not have an organization of this kind.

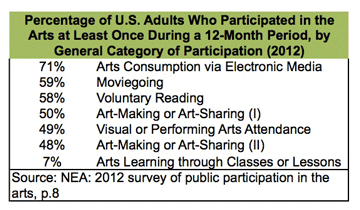
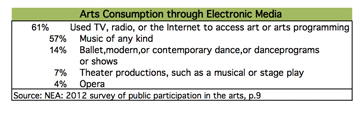
Communities are undoubtedly strengthened when they have attractive venues where residents can come together to enjoy entertainments, including the performing arts. Establishing such venues can be complex and expensive endeavors. Their financial futures are likely to be uncertain given their perpetual needs to have sufficient revenues from earned incomes and contributions at a time when arts consumption is falling, entertainment consumption is becoming increasingly electronic and contributions are harder to obtain. Whether the benefits for the downtown of establishing them in the downtown will outweigh their financial operating risks and high capital investments are issues that require close scrutiny. Also needing consideration are the alternate projects that this capital might be invested in that  might produce greater direct benefits for the downtown. The “multipliers” usually trotted out to determine project impacts are ill suited for answering these questions, since their geographic unit of analysis is the region or county, not the downtown.

One way that these formal entertainment venues might increase their direct economic impacts on their downtowns is by incorporating  an activated public space into their designs and operations that would attract more pedestrian traffic during the daytime and make their neighborhood stickier. In effect, this what was done by the renovations to Lincoln Center and to the Tines Square theatre district when the city closed much of the Square and Broadway to auto traffic and provided places for people to sit.

© Unauthorized use is prohibited. Excerpts may be used, but only if expressed permission has been obtained from DANTH, Inc.

The New Normal’s Challenges to Developing a Downtown Entertainment Niche Based on Formal Entertainments: Part 2 the audiences; revised 041214

Posted by N. David Milder

Introduction

This is the second part of the third in a series of articles about the “new normal” for our nation’s downtowns. It focuses on the challenges many downtowns — especially those that are not very large — now face when they decide to bolster their central social district functions by creating and/or strengthening their venues for the performing and visual arts, e.g., performing arts centers (PACs), theaters, cinemas, concert halls, museums, art galleries, etc. Part 1 dealt with a general introduction of the challenges, a discussion of who can afford formal entertainments and changes in the ways governments, corporations and foundations are funding arts projects. Part 3 will discuss a number of formal entertainment venues as examples and then dive into an update of DANTH’s analysis of what’s happening with movie theaters.

Here, in part 2, the discussion will turn to changes in the ways Americans attend performing arts events and visit visual arts venues. Secondary analyses of two kinds of data will be employed: representative sample surveys done for the National Endowment of the Arts (NEA) and other arts related organizations and reports of admissions to various types of arts venues/performances that were obtained from a number of arts sector organizations.

While both types of data can potentially shed light on consumer demand for attending various performing and visual arts events, they are quite different in nature, much as beans differ from broccoli, though both are vegetables. For example:

  • While the surveys ask individuals whether they attended various arts events over the prior year, the admissions data report the number of people who attended events put on by arts organizations or visited their venues. The surveys report on characteristics of individuals; the admissions data are characteristics of the organizations or venues
  • Translating directly between the two usually is difficult because of a number of issues. For example, the NEA survey may ask about attending classical music concerts, but the best relevant  admissions data are only about attendance at concerts done by our largest symphony orchestras. The NEA survey data reports do not detail how often an individual may attend a particular type of arts event, e.g., once to a museum, three times to an opera, six times to a ballet, etc., while the Culture Track report does. The admissions data reports do not detail how many admissions were accounted for by people who had attended multiple times, e.g., subscription ticket holders
  • The survey data also tell us, at least by implication and sometimes overtly, about the percentages of people who did not attend each of the arts events/venues asked about. However, memories about attendance over a prior year can lead to an unknown degree of erroneous reporting. The admissions data are not informative about those who do not attend. They simply indicate an important fact for those operating arts organizations and venues: whether admissions have gone up or down – and usually with a good deal of reliability
  • Population growth is also an important factor. It is entirely possible that the number of people who are buying tickets for a type of arts events, e.g., chamber music, stays the same over 10 years, but, because of population growth, their proportion of the population would decline.

In this article the survey data will be treated as providing evidence about the proclivities of individuals in the USA to attend various arts events/venues and for explaining why they do so. Though their availability are quite limited, the admissions data will be treated as the best data about actual attendance and ticket sales and as the best indicators of how arts organizations and venues are doing. Obviously, the former should have some impact on the latter, but the paths of that influence are often difficult to accurately identify and detail. However, when both show a similar pattern, e.g., declining attendance and admissions, they can help validate each other’s findings.

The Surveys

The potential audiences for formal entertainment venues are composed of people who “consume” art by attending performing arts events (plays, operas, concerts) or visiting visual arts venues ,e.g., museums, art galleries, etc. The 2012 NEA survey shows that only 49% of its respondents reported engaging in such attendance behavior in the prior year (see the table immediately below). Movie-going, in comparison, had a 59% attendance rate.

NEA-arts-partcipation-at-least-once-2012

Looking more closely at specific arts, the NEA survey showed that in 2012 only relatively small proportions of respondents attended them: classical music 8.8%; jazz 8.1%; dance other than ballet 5.6%; ballet 2.7% and opera 2.1% (see table immediately below). This suggests that the potential audiences for such arts events are comparatively small, though they will be higher where they are geographically clustered, e.g. affluent neighborhoods.

Moreover, when compared to the findings of a 2002 NEA survey, it appears that there has been a general decline in attendance: classical music -24%; jazz -25%; dance other than ballet -11%; ballet -31% and opera -34%. This would indicate that the audiences for these performing arts are not just relatively small, but they are also dwindling when looked at on a percentage basis.  

NEA arts partipcation table 031514

The National Arts Index Report 2013 (NAI) uses survey data gathered from 210,000 individuals by Scarborough Research to demonstrate that attendance at art museums between 2006 and 2011 was below 2003 levels, down by about 8% in 2011 (1). Moreover during the 2003-2011 period, museum attendance never regained their 2003 level.

Some have argued that the decline in arts attendance revealed in the NEA’s 2008 survey was a result of the Great Recession. However, 2012 is three years after the recession’s official termination, yet the decline continued. The economy is undoubtedly a factor, but probably through economic forces that were in play prior to the recession’s onset and continue to have impacts today. This view will be supported below when the admissions data of arts venues are discussed.

arts-consumed-thru-electronic-media

One reason for this decline may be the growing consumption of performing and visual arts through electronic media. For example, the 2012 NEA survey found that 61% of the respondents used TV, radio or the Internet to access art or arts programming (see table above).  A closer look shows that 57% consumed music of any kind via the electronic media;  14% accessed ballet, modern or contemporary dance or dance programs or shows; 7% theater productions and 4% opera. The numbers for dance and opera rival those who attended such performances in person in theaters or other physical venues.

In the near future, technological innovations may increase this diversion to e-attendance. For example, Mark Zuckerberg posted the following comment to explain Facebook’s purchase of the maker of the Oculus virtual reality headset: “When you put  (the headset) on, you enter a completely immersive computer-generated environment, like a game or a movie scene or a place far away. The incredible thing about the technology is that you feel like you’re actually present in another place with other people” (2). The potential for using a virtual reality headset to attend sports events, plays, concerts, operas, etc. appears real; the degree to which it will be realized remains unknown. If not Oculus or some other virtual reality device, then some other technology may emerge to drive more e-attendance. This Pandora’s box has been opened. Also, it should  be remembered that technological impacts on arts attendance are not a new phenomena: back in the 1950s TV viewing drastically decreased movie attendance and changed the way that industry works, but we still keep going to movie theaters.

Other factors are also very important in determining attendance at arts performances. As the Culture Track 2011 report noted: “Decisions about whether to participate in the arts are driven primarily by cost, programming, and convenience. This is true at all ages and income brackets” (3). This report was also based on a large national survey with 4,000+ respondents. The NEA surveys also show that age, education  and ethnicity can be factors, but it notably neglects to discuss the impacts of income. Education is probably acting somewhat as a surrogate variable for income in the NEA analyses because of their high correlation. In today’s economy, one might reasonably argue that admission cost is a major determining factor for persons who are not wealthy and who do not have heaps of discretionary dollars to spend.

Arts-8-distinct-mkt-segments

The Culture Track 2011 study did identify a number of high arts consumers: the young cultural omnivores — likely the young hipsters with lots of discretionary dollars to spend — and the older seasoned cultural omnivores, who  appear to be older and affluent. As the word “omnivore” implies, both like to attend a variety of arts/cultural events. However, together, they represent only about 10% of  the Culture Track survey’s respondents. Then there are three segments that specialize in the type of cultural events they prefer to attend: the museum mavens just like to visit museums, the devoted theater goers just like to go to the theater and the family centrics prefer to attend mostly child friendly events. The specialist consumers’ attendance rate is about half of that of the omnivores. The specialists account for 30% of the Culture Track survey’s respondents. Forty-eight percent of the survey’s respondents are non-attendees and infrequent attendees, and 12% are in the rural history segment that basically is lives in very rural areas, far from major cultural venues. 

The Culture Track survey also found that decreasing attendance was being influenced by the general economy and manifested in the reduced number of events culture consumers went to,  not in a reduction of the number of people who are culture consumers.

These findings suggest that besides about half of all adults being hard or impossible to attract to cultural events, substantial portions of those who are culture consumers will opt out if a venue does not put on the particular type of cultural event/performance they prefer. They also show that the economy is having a negative impact on how often American cultural consumers attend cultural events.  

It should be noted that the NEA’s 2012 survey did find art events that were attracting more people, e.g., 5.1% reported going to events where Latin, Spanish salsa music was played compared to 4.9% reported in its 2008 survey. The NAI report, again based on Scarborough Research survey data, shows that attendance at “live popular music,”– which includes country, R&B, rap, hip-hop and rock music performances — equaled or exceeded the 2003 level every year but one between 2004 and 2011. Indeed in 2011,  attendance at live popular music events was 14% above the 2003 level (4).   This reflects another pattern the surveys agree on: some arts forms are attracting stronger audiences. However, the “high brow” culture/arts forms, e.g., opera, ballet and classical music are not among them.

For those believing that the performing arts can be a silver bullet solution for downtown revival, the NEA and similar surveys indicate a changing and too often dwindling potential audience. They also suggest that the demographic characteristics of a market area and its prevailing lifestyle segments can have a big impact on potential attendance for each of the various types of performing and visual arts events. Formal entertainment venues are likely to be intensely challenged when they try to find and capture  audiences for their programs and events. Consequently, the critical ticket and admissions sales portion of their revenues seem to have become more uncertain, just as have their government funding and grants from corporations and foundations.

REVISION 041214: Since the initial posting of this article DANTH has come across survey information released by the Broadway League, “The Audience for Touring Broadway: A Demographic Study 2011­ -2012,” which had the following findings:

  • “Seventy percent of attendees were female.
  • The average age of the Touring Broadway theatregoer was 50.5 years.
  • Eighty ­nine percent of Touring Broadway theatre goers were Caucasian.
  • Seventy-­eight percent of the audience held a college degree and 30% held a graduate degree.
  • Forty­ six percent of national theatre goers reported an annual household income of more than $100,000, compared to only 21% of Americans overall.
  • Thirty ­one percent of respondents were subscribers to the “Broadway Series” at their local venue.
  • On average, Touring Broadway attendees saw 4 shows per year.
  • Women continued to be more likely than men to make the decision to purchase tickets to the show.”

Performing and Visual Arts Admissions

To research annual levels of admissions at various types of performing and visual arts venues, DANTH reviewed relevant data posted online by such organizations as the League of American Orchestras, the Theatre Communications Group, the National Association of Theatre Owners (movie houses), The Broadway League, the American Alliance of Museums, Opera America, et al. Some of the reported data are not specific enough for the needs of the analysis in this article. For example, the Alliance of Museums surveys its museum members asking if attendance went up or down in the reporting year within specific percentage ranges. It does not collect anything like “counts.” Most of the other organizations survey their membership about admission counts and then on the basis of the reported data extrapolate out to the total number of organizations in their field. For example, the Theatre Communications Group, for its 2012 report, collected data from 178 theaters and then used those results to make an estimate of the annual admissions of 1,782 nonprofit theaters. Some of these organizations appear to have ceased publishing data about admissions.

The analysis below only covers five of the six types of performing arts for which we could find count-based admissions data: movie theaters; symphony orchestras; touring Broadway shows; opera, and nonprofit theaters . Although the desired data are available for Broadway shows staged in Manhattan’s theater district, they were not included because of their geographically confined relevancy.

Five-arts-counts-raw2

One of the things to take away from the above table is the relative sizes of the absolute admissions numbers for each of the arts categories. Attendance at movie theaters, which is in the billion+/yr range, simply dwarfs the combined attendance of the other four arts categories. The opera admissions are far, far smaller than those for the symphony orchestras and nonprofit theaters. For downtown leaders who want performing arts to drive more traffic downtown, the implications seem obvious.

Attendance for symphony orchestras, opera and movies began their declines well before the onset of the Great Recession. This strongly suggests that other factors were influential. On the other hand, attendance for touring Broadway shows has certainly varied over the years, but usually has been strong. The non-profits theaters’ admissions did hit bottom during the recession, but they have since recovered and actually peaked in the most recent year for which there is data, 2012.

Five-arts-indexed

The above table helps to see historic trends more easily by indexing the attendance statistics for each category to the 2003 attendance:

  • Movies. Movie attendance had an average index score of .923 between 2000 and 2013. It topped out historically in 2002 at 1.03 and then followed a bumpy downward path to .84 in 2011. That is a percentage decline of about -18.4%. However, attendance bounced back with about a 6% increase in 2012 over 2011 and then ebbed slightly, 0.40%, in 2013 (5).  That still left movie attendance about -14% below its 2002 high. As movie attendance has declined, research by Pew found that Americans watch five times as many movies at home than they do in movie theaters — and that study predated  Netflix’s entry into the movie and TV show streaming business (6). To help stem the decline, Hollywood has increased  its annual movie production by about 39%, from 478 in 2000 to 665 in 2012. Over this same period, the number of indoor movie theaters declined by 18.8%, the number of indoor movie screens increased by 9.4% and all distribution and projection functions went digital. Since movie house ticket sales only account for a fraction of movie studio revenues — under 15% — a growing number of movie moguls are pressing for new films to be released digitally at about the same dates as they are screened in traditional theaters
  • Touring Broadway Shows Although this category shows about a -13% decline in 2013 from its peak year in terms of absolute attendance, the 2013 attendance is still 20% above the 2003 benchmark year, and it has the highest average indexed attendance score presented in the above table, 1.14.  Its index scores exceeded the benchmark 1.0 in 12 of the 14 years for which we have data, peaking in 2010 at 1.39. The index scores were relatively high  in the preceding 2006 and 2009  period, with scores of at 1.34 and 1.25 during the two recession years. Its index score has not been below 1.10 since 2004. Attendance is significantly impacted by the number of plays on the road and the lengths of their runs. For example, for Broadway shows there is a .69 correlation between the number of playing weeks in a year and attendance. That can statistically explain about 47% of the annual variation in attendance. From the data the Broadway League publishes about gross revenues of the touring shows, it appears that in 2013 the average revenue per admission was $64.01 (up 22% since 2003). If the average ticket price was around that figure, then a lot of folks probably cannot afford to attend touring Broadway shows.  Not all downtown theaters can attract a touring Broadway play; they must have an ability to generate ticket revenues that are commensurate with the size of the production’s cast and costs.  
  • NonProfit Professional Theaters. There were an estimated 1,782 of these theaters in the USA in 2012, and most were not very large– they averaged just 174 admissions per performance.  For the 11 years that there is available data, the attendance index scores for this arts category are below 1.0 in nine of them. But, the most recent score was its highest, 1.07 for 2012, and it followed a 0.99 score in in 2011 that was a .09 improvement over 2010. These theaters get about 52% of their revenues from earned sources and 48% from contributions.  Using the published expense data and dividing it by attendance indicates that there is about $54.11 in expenses associated with the average admission. The earned income, probably from ticket sales, would cover about $28.26 of the average admission cost, with contributions covering the remaining $25.85. Theater tickets in the $30 range are likely to be affordable to many more people than tickets costing $60+. But, needing this audience subvention certainly contributes to pushing about 50% of these  theaters to operate in the red (7). 
  • Opera. Between 2000 and 2011, opera attendance dropped off dramatically by about 40%. The decline has not been linear. Between 2000 and 2003, well before the recession’s onset, attendance fell by about 24%. It’s attendance index score then increases to 1.09 in 2004 and wobbles up to 1.14 in 2007. It then continues to decline down to 0.73 in 2011, the final year for which we could find data. The difference between the 2000  and 2011 index scores is a stunning 0.51. However, this decline was not linear: an important attendance decline occurred well before the recession, and another and stronger decline started when the pre-recession financial crisis began to emerge. 
  • Symphony Orchestras. For the years the DANTH team was able to find relevant data, attendance at concerts of  187 symphony  orchestras peaked in 2001 and 2002, with index scores of 1.14 and 1.07. It then dropped to 1.0 in 2003 and 2005, well before the Great Recession.  Attendance actually rose to 1.04 in 2006 to 2008 as the financial crisis and the the recession set in, but then incurred a substantial drop in 2009 to its lowest index score, 0.89. Attendance recovered somewhat in 2010 and 2011 with index scores of 0.93 and 0.95, showing something of a recovery trend. But attendance in 2011 still was about 7% off the 2003 benchmark and about 17% below the 2001 peak. While the Great Recession probably had a significant impact on attendance, the drop in 2003 and 2005 suggest that other factors also might be at work. Within the field, there has been much heated debate about whether attendance has ebbed because  the classical repertoire has become too limited, boring or inaccessible and whether substantial efforts are needed to expand its audience by attracting more people from a wider range of ethnic, income and age groups. However, a number of observers have argued that even if attendance may have fallen, the quality of the players and orchestral performances has been very high, and the popularity of classical music has grown in such places as college campuses (8). This raises the question: what, then, are the factors that have been pushing admissions at symphony orchestra concerts down, if it is not the quality of the performances and other than recessionary impacts?

Five-arts-per-capita-redo

The table immediately above takes the absolute admissions data from the table “Attendance in Five Performing Arts for Which There Are Admissions Data” and indexes/standardizes it to the national population in each of the years covered. It is, mathematically, something akin to turning them into percentages.  The results are per capita admissions by year of each of the arts categories in the table. Some things to note:

  • Opera and a classical music subset, symphony orchestras, display strong reductions in attendance in the most recent years for which there is data from their peak years, -46.3% and  -24.3 % respectively
  • These are significantly higher declines than those revealed by the analysis of the absolute attendance data, -40.7% and -17.2%
  • While the touring Broadway shows also show from this perspective a stronger decline, the per capita attendance is still well above the benchmark year
  • Movie attendance also shows a greater decline than the absolute attendance numbers, -21.7& compared to -13.9%; its most recent per capita attendance is well below that of the benchmark year
  • Non-profit theaters had their highest admissions ever in 2012, but the per capita admissions in 2003 were just barely higher, 0.1182 to 0.1169.

Take Aways

  1. This analysis has looked from several perspectives at the issue of what has been happening to the attendance levels for various types of performing and visual arts venues over the past decade or so.
  2. The contention that attendance patterns are changing significantly seems hard to refute.
  3. The contention that forms of “high brow” culture such as opera, classical music and ballet have suffered attendance declines also appears to be supported by the numbers
  4. Art forms associated more with popular culture, e.g., live popular music performances, are those that seem to be doing best. However, movie attendance is not what it has been,  despite huge efforts to buttress attendance by by providing more movies per year on more movie screens and using 3-D and IMAX projection systems to substantially enhance the viewing experience
  5. The impact of technology to provide new ways of e-attending performing arts events or visiting museum art collections (MoMA, the Met, the Louvre, the Smithsonian, the Whitney, etc. all have them) is undeniable, but the extent and pattern of that impact is still uncharted. However, what the movie attendance shows — remember we watch 5 times as many movies at home or on our e-devices than in cinemas — is that to a substantial degree we  still want to  watch/see arts events in person with other people. That does not mean that there will not be adverse impacts — just think of all the closed movie theaters, about 10% of them, some say, due just to the conversion to digital projection and distribution
  6. Whether or not these audience churns and declines reflect a cultural dumbing down of our population or whether performing arts repertoires have become stale or their  performance levels waned are irrelevant issues for downtown leaders who want to enhance their central social district functions by building a stronger entertainment niche
  7. What is important are the changes in arts audience behaviors. They increase the uncertainty of existing arts organizations’ earned incomes and definitely will be affecting the economic feasibility of projects  to create new formal entertainment venues. Creating such formal arts venues is seldom associated with cheap capital costs
  8. Regarding the new projects, given the probable capital expense, the uncertainties associated with earned income and the inherent tendency to best serve an audience that has a significant amount of discretionary dollars to spend, some downtown leaders might do well by considering other types of projects to enhance their entertainment niches. These projects might take the form of new vibrant public spaces that are: open to all;  where plays and movies can be shown, but focused mainly on maximizing informal entertainment opportunities; either free or low-cost; designed  to capitalize on people watching; where participants are both the performers and the audience.

Endnotes

1. Americans for the Arts. National Arts Index: 2013 Report, pp.149,  p.67

2. Ibid., p.64

3  See: http://www.businessinsider.com/zuckerberg-why-facebook-bought-oculus-2014-3#ixzz2x1lgtLVO

4.LaPlaca Cohen/AMS Planning & Research Corp, Culture Track 2011 Market Research Report, pp.87, p.7

5. http://www.boxofficemojo.com/yearly/

6. Pew study cited in:https://www.ndavidmilder.com/wp-content/uploads/2012/05/trends_p1_films_08.pdf

7. The data in this section are drawn from  Theatre Facts. It has been published annually by The Theatre Communications Group since 2000. See the 2012issue at:http://www.tcg.org/pdfs/tools/TCG_TheatreFacts_2012.pdf

8. See for example: http://classicalvoiceamerica.org/2014/03/07/campus-concerts-rebuff-notion-of-classical-decline/  and http://www.city-journal.org/2010/20_3_urb-classical-music.html . Thanks to Andy Menshel for bringing them to my attention.

© Unauthorized use is prohibited. Excerpts may be used, but only if expressed permission has been obtained from DANTH, Inc.

The New Normal’s Challenges to Developing a Downtown Entertainment Niche Based on Formal Entertainments: Part 1

Posted by N. David Milder

Introduction

This is the first part of the third in a series of articles about the “new normal” for our nation’s downtowns. It focuses on the challenges many downtowns — especially those that are not very large — now face when they decide to bolster their central social district functions by creating and/or strengthening their venues for the performing and visual arts, e.g., performing arts centers (PACs), theaters, cinemas, museums, concert halls, museums, art galleries, etc. Part 1 deals with a general introduction of the challenges, a discussion of who can afford formal entertainments, and changes in the ways governments, corporations and foundations are funding arts projects. Part 2 will turn to changes in the ways Americans attend performing arts events and visit visual arts venues. Part 3 will survey a number of formal entertainment venues.

As noted in an earlier article on the new normal for downtown, successful formal entertainment venues undoubtedly can be strong assets for the downtowns in which they are located. However, the success of such venues has long been uncertain and challenged because,  from their get-goes, they are the equivalents of loss leaders for their districts. Most are nonprofit operations that sell tickets  to events/performances or charge visitors admissions fees that seldom cover their full costs. For example, among performing arts centers,, be they large or small, only about 40% of their operating costs usually are covered by performance revenues (1). To survive financially,they must be able to tap a number of “charitable” revenue streams, e.g.,  grants, bequests and other donations from government agencies, corporations, charitable foundations and individuals. This financial dependence makes them vulnerable.  Evidence suggests that recent trends have made their financial success significantly more difficult to achieve. Funding for the arts took a big hit during the Great Recession, with  its full recovery still in doubt, while research studies have consistently shown attendance at performing and visual arts venues  has been changing, in some instances declining significantly for over a decade.

In the performing arts,  the fees of performers — be they individuals or groups — are related to their popularity. The ability of a venue to attract them will depend on its seating capacity and the ticket prices it can command. Consequently, as more communities with comparatively limited market area populations and wealth try to develop such venues, they often find that their smaller potential audience base, seating capacity and financial resources require adjustments of their aspirations and a fine-tuning of their programs. In other instances, formal entertainment facilities have been built that just have too much capacity for their market areas or are weakened by new competing formal entertainment centers within their market areas

The arts as an engine of economic growth and downtown revitalization too often seems to have achieved the exaggerated status of a religious credo among downtown advocates or the unrealistic expectation among some of them of being the “silver bullet” solution path to economic rebirth. While the arts undoubtedly can contribute to economic growth, their ability to do so will depend on arts venues and programs being planned and designed in a manner congruent with local needs, behaviors and resources. This challenge is now made more complicated by the fact that these local needs, behaviors and resources may be subject to substantial change.

Consumer Expenditures for Entertainment Admissions and Fees.

Tickets admission fees are an important revenue source for the organizations that operate formal entertainment venues. The less revenues they realize from tickets and admission fees, the more they must rely on obtaining outside funds from government agencies, corporations, foundations, and individual donors. The fees can vary. For example, the Cincinnati Museum of Art has free admission; the Columbus Museum of Art  charges $12; the Museum of Modern Art in NYC has a $25 fee; the ticket prices for Broadway shows and tickets for concerts by major attractions can reach well over $100 in prime venues.  Obviously, the affordability of these

Entertainment-CEX-2011-qunits

admissions is a function of both their prices and the incomes of those who would purchase them.

Formal entertainment venues that charge relatively high prices are in a sense targeting  more affluent households and a downtown entertainment niche based on a cluster of such venues is likely to be a feature that helps draw affluent households or young people with a lot of discretionary spending power to want to live in or very near to the district. During the 1960s, 70s and 80s attracting such residents was just a long-term goal of many downtowns leaders. Today, in a growing number of downtowns, that goal has been achieved  and they are stronger for it. Sophisticated formal entertainment venues that feature major attractions that have substantial admission fees are probably well suited for such downtowns. But, a lot of downtown users, be they current or potential, are being priced out of using these formal entertainment venues.

The table above shows that nationally, in 2012, 56% of the expenditures for entertainment fees and admissions came from those in the top 20% of the households sorted by annual incomes. The mean annual household income in this quintile was about $167,000.  Those in the top two household income quintiles, with average annual incomes over $75,900, accounted for 77% (56% +21%) of all entertainment fees and admissions.

The general thrust of these findings is not new: the more affluent have long spent more on entertainment, especially the arts. What is new are:

  • The emergence of deliberate consumers  in middle income households who have reduced discretionary incomes and for whom discretionary entertainment expenditures now are a lower priority than in years past (2)
  • The income stagnation and general economic decline of middle income households, a trend that preceded the Great Recession, but recently has become a hot political issue.

NEA--Percent-Adult-attendance

The implications for many downtowns are:

  • More than ever, ventures to establish new formal entertainment venues must be calibrated in their ambitions, designs and costs to the financial resources of local residents that might be tapped through admissions, fees and donations
  • Such ventures are more likely to succeed in communities that have greater residential wealth, especially if capital investments in new buildings,  busy event/performance schedules and pricey admissions fees are involved
  • In smaller and less affluent communities such ventures are very likely to need strong long-term government subventions and grants from corporations, foundations and community organizations. Most downtowns are likely to fall in this category. In these communities, the presence or absence of very broad support among local residents, the business community and elected officials can be the deciding factor in whether this critical external financial support will be obtained. Often such strong support is mobilized around something or someone that is a source of considerable community pride or identity, such as the artist Grant Wood in the Cedar Rapids (IA) Museum of Art and life on the plains and the Oregon Trail in the Legacy of the Plains Museum in Gering NE.
  • Many of the downtowns with weaker financial resources to tap  might do well to consider that many Americans see art exhibitions and attend performing arts events not only in museums, theaters and concert halls, but also in parks or other open air facilities, restaurants, bars, nightclubs, community centers, places of worship, college campuses, etc. (See table above).

 Grants for Arts Nonprofits

Since the onset of the Great Recession, it has become more difficult for arts nonprofits to get the grants they need from public sector agencies, corporations and foundations. An unanswered question is whether this funding trend will turn around as the nation’s economy improves. Downtown leaders considering the development or expansion of formal entertainment venues might benefit from understanding the topography of these new financial support patterns for the arts.

Public-Funding-for-the-Arts-2013

Public Sector Funding.  It is important to understand the magnitude of the public sector’s financial support for the arts. It now only accounts for about 7% of the revenues of arts nonprofits nationally and, adjusted for inflation, between 1992 and 2013 public funding declined by about 30%.  FY2013 was the first fiscal year since FY2008 that aggregate public sector funding for the arts has increased, but it is still far below former high years (3).  The National Endowment for the Arts (NEA) only accounts for about 12% of the public sector funding. Its expenditures are not expected to increase significantly anytime soon.

County and municipal governments account for 63% of the public funding for the arts and they recently have shown signs of increasing their funding levels as their economies improve and the impacts of natural catastrophes (e.g., Hurricane Sandy) abate. However, local governments in more densely populated areas often face a large number of requests for arts funding and that usually results in many relatively small grants.

Corporate Support. Unfortunately, data are  unavailable for small and medium-sized corporations, but the major findings of a recent report by CECP and The Conference Board on giving in 2012 by large corporations are still illuminating (4):  though large corporation giving increased by 42% from 2007 to 2012, funding for the arts decreased by about 40% during that period (5)!

On the hopeful side for a resurgence in corporate arts funding is the fact that giving to the arts remains popular among the corporations; it is the size of their contributions to the arts that have decreased. But, changes in corporate behaviors and preferences suggest that such a resurgence is not likely to happen any time soon:

  • Education and economic development have become much more important funding priorities
  • More corporations want to make in-kind donations and arts organization may find it difficult to benefit from bulk product donations
  • Corporations are increasingly seeing giving as part of their corporate strategy and less as charity
  • Corporations are increasingly reviewing their giving from a return on investment (ROI) perspective and nonprofits often do not know how to provide the needed metrics (6)

Foundations. Since about 81% of America’s larger corporations have foundations and they account for about 35% of their corporations’ total giving, there is some overlap between corporate and foundation funding (7).

In 2011, the last year for which there appears to be available data, there was a familiar pattern: while there was a 25.3% increase over 2010 in overall giving by 419 foundations, the increase for the arts was a marginal 0.5%. Here again, the arts’ share of the number of grants remained unchanged (8). However, a “larger share of arts grant dollars provided operating support than most other fields” (9).

 Endnotes

1. Harac Consulting, “Evaluation of SOPAC.” October 2011, p.3. http://southorange.org/SOPAC-finalPDF.pdf

2. See: https://www.ndavidmilder.com/downtown-revitalization/the-deliberate-consumer

3. Ryan Stubbs “Public Funding for the Arts: 2013 Update,” GIA Reader, Vol 24, No 3 (Fall 2013): http://www.giarts.org/article/public-funding-arts-2013-update

4. CECP and The Conference Board, “Giving in Numbers: 2013 Edition.”

5. Ibid, page 20.

6. See:ARTSblog » Blog Archive » Michael Stroik. “Corporate Funding Came Back After the Recession, But Did it Leave the Arts Behind”_ (from The pARTnership Movement, an initiative of Americans for the Arts) posted Oct 4, 2013 and ARTSblog>> Judy Belk, “As Corporate Giving Bounces Back, Six Things Nonprofits Need to Know,” posted December 13, 2013.

7. See endnote 4, page 5.

8. Steven Lawrence and Reina Mukai, “Foundation Grants to Arts and Culture, 2011 A One-year Snapshot,” Foundation Center, GIA Reader, Vol 24, No 3 (Fall 2013), http://www.giarts.org/article/foundation-grants-arts-and-culture-2011

9. Ibid.

© Unauthorized use is prohibited. Excerpts may be used, but only if expressed permission has been obtained from DANTH, Inc.

So…Surprise! You have a lot of suburban creatives…

Posted by N. David Milder

Introduction. Within the economic development community considerable attention has been focused on young, hip knowledge workers and artists. These young hipsters are part of what Richard Florida has termed the Creative Class. Nationally, they have been drawn in recent years to very dense urban areas that they have helped revitalize, from both residential and business perspectives. It is for these reasons that many economic development organization (EDO) leaders have based their revitalization strategies and business marketing programs on the attraction and growth of these “young creatives.”

However, Florida’s definition of the creative class is in terms of occupations, not age. The occupations Florida uses to define the creative class are from the Standard Occupational Classification (SOC):

  •  Super Creative Core: Computer & mathematical; life, physical & social science; architecture and engineering; education, training and library; arts, design, entertainment, sports, media
  •  Creative Professionals: Management occupations; business & financial operations; legal; healthcare practitioners & techs; high-end sales & sales management

chart

Going unnoticed –as is probably the case in many of our nation’s large metro areas – is the fact that the heavily suburban counties in Northern NJ also have a lot of workers in these creative class occupations. For example, in 2010, Bergen County had 148,150; Middlesex 141,550; Mercer 112,050; Monmouth 86,350; Somerset 74,600 and Morris 103,500 (see table above). Importantly, many creatives also live in these counties: e.g., in 20011 the numbers of resident creatives were: Bergen 196,892, Middlesex 163,910, Mercer 74,541, Monmouth 125,545, Somerset 80,624 and Morris 120,035. As a result of career stages and geographic location, these “suburban creatives” are older, more likely to have families, have higher earnings and higher net worths, and live in single-family homes than the urban hipsters. Moreover, the suburban creatives are equally, if not more, creative and entrepreneurial. Significantly, they do not have to be attracted to these counties — they are already there. They account for a significant part of the healthy and very desirable residential areas in these counties. Also, the downtowns in these counties that have been able to respond to the suburban creatives’ lifestyles and spending patterns have had successful revitalizations: e.g., Englewood, Red Bank, Ridgewood, Westfield, Morristown, etc.

The presence of the creatives means greater job growth. DANTH’s analysis shows that in the 14 Northern NJ counties that Regional Plan Association includes in the NJ-NY-CT Metropolitan Region, there is a correlation of .81 between the number of creatives in a county’s workforce and the number of new jobs projected between 2010 to 2020 by the state’s Dept. of Labor; the correlation between creatives who live in the counties and their job growth was .92. Looking just at the eight heavily suburban counties of Bergen, Passaic, Middlesex, Mercer, Monmouth, Somerset, Morris and Ocean the respective correlations are .84 and .93. In the 14 counties, there is a strong association, .91,  between the number of creatives who live in a county and the number of creatives who are in a county’s workforce.

Economic Strategy and Program Implications. Many EDOs in Northern NJ, be they EDCs, SIDs or municipal or county departments, may want to alter their strategic thinking, marketing and recruitment programs to better leverage their considerable creative manpower assets.

Because economic development in these counties is heavily viewed through retail and office development lenses, one area in which these assets have been minimally leveraged by EDOs is the creation and growth of small businesses operated by creatives. DANTH’s trends analysis suggests that the creatives can be expected to be increasingly entrepreneurial in coming years:

  • Nationally, the workforce is becoming increasingly composed of “contingent” workers, often creative freelancers. One estimate, by Intuit, sees as much as 40% of 2020’s workforce being contingent. Many young creatives have long followed the freelancer path at the beginning of their careers. Older creatives, who are either laid off or seeking career changes, have also followed this path later in their careers. We can expect more of them to do so in the future.
  • Many boomers are changing their careers as they enter the pre-retirement 55-64 age group, which has a high rate of entrepreneurialism compared to other age groups
  • Retired boomers are increasingly starting new careers because they still want to be active and/or they need the income.

The young creatives and their more mature colleagues bring different asset and need sets to starting a business in terms of training, experience, the size and reach of their professional social networks, and their financial resources. Nevertheless, both groups will:

  • Most probably be inexperienced as entrepreneurs and may need to acquire skills in marketing, bookkeeping, business planning, etc.
  • Need to raise capital (mostly new firms with employees)
  • Possibly need to hire employees (the non-freelancers)
  • Need attractive and convenient places to meet and exchange ideas with other new entrepreneurs and potential clients/customers
  • Need commercial spaces for their new businesses (the non-home office operations)
  • Prefer business locations where these needs can be maximized, especially those that are really easy to get to on foot or by car, bus or rail.

The range and depth of these needs will differ mostly not by age, but, as indicated above, between those who are freelancers with no employees and those who are creating firms, usually incorporated, with employees.

Given the relative dispersion in the suburban counties, their stronger downtowns, often their county seats, (e.g., Freehold, Morristown, Somerville, New Brunswick) may be the best geographic locations for meeting these needs. Their existing economic agglomeration offers a density of businesses, government offices, commercial spaces, professional and financial services, restaurants, coffee houses and watering holes in a reasonably walkable area. But, to meet the most pressing needs of the new and budding entrepreneurs, these downtowns may have to develop a more specialized “entrepreneurial infrastructure.” By doing so, the downtown itself becomes a kind of informal incubator/accelerator. Some possible components of such an infrastructure are:

  • A cadre of technical assistance/entrepreneurship advisors available at nearby colleges and universities or at a SBA Small Business Development Center or at local business consulting firms or through organizations such as SCORE. Helpful would be a mechanism to easily link the entrepreneurs to the types of advisors they need
  • Besides commercial banks, SBA, and personal investors, these new and developing companies would benefit from having access to other sources of capital such as angel investors, venture capitalists and crowdfunding. Here again, a mechanism to help link the entrepreneurs to these various types of investors would be helpful
  • Coworker spaces are finding increasing acceptance across the nation. They can be used by freelancers, new companies or small existing companies. They can function as a kind of “business incubator lite” or provide some business acceleration functions for older firms
  • A full blown business incubator and/or a business accelerator
  • A variety of relatively small and affordable spaces for a) freelancers who do not want to work at home or in a coworker space and b) firms that either are too large for or also do not want to be in a coworker space. These spaces can be in the downtown or elsewhere within a reasonable drive of the downtown
  • A mechanism to help link freelancers to project opportunities and where they can get things like health insurance
  • A permissions and approvals process that is truly timely and affordable for new firms be they startups or new move-ins. Most jurisdictions that think they have a good process upon close inspection are shown to need significant improvements.

(Note: this list is not meant to be exhaustive, but suggestive.)

Some of these components or parts of them may already exist in and near the downtown. Others will have to be created whole or in part.

Some pilot organization is needed to:

  • Design the downtown’s entrepreneurial infrastructure in terms of its components. This effort should bring into play the major local government agencies having economic development responsibilities, relevant EDCs and any downtown SIDS/BIDs. Most importantly it also should bring to the table major landlords and experienced businesspeople who live and/or work in the county, especially those who are experienced business investors or well networked with those who are
  • Create an implementation plan that would cover how it would be financed and who would do what
  • Create an organization to manage this infrastructure or designate an existing organization to do so.

Downtown and County Benefits. Some potential benefits of such a program are:
For a downtown:

  • Better business retention through the strengthening of some of its small businesses: helping some survive and others to grow in the downtown.
  • A stronger cadre of freelancers with an increased ability to afford needed downtown goods, services and amenities
  • Significantly more small businesses wanting to locate in the downtown
  • Significantly more small businesses wanting to use the downtown’s goods, services and amenities
  • The development of an image of the downtown as a very business friendly place that is exciting because it is savvy about what small firms need to grow and succeed — and it provides those things
  • The consequent greater attractiveness of the downtown as a business location to other and even larger firms, with associated impacts on commercial rents, the assessed values of commercial buildings, property taxes, jobs, etc.

For its county:

  • A program to help increase the success rate of the county’s growing number of county residents who become new entrepreneurs, be they freelancers or incorporated
  • A program to help more of the county’s existing small businesses to grow, with commensurate job growth and need for additional commercial spaces
  • A program that will spawn new firms with new jobs and a need for additional spaces
  • The ability to develop a business marketing program that puts the “creatives” spin on the county’s skilled workforce and leverages its small business development advantages to attract older and more substantial firms.

So You Don’t Have a Lot of Hip Young Professionals…

Posted by N. David Milder

Introduction

For over a decade Richard Florida and Joel Kotkin have dueled over the proper way to analyze regional economic growth and their conflicting political and urban/ suburban preferences. They do agree, however, on one very basic and critical point: in today’s world, economic growth is very dependent on knowledge and geographically will tend to flow to areas where the knowledge workers cluster. (1)

Unfortunately, many within the economic development community have come to have a disproportionate amount of focus on and regard for one type of knowledge worker, the young hip urban professional. Too often communities feel unable to secure their economic futures because they have few young hip professionals or are led into futile attempts to attract them. Frequently overlooked are other assets that these young hipster deficient communities do have and that could be leveraged into economic growth.

Attention to young urban professionals within the economic development community predates the Florida-Kotkin “debates,” emerging in the 1980s. Once called “yuppies,” by the 1990s that term had became pejorative and worn out because of the segment’s behaviors and luxurious lifestyle. Later, around 2000, Richard Florida came along with his creative class theory that helped refocus attention on young knowledge workers and artists whose presence and behaviors shaped the hip, open-minded and welcoming urban communities that are conducive to growing creative class clusters. (2) About the same time downtown real estate developers and retailers had discovered the economic clout of these young well-educated urbanites, whom some referred to revealingly as “walking wallets.” Some developers of downtown residential buildings even had them specifically designed to suit this market segment in terms of apartment layouts, amenities and leasing policies. (3)

Googling “the importance of hip young professionals in economic development” brings up a host of articles that proclaim the economic significance of having a throng of young professionals in your community. For example, an article in the Richmond Times Dispatch stated:

“Based on lessons learned from “urban hub dynamics,” the long-term economic prosperity of metropolitan areas will be based, in part, on how quickly a region can become recognized as one of these preferred places for young professionals to live and work today.” (4)

However, there has been a well-known unevenness in the ability of metro areas to grow and/or attract young, hip knowledge workers. Consequently, many cities that did not have a lot of young professionals or that were losing them to hipper cities, have taken on action programs specifically aimed at wooing them, e.g., Cincinnati, Pittsburgh, Richmond, Memphis, Tampa, Indianapolis, Baton Rouge, St. Louis, Milwaukee, Tallahassee, and Fresno. (5).

Even within young professional rich metro areas, the geographic distribution of the young professionals usually is lopsided, taking on a split that leaves the suburbs well behind the urban cores. Does that mean that these suburban communities and their downtowns are doomed economically because of their young professionals deficits?  For them to try to replicate big city hip neighborhoods on a much smaller scale in and around their downtown areas may be an appealing strategy, though one of often questionable viability. Consider Richard Florida’s explanation of why young professionals are drawn to urban locations:

“Urban living provides them with thicker job and dating markets, opportunities to share rent with roommates, and plenty of things to do in their off hours, from bar-hopping to attending graduate school.” (6)

Suburban communities that want to erase a young professionals deficit need to have sufficient and appropriate “thicknesses” and should ask:

  • Are they basically bedroom communities with a supportive downtown or are their downtowns regional commercial centers?
  • Can they generate enough knowledge worker employment opportunities nearby?
  • Can they provide a density of entertainment/leisure activity options that approaches those of large urban neighborhoods?
  • Can they reach a young professional critical population mass that can attract other young professionals?
  • Can they provide affordable and attractive downtown rental housing and will the landlords do leases when roommates are involved?

Perhaps suburban communities and metro areas with young professional deficits should have a more realistic perspective on the economic advantages of young professional populations and then take an in-depth look at other assets that they do have for leveraging economic growth.

Putting Young Professionals in Perspective as Economic Growth Assets  

Discussions of young professionals often conjure up images of brilliant young entrepreneurs such as Bill Gates, Steve Jobs, Larry Page, Sergey Brin and Mark Zuckerberg, who in their 20s founded huge high technology companies in a garage, a dorm room or a makeshift office. (7) These young business titans seem to demonstrate the superior entrepreneurship, high tech know-how and inventiveness of young professionals, an image that is also reinforced by reports of slower adoption of digital technologies by older age cohorts. (8)

Entrepreneurship. Some very credible research done for the Kauffman Foundation clearly shows that people in the 20-34 age group are not the most entrepreneurial, but the least. For example, a 2009 report by Dane Stangler found that:

 “Contrary to popularly held assumptions, it turns out that over the past decade or so, the highest rate of entrepreneurial activity belongs to the 55-64 age group. The 20-34 age bracket, meanwhile, which we usually identify with swashbuckling and risk-taking youth (think Facebook and Google), has the lowest rate. Perhaps most surprising, this disparity occurred during the eleven years surrounding the dot-com boom—when the young entrepreneurial upstart became a cultural icon.” (9)

 Furthermore, another Kauffman study by Robert Fairlee published in 2011 found that between1996 and 2010 the 20-34 age group’s proportion of new entrepreneurs dropped from 35% to 26%, while the 55-64 age group’s proportion rose from 14% to 23% (10)
Freelancers are self-employed, not committed long-term to a client or employer and usually not incorporated. They can be in a wide range of industries and occupations. In many of our urban creative clusters, “creative freelancing” also is a growing trend. For example:

“In a 2005 report, the Center for an Urban Future estimated that 22,000 “creative freelancers”—writers, artists, architects, producers, and interior, industrial, and graphic designers—lived in Brooklyn, an increase of more than 33 percent since 2000. The Brooklyn Economic Development Corporation has dubbed the area from Red Hook to Greenpoint the “Creative Crescent.” (11)

Many of these freelancers are Millennials, i.e., people born between 1977 and 1993. The online freelancer job mart oDesk (sic) had a survey done of “independent workers (freelancers) worldwide who had been active on odesk within 180days.” Unfortunately, no data was provided on how many respondents were from the USA, but, given that oDesk is based in CA and the website operates in English, one might reasonably presume that most respondents were American. Almost 2,000 of the freelancer respondents were Millennials and their views about entrepreneurship are revealing. They are certainly enthused by entrepreneurship though their understanding of the concept is rather untraditional: it is divorced from the notion of starting a business. As Rieva Lesonsky summarized their views:

  • For 90 percent of Millennials surveyed, being an entrepreneur means having a certain mindset, rather than starting a company.”
  • “Aspects of this mindset mentioned included being a self-starter, risk-taker, visionary and someone who ‘spots opportunity.’ ”
  • “Millennials see themselves as building entrepreneurial careers whether they work for someone else or freelance – they don’t necessarily have to start their own businesses.” (12)

In this respect, the Millennials’ “new entrepreneurship,” in both attitude and deed, may help channel them to corporate careers since it is exactly what corporations now are looking for in new hires. According to Eleonora Sharef of Hireart.com:

 “The most successful job candidates… are ‘inventors and solution-finders,’ who are relentlessly ‘entrepreneurial’ because they understand that many employers today don’t care about your résumé, degree or how you got your knowledge, but only what you can do and what you can continuously reinvent yourself to do.” (13)

 Creativeness/Inventiveness. Prima facie, it seems absurd to think that creativity and inventiveness halt completely or significantly after people reach 30 or 35. While there appears to be a lot of conventional wisdom on this subject and a number of opinion-based articles, there are surprisingly few rigorous studies. Also, the linguistic boundaries between being creative and being inventive or innovative are unclear, which makes analysis difficult. That said, if we take even a quick look at artists, be they in the visual or performing arts, they certainly appear to be creative well past their 30s, as the careers of people as diverse as da Vinci, Monet, Degas, Cezanne, Picasso, Matisse, Pollack, Grant, Olivier, Brando, Hepburn, Wilder, Lean, Ford, Allen, Kazan, Spielberg, Bach, Casals, Horowitz, Rachmaninoff and Perlman demonstrate. However, within those careers, many of the artists achieved one or more new styles or techniques that others saw as innovative and inventive. Cezanne, Matisse and Picasso, for example, were well known for their innovations, which continued on through the length of their careers. Among writers, many continued to produce works late in their lives, a small sample of whom might include Charles Dickens, Henry James, Mark Twain, Herman Wouk, Philip Roth, Agatha Christie, George Simenon and John Le Carré.

If we look at the worlds of science and technology a similar pattern emerges, with the exception of mathematics. Within academia it is commonly held that great mathematical achievements are overwhelmingly done by those under 30. Yet, Isaac Newton, who did indeed invent calculus when he was 24, then went on to invent modern physics when he was in his 40s. While Albert Einstein, Werner Heisenberg, Niels Bohr and James Watson did their best work in their 20s, Michael Faraday, Max Planck, Ernest Rutherford, Fritz Haber and Louis Pasteur did theirs in their 40s. (14)

Many of our digital wunderkinds have achieved or try to keep on making significant innovations later in their lives. Steve Jobs certainly made a splash in his 20s when he and Steve Wozniak invented the Apple computer, but he later founded Next and Pixar and many observers feel that his decades later contributions to the iPod, iTunes, iPhone and iPad were of equal or even far greater significance. Bill Gates also made major digital innovations while in his 20s and now is working on globally eradicating major diseases and improving education. Sergey Brin and Larry Page founded Google with their innovative search algorithm while in their 20s and now have their company working on such things as driverless cars and carbon free energy generation. Elon Musk helped found PayPal while in his 20s and now is involved in Tesla electric cars, SpaceX rocket launchers and SolarCity, a provider of solar energy systems. Furthermore, Silicon Valley is known for its many “serial entrepreneurs.”

One rigorous and interesting research project written in 2008 by Benjamin Jones at the Kellogg School of Management reported that the age of the innovators when they attain “great achievements in knowledge” is getting older and older: “The great achievements in knowledge of the 20th Century occurred at later and later ages. The mean age at great achievement for both Nobel Prize winners and great technological inventors rose by about 6 years over the course of the 20th Century. This aging phenomenon appears to be substantially driven by declining innovative output in the early life-cycle.” (15) Moreover, this research seems to show that “a 55-year-old and even a 65-year-old have significantly more innovation potential than a 25- year-old.” (16)

They Like Dense Urban Environments.  If young creatives are not more entrepreneurial or innovative than other age cohorts, then why have they captured the attention of so many within the economic development community? It is not because they play a critical role in Florida’s defining of the creative class, in which the pivotal, all important concept is that of the work people do, whatever their age or education. As Florida has explained, he developed his theory as an alternative to human capital theories of regional development:

 “Human capital theory uses educational attainment (typically the percentage of adults with a college degree), a very broad measure that excludes such successful entrepreneurs as Bill Gates and Steve Jobs, who didn’t graduate from college. My creative class measure is based on the work people actually do, as measured by detailed Bureau of Labor Statistics data. This allows researchers and economic developers to zero in on the actual occupational categories – science and engineering, arts and culture, business and management, meds and eds – that make up the creative class and other occupational classes….

 The creative class is not just a proxy measure for college graduates. Roughly three?quarters of college grads in America work in creative class jobs, but four in ten members of the creative class— 16.6 million workers—do not have college degrees.” (17)

 A more viable explanation of why the economic development community has focused so much of its attention on one subset of the creative class, the hip young creatives, is not the kind of work they do so much as where they like to live and their leisure time and entertainment activities. For decades, the economic development community was searching for a way to revitalize our nation’s urban areas. Numerous researchers, including Florida, Eugenie Birch and, even in some writings, Kotkin, have demonstrated that young professionals’ lifestyle preferences provide a potential solution path: they like living in dense urban environments and are flocking to them. (18)

Also interesting is that fact that this same research has shown that empty nesters, too, like dense urban living and are downsizing from their suburban single-family homes to urban apartments and townhouses. However, the economic development community has focused far less attention on the empty nesters than it has given the young hipsters.

While the hip young creatives may prefer living in dense urban areas, suburban areas can also attract large numbers of residents whose occupations fall within Florida’s definition of the Creative Class. (19) For example, in 2011, Morris County, NJ has 123,629 residents, 49% of the 269,714 in the labor force, who are in management, business, science, and arts occupations. (20) Many non-Millennial knowledge workers who have children prefer living in the suburbs. What proportion of them will move to urban core areas when their nests empty is unknown, but the odds are that significant numbers will stay in their suburban homes and/or communities, perhaps in their own downtowns in newly built or refurbished apartments. Other creatives/knowledge workers, the “lone eagles,” prefer to live and work in scenic rural “Valhallas.”(21)

Attraction for Employers. Many companies like to recruit the best and the brightest out of our nation’s top colleges and universities because they think they are accessing new ideas and techniques. Nonetheless, many firms also have a preference for hiring younger people that is based on bottom line reasoning. For example, it is not unusual to see a number of stories in the media about the age preferences in corporate hiring and the difficulties that people over 40 have in finding new jobs. Many firms prefer to hire younger people because they will work at lower salaries for longer hours, will probably be healthier and have more distant pension payouts than older and more experienced workers. One observer cited data showing that associates in one global law firm work an average of 2,462 billable and unbillable hours a year, 47 to 49 hour a week, though others in the industry claim the weekly total is probably closer to 60 hours. (22) It is not uncommon in New York City to hear claims that firms in the advertising, entertainment and legal industries “like to eat their young.”

Corporations also like to hire freelancers because of lower salary and benefit costs. As noted above, many firms may also like the millennial freelancers’ new  entrepreneurial mindsets.

How this will affect corporate office locational decisions remains to be seen. Certainly there is an interest in tapping this labor market segment in regions where they are present. Often, firms may not have to locate in downtowns to tap this labor market. When making locational decisions many firms will look at labor pools defined by 30 to 45 minute travel times, which means that many urban core young knowledge workers can be tapped from many suburban locations. Some firms may decide for suburban or urban locations depending upon the situation. Google, for instance, has not moved to San Francisco though it has hundreds of white buses transporting its employees everyday from the city to and from its headquarters Mountainview complex, an hour’s drive away. Yet, it also has a very large presence in Manhattan. Also, reverse commuting has been growing in many metro areas.

Population Size. The Millennials, of which the young urban hipsters are a subset, constitute the largest generation, about 23% of the US population, but they are outnumbered by the combined populations of the older and still largely active Gen X with16%, Younger Boomers 14%, and Older Boomers 10%. (23)

 Some Suggested Take Aways

  • There is little doubt that urban areas with a cluster of young hip creatives have a strong asset capable of driving a good part of their revitalization efforts
  • But, if you don’t have a heap of hip young creatives in or near your community, you may have lots of older creatives or some other assets, e.g., gas and petroleum trapped in shale rock, upon which your economic revitalization can be built
  • There probably are more knowledge workers and artistic people who are older than 35 years of age than younger
  • These “mature creatives” are more entrepreneurial and, at a minimum, just as innovative and creative as the younger group
  • In metro areas that are rich in knowledge workers, many of them probably live and/or work in suburban communities and these communities should have revitalization strategies that clearly recognize and leverage this asset
  • It should not be forgotten that many non-Millennial knowledge workers and artists also often live and/or work in dense urban areas, e.g., office workers, teachers and researchers, doctors, lawyers, nurses, architects, etc.

Disclosure

The author is not a Millennial, though he is quite fond of his friends and relatives who are.

ENDNOTES

1.  See for example: Richard Florida, The Rise of the Creative Class: And How It’s Transforming Work, Leisure, Community and Everyday Life, Basic Books, 2002, pp. 402; Joel Kotkin, The New Geography: How the Digital Revolution Is Reshaping the American Landscape, Random House.(November 2000) pp. 256. The family of terms creatives, young professionals, young urban hipsters, knowledge workers, artists are used in this article as basically referring to very similar if not entirely completely congruent groups of people, some being subsets of others.

2. Richard Florida, “Competing in the Age of Talent: Quality of Place and the New Economy,” January 2000, pp. 55

3. Personal interviews with developers from 2003 through 2007

4. John W. Martin and Jack Berry, “Winning young professionals,” Richmond Times Dispatch,  May 20, 2013

5 Haya El Nasser,  “Mid-sized cities get hip to attract young professionals,” Yahoo! News, October 10, 2003

6. Richard Florida, “The Fading Differentiation between City and Suburb,” Urban Land, January 31, 2013, Article 

7. Tom Agan, “Why Innovators Get Better With Age,” New York Times, March 30, 2013

8. Maeve Duggan and Joanna Brenner, “The Demographics of Social Media Users — 2012,” PewResearchCenter, February 14, 2013. http://pewinternet.org/Reports/2013/Social-media-users.aspx ; Kathryn Zickuhr, Generations and their gadgets, Pew Internet, Feb 3, 2011  http://www.pewinternet.org/Reports/2011/Generations-and-gadgets/Report.aspx?view=all

9. Dane Stangler, “The Coming Entrepreneurship Boom,” Ewing Marion Kauffman Foundation, June 2009, pp. 6 p.4. Kauffman’s research looks at “all new business owners, including those who own incorporated or unincorporated businesses, and those who are employers or non-employers.”

10. Robert W. Fairlie, “Kauffman Index Of Entrepreneurial Activity 1996 – 2010,” Kauffman Foundation, March 2011, pp. 28, p.9.

11. Kay S. Hymowitz, “How Brooklyn Got Its Groove Back: New York’s biggest borough has reinvented itself as a postindustrial hot spot.” City Journal, Autumn 2011,  www.city-journal.org/printable.php?id=7527

12. Rieva Lesonsky, “Millennials Are Rewriting the Rules of Work and Entrepreneurship” reports on a survey that had a full sample of 3,193, of which 1,958 were Millennials and was done by Millennial Branding for oDesk. For the oDesk slideshow on the report see: http://www.slideshare.net/oDesk/millennials-and-the-future-of-work-survey-results

13. As described in Thomas L. Friedman, “How to Get a Job,” New York Times, May 28, 2013, NYT Article here

14. See: http://www.scieditco.com/images/agescientists.html

15. Benjamin F. Jones , “Age and Great Invention,” Kellogg School of Management,  April 2008

16. See Tom Egan above

17. Richard Florida, theatlanticcities.com/jobs?and?economy/2012/07/what?critics?get?wrong?about?creative?class/2430/

18. Eugenie L. Birch, “Who Lives Downtown,” November 2005 • The Brookings Institution • Living Cities Census Series, pp. 20

19. Kris Hudson, Wall Street Journal, May 15, 2013,”Is Generation Y a ‘Game Changer’ for Housing?”

20. Source: U.S. Census Bureau, 2007-2011 American Community Survey

21. See: Philip M. Burgess, “Lone Eagles Are a Varied Species,” The Rocky Mountain News, April 12, 1994 and Joel Kotkin, The New Geography cited above

22. Steven J. Harper, “The Tyranny of the Billable Hour,” New York Times , March 28, 2013, http://www.nytimes.com/2013/03/29/opinion/the-case-against-the-law-firm-billable-hour.html

23. Pew Research Center’s typology of generations was used with national census data for 2011 to compute these population estimates.