Posted by N. David Milder
Introduction
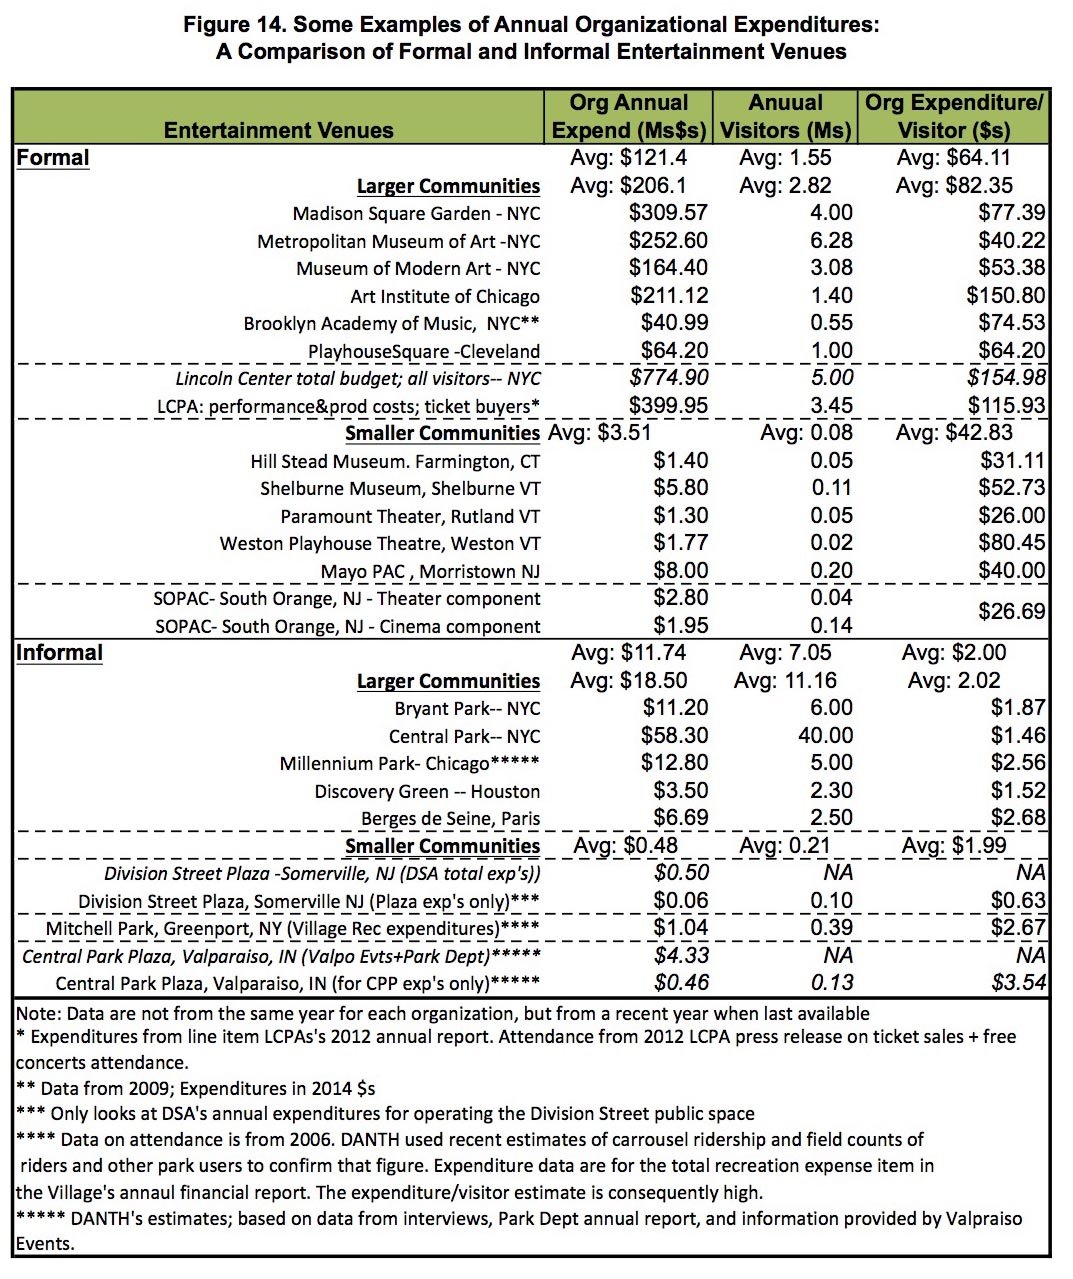
Over the last few years, my thinking has increasingly focused on how, under the new normal for our downtowns, it is increasingly important to strengthen the central social district functions of all downtowns and the challenges faced by downtown revitalization efforts in smaller communities. Strong entertainment niches, which can have formal and informal components, help assure the vitality of central social districts. So far in this series of articles on informal entertainment venues, the focus has been on Bryant Park (BP) as a model of that type of venue. In the previous parts of this series, the data and arguments presented supported the proposition that these informal venues can be more affordable to create and operate than the formal entertainment venues and consequently better able to serve as early cornerstones upon which a strong entertainment niche can be built. Since BP is located in our nation’s largest city, many may question its relevance for smaller communities where populations, attendance, and resources are likely to be substantially thinner. Consequently, this article will take a closer look, often using BP as a lens, at the three informal venues in smaller communities that were presented in Parts 2 and 3: Central Park Plaza in Valparaiso, IN; Mitchell Park in Greenport NY and Division Street Plaza in Somerville, NJ (1).
The Roles of the Informal Entertainment Venues in the Three Smaller Communities.
Before looking at the three informal entertainment venues, it is useful to look at the communities where they are located to get both a sense of the roles these venues play in their downtowns and an idea of why I selected them for analysis.
Valparaiso, IN. Earlier this year, I searched the Internet for the best public spaces in smaller communities. The most useful result I found was a list on the Planetizen website naming the 100 best public spaces in the nation. However, among those listed, I could not find any in communities with populations under 35,000 that were appropriate (2). I then sent out emails to people I know who are either consultants specializing in public spaces, the coordinators of state Main Street programs, or consultants who specialize in smaller communities, asking for information about really good public spaces they knew of in smaller communities.
The sole reply was from Bob Kost of SEH, who had designed the Central Park Plaza in downtown Valparaiso IN. Bob and I recently had worked together on a project in Gering NE. My follow-up research revealed that the park had significant attendance and just a few months after its opening, in 2011, it had won so much popular and political support that the city committed to its expansion (which is now under construction). In September 2014, I visited the park and met with local officials, who graciously have provided me with the information I pesteringly requested (3).
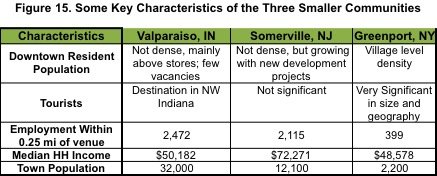
Valparaiso is located in northwest Indiana, about an hour’s drive from Chicago and is the county seat of Porter County. It has a population of about 32,000. “Valpo” is a real middle-income town: its households have a median income of $50,182 that, nationally, is in the 3rd income quintile. About 2,472 people are employed within a quarter mile of Central Park Plaza, with 41% working for the county or the city (4). The four largest employers in the city are the health system, the university, the local school system and the county government. The downtown residential population is, unsurprisingly, not dense, though the available units, located mostly above shops, have few vacancies. The local chamber claims that in recent years the city has seen substantial economic growth, with “…$40 million in public investment, nearly $700 million in private investment, redevelopment of a five-block downtown area, and two key corridors into the city” (5).
The city’s leadership sees downtown revitalization as critical to the economic health of the whole community. For example, at the groundbreaking for Phase 2 of Central Park Plaza, Mayor Jon Costas stated:
“Years ago when we started thinking about how we could make Valparaiso stronger, one of the things we identified was the downtown. I knew intuitively that the downtown is the heart of our city, and the heart has to be healthy for the whole body to function”(6).
Moreover, the city leaders are strategically savvy about how to accomplish that goal: by building a strong “hospitality niche” in which Central Park Plaza is seen as an essential cornerstone. Restaurants and watering holes are the other key downtown components of this niche. The leadership’s aspirations for growth as a tourist destination are levelheadedly calibrated, focusing regionally on the NW Indiana market area in which they believe they already have significant recognition and penetration. Also, they seem to understand that entertainment events and opportunities will draw far more people than can just the performing or visual arts, though the performing arts are certainly given a significant place on the park’s event schedule (7).
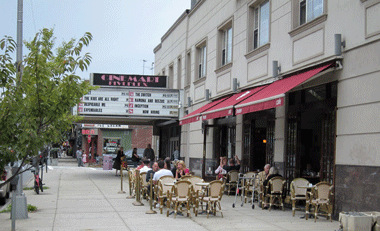
Greenport, NY. To find the other informal entertainment venues I needed for this article, it seemed best to look at those in smaller communities that I knew about and liked. Mitchell Park in Greenport, NY was one of them. My wife and I have been going out to Greenport NY for day or weekend trips since 1988. Over the years, I had observed the troubled waterfront properties, then watched as they were turned into Mitchell Park and since stopped by the park on every return visit. I was taken by the fact that a community this small could complete such a large, complicated and attractive project. Victor Grgas and I gave a presentation at the IEDC’s 2006 annual conference in which Mitchell Park was one of three downtown projects I discussed. To prepare for that presentation, I interviewed several residents and local merchants as well Mayor David Kapell, who provided information about the park’s development challenges, costs, attendance and impacts. For this article I revisited the park in July 2014, when I spoke to the village administrator and people who were managing the marina and carrousel.
Greenport is located on the North Fork at the eastern end of Long Island. It has a significant waterfront with docking facilities for pleasure boats, a small fishing fleet and a ferry to Shelter Island. It also has the terminus for an important line of the Long Island Railroad located near the ferry and the park. Within easy drives of the village are over 40 wineries that attract heavy tourist traffic to their tasting rooms. There are three of historical sites abutting or near the park including a working blacksmith shop and a maritime museum. It is a significant tourist destination and transit point.
Greenport has a year round residential population of 2,200, but its daytime population increases significantly during the tourist season with transient guests and the return of second homeowners. While its median household income is $48,578, the spending power present in the community increases noticeably with the return of second homeowners and the influx of boat owners and other financially comfortable transient tourists. The seasonality of the local economy is reflected in many of the shops and restaurants closing for the winter, something that happens in many other tourist dependent communities. Only about 399 people normally are employed within 0.25 miles of Mitchell Park (8).
The properties that eventually became Mitchell Park occupied a geographically strategic position on the waterfront in the downtown’s core. They also were on Front Street, the village’s main entry corridor and close to or abutting the historic sites, the ferry, waterfront restaurants, the movie theater, the post office and many shops and eateries. Decades back, the site was occupied by a successful restaurant and marina business. In 1979 it burned down and the site remained blighted for over 15 years. It also had some serious brown field issues. It was viewed by many residents as a “cancer” on the community (9). The process to revitalize it took 14 years and was often arduous, conflictual, and political. After a design competition, SHoP was selected as the park’s designer. Its planning process had considerable public input. The development of the park was done in three phases and finally completed with the opening of the marina in September `2006.
After the post WW II closing of two shipyards and the decline of its fishing fleet, the village’s economy sputtered for decades. The Mitchell Park project was seen by many local leaders, especially Mayor Kapell, as a critical component of the village’s economic revival. Making the park a strong attraction for local children and families was understood, in effect, as a means of strengthening the village’s downtown as its central social district, as Greenport’s version of a Roman forum. That became the project’s primary goal. However, there were some local residents who argued for condo development on the site because of the potentially large tax revenues for the village (10).
Drawing more tourists was another important goal of the Mitchell Park project, with the business community pushing for a new marina as the means of achieving it:
“In addition to the park, the adopted plan included redevelopment of the shoreline of the property as a transient recreational boating marina and a major deep-water pier to accommodate tall ships and other large visiting vessels. This component was widely viewed by the business community as essential to strengthening the village’s increasingly tourist-based economy” (11).
The revived waterfront has certainly proved to be a strong asset for attracting tourists. For example, an annual three-day Maritime Festival reportedly draws about 40,000 visitors and the less frequent, multi-day Tall Ships events can attract over 60,000.
Somerville, NJ. This borough, with a population of about 12,000, is the county seat of Somerset County, which has a population around 323,000. The county’s residents are relatively affluent. Their median household income of $98,571 squeaks them into the nation’s top income quintile. There is also a strong presence in the county of people in “creative class” occupations, though they tend to be the mature creatives who have nested and not so much the young, single hipsters. DANTH estimated that in 2011, about 39% of the county’s workforce were in creative occupations, as were 51% of its residents, the highest percentage for any county in NJ (12).
Somerville has a median household income of $72,271, placing it in the nation’s second highest income quintile. The borough was the second downtown in NJ to create a SID, NJ’s version of a BID, that is managed by the Downtown Somerville Alliance (DSA). However, for many years, its downtown’s revitalization did not keep pace with other communities such as Westfield, Englewood and Cranford. Recently, however, that pace has quickened, with some major mixed used projects, a new supermarket and a parking garage being either completed, under construction or planned. Downtown residential growth may be significant. One important factor in this surge of redevelopment is that Somerville will now have direct rail service to Manhattan on NJ Transit’s Raritan line. All over NJ, the provision of this service has sparked downtown residential development and a general lift in property values near the stations.
According to Beth Anne Macdonald, the executive director of DSA, Division Street is strategically important because: “It is located in the geographic heart of the Downtown, it was (and is) critical for it to be a heart full of life. It used to act as a visual and physical deterrent for foot traffic and it now acts as a magnet” (13). It is a two-block long side street that provided easy access to the local post office and commuter rail station that has 622 boardings per day. With an aging infrastructure, a 30% street level vacancy rate and a 50% rate for second floor commercial, it was considered a blight in an otherwise healthy downtown (14). In 2008, Division Street was designated as the arts district for Somerville and a pop-up art gallery event was created to combat vacancies.
In 2011, the Borough Council, municipal planner and DSA began to think about more substantial and permanent changes. This eventually resulted in the implementation of a plan to focus on one 420-foot long block, to be named Division Street Plaza. That block, the Plaza, was rebuilt in 2012 and closed to traffic for a trial period of one year. In effect, this created a trial pedestrian mall. In 2013, after that trial was officially deemed a success, it was closed permanently to traffic. A new one block long pedestrian mall was officially born. That does not happen too often these days.
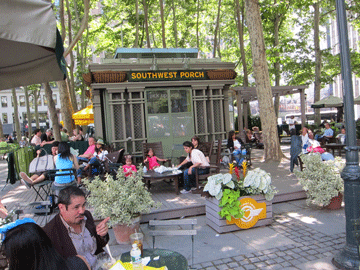
During this birthing period, the DSA became increasingly responsible for the Plaza and instrumental for its success. It was designated as the Plaza’s manager, responsible for its events and maintenance, except for snow removal. Most importantly, it was the DSA that came up with the plan for programming the Plaza in terms of both events and infrastructure, and it was responsible for the plan’s implementation. In this regard, two big influences on DSA’s thinking were PPS’s Porch Project in Philadelphia and BP – the Plaza’s chairs, tables and umbrellas are just like those in BP. Remarkably, there had not been any planning about event and infrastructure programing until DSA took on the task.
Division Street Plaza caught my attention back in 2013 because its apparent success countered my long held skepticism about pedestrian malls. True, some of my favorite downtown places — e.g., Church Street in Burlington, VT, Fremont Street in Las Vegas and the Third Street Promenade in Santa Monica, CA are thriving examples of such spaces. However, I have witnessed many others that failed and still others that were deeply troubled at one time or another, e.g., the one block-long 165th Street Mall in Jamaica Center, NY. Furthermore, research has consistently shown that the vast majority of the pedestrian malls that were built — perhaps as many as 89% — had to be closed or repurposed (15)!
Some research indicates that pedestrian malls are more likely to succeed if they are:
- Located near to or integrated with a major anchor such as a university or hospital
- Close to a beach
- Short in length, only 1-4 blocks long
- In a town/city with a population under 100,000
- Located in a major destination for tourists (16).
Based on my own field observations over the years, I also would argue that pedestrian malls rarely are the cure for a declining commercial corridor, an objective that motivated the creation of many, if not most, of them. Instead, when successful, pedestrian malls play a role akin to a supercharger in a car — not its engine — and allow a commercial corridor of modest success to provide visitors with a new, distinct and improved experience that produces even greater commercial success.
I have visited Somerville several times since the late 1980s, most recently in October 2013, when Macdonald gave me a tour of Division Street Plaza. She has since graciously responded to my information requests.
The Plaza’s success – that is supported by a number of indicators discussed below — makes it a rare, interesting bird. It also is a noteworthy example of a “third place” informal entertainment venue that was cobbled together and now operates on a relatively modest amount of financial and staff resources. However, recent research findings do not seem to adequately explain the Plaza’s success:
- While short in length and located in a low population town, it lacks the types of very strong nearby anchors other observers have suggested are essential for a pedestrian mall’s success
- The prior conditions on Division Street seemed to require a lot more than a “supercharger” to remediate.
One conclusion, though, seems certain: some very right things are being done to cause/facilitate/nurture the Plaza’s current success. My hunch is that the Plaza’s short length is definitely a factor as are the proximity of the Post Office and 2,100 downtown workers. However, the DSA and the Borough’s actions, in some ways, also have helped. The physical improvements and activation of the space through the Plaza’s events probably helped. I suspect that the impact of the legitimation it received from its successful performance trial on the way the public saw and felt about it was another important factor — and one likely to be overlooked.
Division Street Plaza
Looking at the Three Essential Functions of Informal Entertainment Venues. Our analysis of BP as a model informal entertainment venue showed that such venues can perform three important and essential functions:
- Providing visitors with a green refuge for resting in peace and quiet;
- Providing infrastructure assets and programs that stimulate visitors to engage in activities (i.e., to “perform”)
- To present events visitors can attend (17 ).
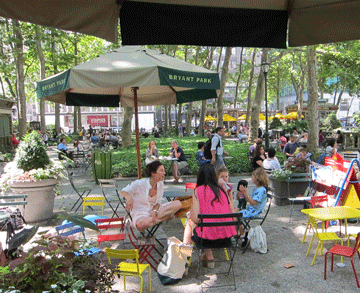
The Refuge Function. BP performs this function by providing lots of chairs, tables, attractive greenery and both shaded and sunny areas where people can sit, relax and observe.
Among these amenities, appropriate seating is the most basic. If you want people to stay in your informal entertainment venue, they will need a place to sit. As William H. Whyte wrote: “The most attractive fountains, the most striking designs, cannot induce people to come and sit if there is no place to sit” (18)
Smaller communities obviously have smaller populations, lower commercial density, lower pedestrian flows and less hustle and bustle. People who live in or visit these communities usually do so precisely because of these characteristics. Consequently, one might expect informal entertainment venues in these communities will have a much lower demand for and consequently tend to put a much lower priority on providing a refuge for peace and quiet. Many of them do just that. For example, Washington Borough, NJ, (population 6,460), recently opened a downtown pocket park that has no chairs, benches or tables and little shade. Still others provide some seating, but little shade.
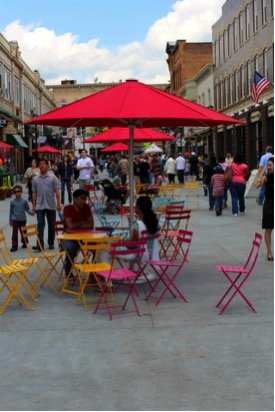
Figure 16. Division Street Plaza’s Cafe Tables and Bistro Chairs
Division Street Plaza, though in a small town, probably has a need for refuge function amenities because it is a pedestrian mall. The successful pedestrian malls all provide these amenities. Also, DANTH very recently estimated that the Plaza’s integrated 30 businesses attract between 116,000 to 128,000 shoppers annually (roughly 380 to 420 per business day), many of whom may appreciate a place to rest or relax. The Plaza has the amenities to meet such needs: 16 cafe? tables, 64 bistro chairs, 8 market umbrellas, 21 planters and 13 hanging baskets (see Figure 16). Additionally, some Plaza eateries have outdoor seating.
These amenities have also helped improve the physical appearance of the block.
The “Engage in Activities” Function. Currently, this probably is the Plaza’s strongest function because it now is succeeding as a pedestrian mall. Visitors come to shop, dine, attend a dance or yoga class, see a doctor or accountant, etc. However, it is important to note that, as the prior blighted condition of this block indicates, this strength is dependent on something quite other than the mere presence of commercial activities. The creation of the Plaza has created an urban ecology that somehow has enabled commercial entities to be more prosperous and/or attract stronger firms. In turn, this has helped attract more visitors.
This integration of commercial activities into an informal entertainment venue is not confined to the pedestrian mall variant; BP and many other urban parks have food related enterprises present year round, while a growing number now have something akin to BP’s seasonal Winter Village of numerous retail and food operations occupying corridors of kiosks.
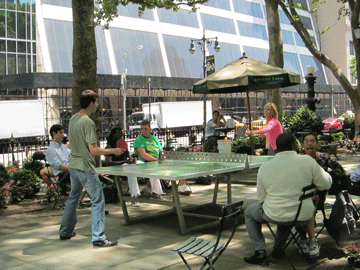
Aside from the limited opportunities provided by some events, such as the heavily child-oriented Festiville, the Plaza currently lacks other activity opportunities for visitors, though I believe seasonal ice-skating is being considered. BP offers a myriad of such opportunities, e.g., a carrousel, ping pong, petanque, chess and many other board games, and ice-skating. Mitchell Park has a carrousel, ice-skating and a shoreline walk. Grand Central Plaza has a spray pad and soon will be adding an ice rink and possibly “climbing art.” The DSA will face several understandable challenges, if it wants to expand its visitor activity opportunities. They are largely defined by the Plaza’s small physical size and the DSA’s relatively small budget: Where can the new activity opportunities be placed on the Plaza? How can their development and operations be funded?
While spray pads, carrousels, ice rinks, and shoreline walks require considerable costs to create and operate, it is interesting to note that none of the three informal venues analyzed here have provided the lower cost activity opportunities, e.g., ping pong, chess and other board games, boules, etc. found in BP. My suspicion is that it would be hard to justify the cost of the staff required to, for example, supervise the distribution and return of equipment given, the probable modest use levels and revenue potentials typical of these low density environments. A carrousel and ice rink can charge user fees and win sponsorships; rentals of chess sets and board games likely have far lower earning power.
BP involves related outside groups with a lot of its activities, e.g., chess, petanque, bird watching. Perhaps these informal entertainment venues in smaller communities can involve social organizations in their communities, e.g., local chess clubs, seniors groups, women’s organizations, etc.
Another possibility is the installation of equipment that is comparatively affordable, can be used directly by visitors and does not require staff to monitor or supervise. The climbing art being considered for Central Park Plaza is one possibility. Swings for adults are another (19). I’m sure they will raise questions about liability, but both have been installed in numerous public spaces in the US and Europe.
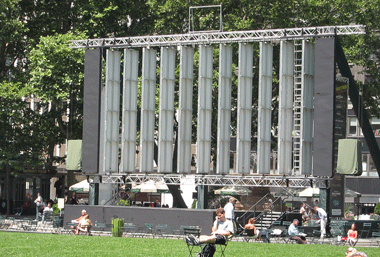
The “Present Events” Function. These events are probably the most visible part of DSA’s Plaza involvement. DSA runs events on 50 days during the year and reports they attract around 100,000 visitors annually. That averages to an impressive 2,000 people per event day. Events include movie showings, FestiVille (see Figure 17), art shows, concerts, a Farmers Market, a beer festival and holiday festivities. Macdonald also reports that:
“In addition to our own events, we have had several downtown businesses host events on Division Street as well as outside businesses come to us wanting to use it. We have an entire application process now for events (loosely based on Pioneer Square in Portland” (20).
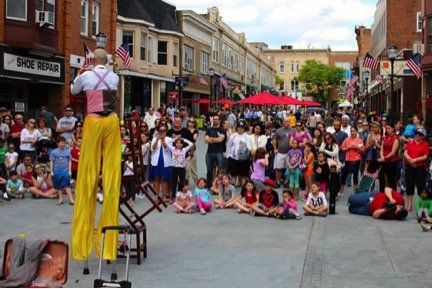
Figure 17. The Plaza’s FestiVille Event
Most events are free, though modest fees are charged for things like children’s rides and petting zoos during Festiville.
Because the Plaza is an outdoor venue, its events schedule thins during the colder winter months. This is a problem that BP, Central Park Plaza, Mitchell Park and many other informal entertainment venues around the country also faced and, in response, all opened or will open ice rinks. The DSA, I believe, would like to follow suit. Because the Plaza is a pedestrian mall it has a version of BP’s Winter Village already built in.
Management and Budget. Of the three venues in small communities, the Plaza is the smallest in area and cost the least, about $675, 000, to create. Financing came from an NJ-DOT grant, municipal investment and DSA funding. However, while the NJ-DOT grant for $500,000 was awarded, it has not been paid and may not be, since the street was permanently closed. The Borough may be left with that funding responsibility, in which case, it may then try to offload the obligation onto the DSA.
The DSA, which is mainly funded by Special improvement District (SID) assessments, now manages the Plaza, responsible for its programing and maintenance. Just as happened with BP, the stewardship of the venue shifted sectors, from public to private. This shift certainly was fortuitous when it came to the Plaza’s programing, both event and physical. One of the most important contributions the DSA made was to broaden the Plaza’s positioning from being an arts district to an entertainment venue in which the arts would still have a significant role. This repositioning is consistent with national market trends and how BP, Grand Central Plaza and Mitchell Park are all positioned (21).
In my opinion, the Plaza venture probably would have failed without the DSA’s taking on its programming and management. The Borough, though, is to be commended for bringing about that shift.
According to the DSA, it spends about $62,500 annually on the Plaza, including staff costs. Again, this is the lowest of the three venues being analyzed. The DSA’s Plaza program, however, is relatively young and still establishing itself. I believe it is very likely that the DSA, in the near future, will want to provide more activity opportunities for visitors to engage in as well as to make its events even more robust. These improvements obviously will require additional staffing and revenues. Following the BP model as well as what Central Park Plaza and Mitchell Park have done, perhaps the DSA might then look to ways of monetizing its offering through fees, admissions, sponsorships, naming rights, etc.
The Plaza’s Impacts. The DSA has assembled a good deal of evidence about the Plaza’s impacts and I find them impressive, especially for a pedestrian mall:
- Within two years the street changed from being blighted, somewhat scary and a pedestrian desert to a location where annually businesses are attracting 116,000 to 128,000 patrons and events are attracting about 100,00 visitors. It has transitioned from being a potent liability to a strong asset
- Within 18 months of completion, the street went from having severe vacancy problems to a 100% first and second floor commercial and residential occupancy rate
- Commercial offerings grew to include vintage clothing, bridal store, cigar bar, lingerie boutique, yoga studio, retro arcade, artisan shops, and ethic restaurants. Macdonald also notes that many of the newcomers are skilled merchants who also have locations in NJ’s suburban Class A downtowns
- In all, 10 new businesses located on Division Street in less than two years creating 40 new jobs, generating $150,000 in construction permits and over $1,500,000.00 in total private investment (22)
- The Plaza’s positive impact has apparently splashed beyond its boundaries. In a survey, 47% of the downtown’s merchants reported that they saw an increase of foot traffic since the Plaza opened. Potential tenant interest in nearby commercial spaces on Main Street is reportedly much stronger (23).
An interesting and important question is how much of Division Street’s economic improvements can be attributed to the creation and operations of the Plaza? After all, downtown Somerville is now experiencing a welcome wave of redevelopment. In response, Macdonald argues that these improvements all appeared before any of these other projects – e.g., a new supermarket and the multi-use Somerville Town Center – were completed.
Too often impact analyses use “multipliers” generated by input-output models. From a downtown revitalization point of view, it can be argued that the information DSA provided is far more relevant and probative than any multiplier generated analyses. The Plaza’s erasure of blight, its visitation numbers and lowered vacancy rates speak directly to the critically important status of downtown Somerville’s urban ecosystem — a system that is influenced by social, psychological as well as economic factors. In contrast, the “multiplier” determined estimates of the direct, indirect or induced impacts of the jobs and expenditures generated by the Plaza would speak mostly to a geographic area reaching well beyond the downtown, Somerset County, and to a short list of economic variables.
Many downtown organizations do not accumulate impact related information. Those, like the DSA, that are affiliated with a state Main Street program are much more likely to gather and use such information. Downtown managers, like Macdonald, who have experience recruiting retailers and developers, are also more likely to appreciate the value of such information and to gather it.
Central Park Plaza
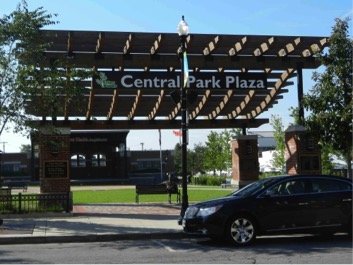
Figure 18. Orville Redenbacher Statue at Entrance to Central Park Plaza, With Amphitheater in Background
Looking at the Three Essential Functions. Central Park Plaza (CPP) is a larger space, with more physical features than Division Street Plaza and has a significantly higher level of annual expenditures. As a celebration of Indiana born Orville Redenbacher and popcorn, downtown Valparaiso has been the location of a popcorn festival since 1979. From 2011, it has been held in CPP –in the above photo, that’s a sculpture of Orville sitting on a bench at the park’s entrance. The event is a very strong attraction – see Figure 19’s “before” photo of its September 2014 crowd. In 1999, the downtown business organization merged with the organization running the popcorn festival, and it is now known as Valparaiso Events (24). It runs the CPP’s events. Combining this organizational expertise with an attractive amphitheater, it is not surprising that the CPP currently performs these three functions with a very heavy emphasis on events.
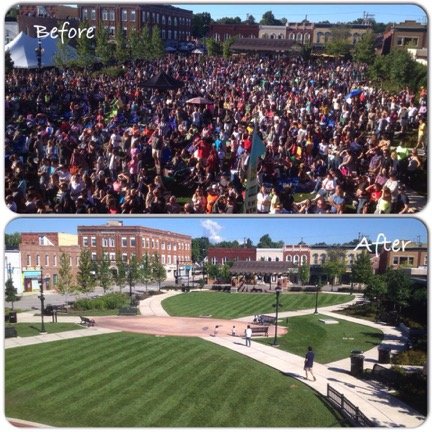
Figure 19. CPP Before and After the September 2014 Popcorn Festival
The Refuge Function. Valparaiso’s population is roughly 2.6 times larger than Somerville’s and the downtown has serious aspirations of being a regional tourist destination. Added to this are the 2,472 people who are employed within a 5-minute walk of the park, a very important pool of potential noontime guests, and the uncounted folks who visit nearby city and county offices. Together, these factors point to a potential demand for seating where people can just sit, rest and observe The new downtown housing city leaders are hoping for could add to that potential demand. I would argue that tourists might especially appreciate that opportunity – even more so if tied in with access to clean and safe restrooms. The number of refuge seeking visitors to CPP may never be more than small fraction of BP’s, but for downtown Valparaiso, it still could be significant. However, currently there are no available data on how many people visit CPP just to rest and relax in a pleasant green location.
As can be seen in Figure 19’s “after” photo, there are a number of benches placed throughout the park. CPP also has restrooms. Most of the seating now is in sunny areas, but that will probably change as this young park’s young trees grow. The CPP’s warmer weather shaded area will also grow when a key feature of the park’s expansion, a “Pavilion,” is completed. It will shelter a skating rink during the colder months.
The “Engage in Activities” Function. The CPP’s strongest current infrastructure feature for stimulating visitors to become active and perform is a spray pad for children, see Figure 20. Unfortunately, there are no statistics on how many children use the spray pad.

Figure 20. CPP’s Splash Pad. Photo by SEH
The new skating rink to be built in CPP’s Phase 2 will certainly strengthen the park’s assets in this functional area. It will also give people a good reason to visit the park during its currently slow winter season.
Consideration, at one point, was given to adding climbing art during the park’s expansion as another attraction for children. If that idea has been discarded, I hope that some other feature that can activate children, preferably year round, will be adopted.
Shopping opportunities are available at the Central Park Plaza Market two mornings a week, June through September. The Market offers: “fresh local produce, handmade products and beautiful plants and flowers” (25).
There are several in-event opportunities for people to be active, not just passive audience members. They seem to especially revolve around eating and drinking: e.g., the Popcorn Festival, the Valparaiso Brewfest and the Valparaiso Wine Festival.
CPP has also become a popular location for private events in which attendees might be active, such as weddings, parties, business meetings, church services, etc. The CPP is rented out for these occasions through the Valparaiso Department of Parks and Recreation (VDPR). The CPP’s expansion will include a new building for skate rentals and for holding these private events year round.

Figure 21. A Concert on CPP’s Porter Health Amphitheater. Sale of Naming Rights is an Important Source of Income.
The “Present Events” Function. Today, this is the CPP’s strongest informal entertainment venue function. The attractive amphitheater (see Figure 21) is a critical asset for holding successful events and, through naming rights, an important source of income.
According to Valparaiso Events, CPP is the site of events on 80 days during the year and last year they attracted about 130,000 people. That was a very substantial increase over the 100,000 of the prior year (26).
In 2014, the CPP’s events included: Central Park Plaza Market, outdoor movies, Summer Rhapsody Music Festival, Summer Jam Music and Food Festival, Valparaiso Wine Festival, Valparaiso Popcorn festival, Valparaiso Brew Fest, the Great Downtown Tailgate, Fall Harvest Festival, and Holly Days.
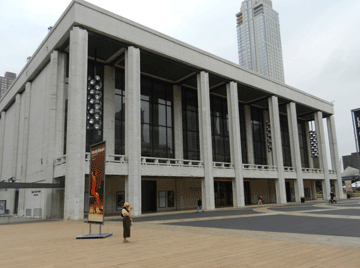
In other years, plays have been performed on the CPP’s stage and I believe one is scheduled for 2015. However, within about a 3-minute walk of the CPP is Valparaiso’s Memorial Opera House. Its website calendar indicates that it has about 40 to 50 performances a year, including musicals, symphonic and chamber orchestras, cabaret type events, etc (27). Though there is some overlap between what the CPP and the Opera House do, they appear to differ in some important ways:
- Most of the Opera House performances occur during the cooler months when the CPP’s event schedule is leaner
- The Opera House’s events lean toward the arts, while the CPP’s focus more on broader entertainment.
As is the case with the vast majority of informal entertainment venues, admission to most of CPP’s events is either free or low cost. However, a few events have a kind of stratified admissions structure with fees reaching into the $30-$60 range (28). These higher admission fees surpass those for the Opera House’s performances, may appear at odds with the solidly middle incomes of local households, and, more generally, are unusual for an informal entertainment venue. This type of fee structure poses some interesting questions about if and when less affordable fees for admission or participation in an event (e.g., higher fees open access to more expensive beers and wines or better seats) are appropriate for a municipal venue.
According to Tina St. Aubin, the executive director of Valparaiso Events:
“Most of what we do is family friendly, and most of what we do is also free to attend. We have a few ticketed events but those funds help keep everything else free. So when someone buys a ticket they are indirectly helping the market, the movies, everything else we do” (29).
Adequate funding for venues such as the CPP is always an important issue and many – e.g., BP and Mitchell Park – have also tried to develop streams of earned income. Without such revenue, the venue’s attractions, drawing power and service to the community would be severely diminished. As St. Aubin argues, the CPP’s higher fees make a number of other events financially feasible.
Nevertheless, the friction between a venue’s need for earned income and the public’s need for affordable admission fees is not one that I think can be settled permanently. Venue managers probably will continually have to grapple with it based on the array of current economic, social and political conditions they face.
Management and Budget. By the 1970s, In NYC and many other cities, parks owned by the municipality had fallen into decline with the local government being unable to manage or fund their proper maintenance and improvement. In response, nonprofits emerged to take over the physical maintenance and programming of the parks based on their abilities to use effective management techniques and to mobilize substantial funds from the private sector. While the municipality retains title to parks and may contribute funds and some services, these nonprofits really run these operations. The Central Park Conservancy and BP are two good examples of this trend in NYC.
Public Private Partnership. In Valparaiso, a kind of hybrid model has been adopted for managing the park in which the public sector has a stronger role. The Valparaiso Department of Parks & Recreation (VDPR) has responsibility for the overall management of CPP, its physical maintenance and renting it out for private events, e.g., weddings, parties, etc. Valparaiso Events, a nonprofit that basically has the mission of marketing the downtown, has been brought in to handle the CPP’s events that are open to the general public. This arrangement is a great example of a public-private partnership, one that inherently acknowledges and capitalizes on the relative strengths and weaknesses of each sector in Valparaiso. It also shows that the strengths of the public and private sectors may vary considerably in different communities, with accompanying important implications for the management organizational model best suited for the local informal entertainment venue.
These Are Significant Organizations. These two organizations provide CPP with the organizational capability that is essential to its success. VDPR manages several parks and two golf courses. It is not negligible in size or annual expenditures and has many business-like operations. It has 28 full-time employees, 185 part-timers and, many, many volunteers (30). Its expenditures in 2013 totaled around $3.6 million. The VDPR knows how to run earned income operations. Earned income is an important part of its revues, with fees bringing in about $1.35 million annually (31). John Seibert, VDPR’s director, reports that fee-based revenues from the CPP cover almost all of his department’s $100,000 annual operational costs for the venue. The naming rights for the CPP’s amphitheater now brings in about $67,500 annually, but Seibert believes that soon could increase substantially. I was surprised by how much income naming rights could raise in a city of Valparaiso’s size. Other communities with downtown informal entertainment venues might want to take a closer look at this revenue source.
Its CPP partner, Valparaiso Events, also is not of negligible size for a downtown organization in a city having a population of 32,000. It has annual expenditures of $663,000, with at least half probably going to support CPP events. During the event busy summer, it has five full-time employees, with two full-time and two part-time during the rest of the year (32). According to St. Aubin: “The city gave Valparaiso Events a $175,000 grant for 2013. Other funding comes from sponsorship, membership and event revenue” (33).
Together, the VDPR and Valparaiso Events annually spend over $460,000 on the CPP. This is a relatively substantial budget. My sense is that both organizations are consequently trying to find new earned income streams and increasing the yields of existing ones. The CPP’s expansion may provide good opportunities to do that with:
- The ice skating and skate rental fees
- Increased rental fees from private events that will able to be held year round; the new facility also will allow more complex and higher revenue producing private events, possibly like a catering venue
- A large shaded space that can be used, instead of tents, for summer public events, and its increased weather protection and fire pits might increase the number of months in which they can be held.
Funding the CPP’s Construction and Expansion. Phase 1 of the CPP cost about $3.256 million (see Figure 22) and it came from four basic sources. Two of them were local and accounted for 52% of the total: about $1.5 million in TIF funds (47%) and around $160,000 in private donations (5%). Federal stimulus funds of about $226,000 accounted for 7% of the total. Major Moves, a State of Indiana program, contributed about $1.347 million, 41% of the total.
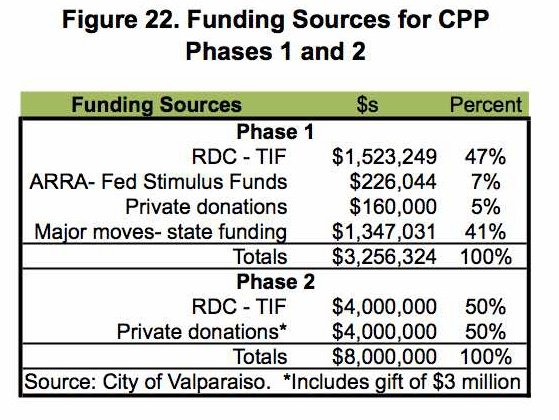
The cost of Phase 2 is more than double that of Phase 1, around $8 million. All of it will be raised from local sources. One family has already donated $3 million and other private donations are expected to raise another $1 million. The remaining $4 million will come from TIF funds.
While few smaller communities might expect similarly large private donations, many are in states where the TIF legislation allows this incentive to be effectively used, even in smaller communities. Indiana type TIF laws in NJ and NY would have made the funding to create Division Street Plaza and especially Mitchell Park much easier and more certain.
The Impacts of Central Park Plaza. When I asked Patrick Lyp, the city’s Economic Development Director, for data related to the impacts of the CPP, he replied that they did not collect them in any formal way because the downtown had seen a lot of projects and it would be hard to isolate which had what kind of impacts and how much of each impact could be attributed to the CPP. For example, all the city officials I spoke to felt that their ability to get more “3-way” liquor licenses enabled the downtown to attract more and stronger eateries and watering holes, which now anchor the downtown’s hospitality niche and they, in turn, also have had a great impact on the downtown’s ability to attract visitors, other firms and new investors. Today, they also have a mutually reinforcing relationship with the CPP. He and the other city officials, however, felt very certain that the CPP’s impact was very positive and very strong. While Lyp did not have statistics on before and after rents, vacancy rates, new jobs or investments, etc., he knew, from what he has personally heard and observed, that the CPP is extremely popular among city residents and in the downtown business community — and the large crowds its events attract are undeniable evidence of this. But how much of the increased interest in investing in downtown projects, or the almost full occupancy of downtown housing can be attributed to the CPP or the new eateries and watering holes or to the new liquor licenses he felt was hard, if not impossible, to determine.
These Valpo city officials correctly put their fingers on the serious “attribution” problem that so often arises in downtown impact analyses. Their position also spotlighted that downtown impact analyses must look at a lot of other variables besides sector jobs and sales that are well beyond the scope of an I-O economic model.
Mitchell Park

Figure 23. Aerial View of Mitchell Park .
Looking at the Three Essential Functions. Mitchell Park (MP) stands out in a number of respects from the two other informal entertainment venues in this analysis. Though located in, by far, the smallest of their three communities, MP has the highest attendance, about 390,000/yr. In part, this is because it alone has the development gold of an active waterfront (see Figure 23) and the strong tourist traffic that can bring. It was the most expensive to create and very probably is the most expensive to operate. However, MP has the strongest earned revenue streams, and they very probably cover most of the park’s annual expenditures.
This array of factors has helped sculpt both the degree and manner in which MP performs the three essential functions of an informal entertainment venues. For example:
- The “engage in activities” function is dominant in MP anchored by an antique carrousel, a marina, a waterfront walk and a wintertime ice rink (see Figure 23)
- The refuge function has a much more obvious presence in MP than in the other two informal venues
- There is no venue management organization, such as the DSA and Valparaiso Events, that runs the events in the park, yet MP is a location for a good number of events.
The “Refuge” Function. Given Greenport’s small population, on summertime visits I expected that. except for event days, I would be likely to find a pretty empty park, save for those few who might be riding the carrousel or going to and from from their boats in the park’s marina. I did not expect to see the numbers of people sitting, resting, relaxing, observing other visitors, looking at the waterfront scenery or the rest of the park. Their numbers certainly did not rival BP’s level of refuge seekers, probably never exceeding 25 or 30 people. Nevertheless, they were enough to make MP look active and attractive. The photos in Figures 23 to 26 were taken over the same Friday afternoon last July in different parts of MP.
Figure 24. Resting and Relaxing UnderTrees by the Carrousel House.

Figure 25. Resting and Relaxing by the Marina

Figure 26. Resting and Relaxing on the shaded benches.
My MP field observations found that, just as in BP, shaded seating areas were greatly appreciated by a lot of people and that some benches were never used because they were never shaded. Many of the visitors were local residents, with a high proportion of them being teenagers. However, a large number of the MP visitors were also tourists. To me, this all suggests that, despite their communities’ low populations and cultural aversion to urban hustle and bustle, outdoor small town informal entertainment venues need to have the infrastructure to perform the refuge function, just as do their larger cousins. This means ample comfortable seating, with a large portion of it shaded.
The “Engage in Activities” Function. This is MP’s strongest function. The antique Carousel is probably its strongest attraction, with 100,000 riders annually that generates $200,000 in revenues from ticket sales. It was built by the Herschell-Spillman Company in 1920 and donated to the village by the Northrop Grumman Corporation in 1995. It is open most of the year, though its hours are reduced during the colder months.

Figure 27. The antique carrousel was built in 1920 and donated to the Village in 1995.
The carrousel is an obvious attraction for tourists during the summer, but it probably still draws from eastern Suffolk County when open during the colder months.
However, the park’s biggest money maker is probably its marina. It has become very popular among boaters. I would not be surprised to learn that the marina’s revenues exceed $500,000/yr.
The park’s main draw during the winter is its ice skating rink (see Figure 28). Having a children’s hockey league and renting it out for parties increases usage at a time of the year when skaters are likely to come from the Village or nearby.
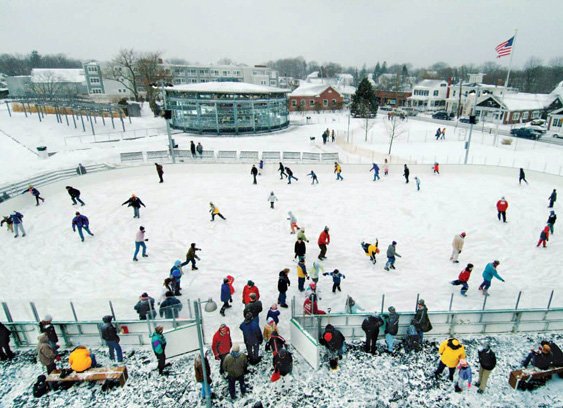
Figure 28. Ice Rink in Front of the Carrousel House.
Another activity generating feature is Harbor Walk. It runs through the entire park and links it to the ferry, train station and Maritime Museum on its western flank and piers and commercial establishment on or near Main Street to its east.
Figure 29 shows part of this walk — and one of the probably unintended uses of this park. On several visits over the years, I have noticed that teenagers have found the park’s varying topography and surfaces make it an irresistible place for riding their bikes.
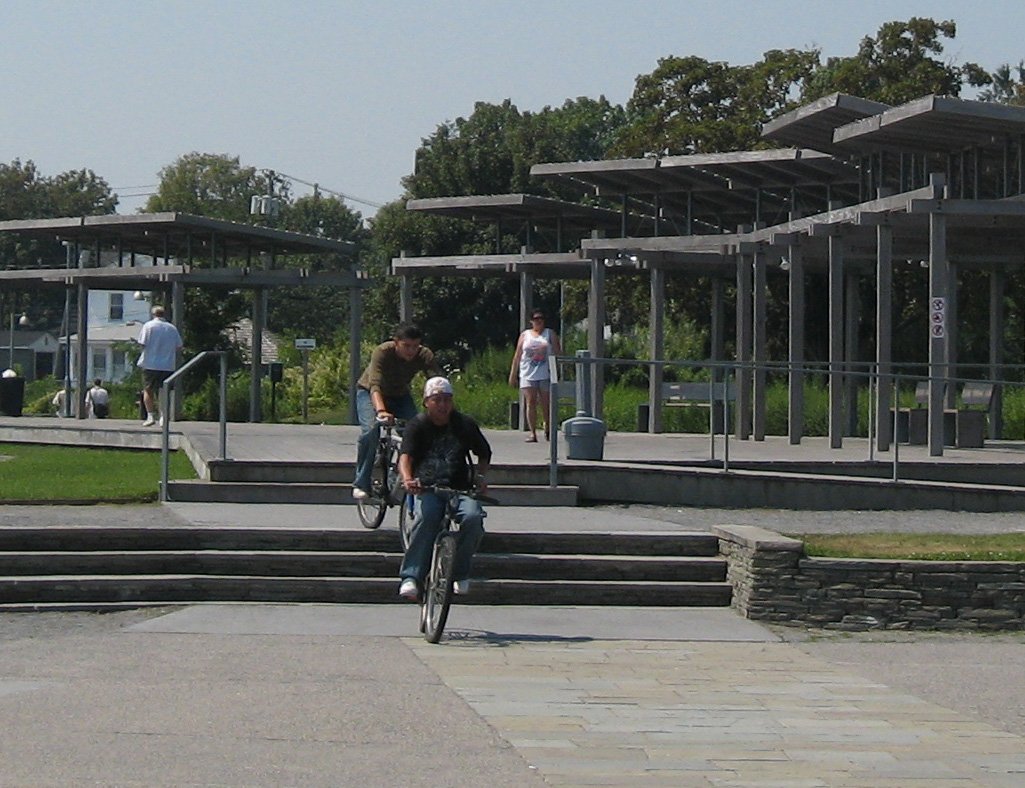
Figure 29. Unintended use?
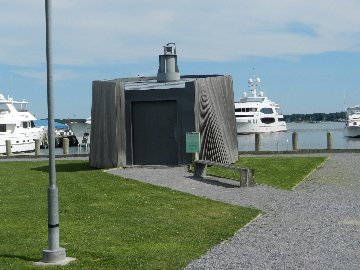
Figure 30. The park’s unique camera obscura
In Victorian England, many estates had “follies,” a term used to describe “extravagant buildings that serve no purpose.” However, in more modern times, follies often have proven to be “curiosities” and something of a tourist attraction. One of MP’s intended activity opportunities, its camera obscura, seems to have turned out to be a folly/curiosity. Housed in a pleasantly mysterious looking, windowless building, this optical device, with a 2,000 year old ancestry, is able to capture something akin to a photographic image of the outside. MP’s is one of the few in the world putatively open to the public. However, in all of my visits to MP, I have never, ever seen anyone going in or coming out of that building. That is probably because It is only open by appointment and if the weather permits. But, the camera obscura does seem to have some strength as a curiosity; I have often heard people ask about that “funny looking building.”
The operating hours of the Maritime Museum and Blacksmith Shop, both located very close to MP, are also rather sparse and probably also explained by the probable low demand and staff costs. Over he years, I have visited a number of other small town museums and other attractions in NY, VT, MA, OH, WI and NC that are similarly hindered.
Greenport’s Farmers Market does not use Mitchell Park. There also are no BP-like commercial activities in the park. Attempts to establish them would probably provoke strong opposition from nearby merchants.
Much like Central Park Plaza and Division Street Plaza, MP does not offer the type of activity opportunities that have relatively low capital costs, such as board games, ping pong, boules, etc. The associated staff cost is probably one strong explanation. Counter intuitively, these three examples suggest that capital costly activity opportunities now are more viable in small town informal entertainment venues than the less expensive ones because they can generate enough revenue to cover staff costs. However, this might be countered by providing facilities that do not require staffing such as adult swings (see Figure 31) or climbable art.
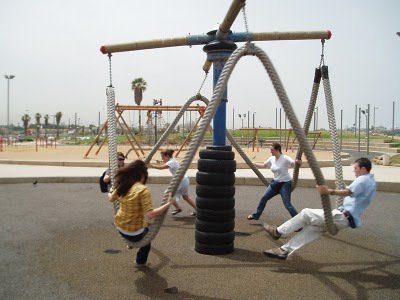
Figure 31. Swings for adults in Tel Aviv
Similar to Valparaiso’s Department of Parks and Recreation, the administration of the Village of Greenport is experienced in managing operations that yield streams of earned revenues. In 2013, the Village’s electric, water, sewer and recreation operations had revenues around $6.14 million; recreation accounted for about 17% of the total (34). Small towns with comparable municipal management experience and capability are probably good candidates for successfully developing and operating streams of earned revenues for their informal entertainment venues.
The “Present Events” Function. Communities of Greenport’s size tend to have relatively few business establishments. Even those that swell in number during the tourist season are inclined to thin in the off- season. Consequently, their local business organizations usually have modest budgets, little or no paid staff and limited capabilities to carry out programs and events.
The local chamber for Greenport, officed in Southold, is the Greenport Southold C of C. It is nested within the larger North Fork C of C – evidence that chamber type functions need to have a larger geographic area from which to draw members, if the organization is to be financially viable. However, there is the Greenport Village Business Improvement District. It has been around at least since the early 1990s (35). For a BID, it has a very modest annual budget of about $45,000, of which about 20% ($9,000) is “allocated for a marketing/social media/public relations program” (36).
With this very limited budget and apparently no paid staff, the BID has adopted the strategy that very savvy BID directors employ when faced with meager resources: they get someone else to do it. On its page on the Village’s website, the BID announces: “Event Funding: Greenport Village Improvement District offers funding for events that benefit the Village” (37). That offer does not mean that the events will be entirely funded by the BID, but the offered dollars could provide the needed incentive for other organizations or individuals to put on events in the Village and probably in MP.
Other organizations do get involved in MP’s events. The North Fork Chamber, for example, held an arts show in MP a few years back. However, the organization that apparently leads the charge on the most important events held in the Village, the Maritime Festival and the Tall Ships, is the East End Seaport & Marine Foundation. It acts in partnership with the Village of Greenport and the BID on these events. The foundation also runs the Maritime Museum and Blacksmith Shop in Greenport.
The Maritime Festival is quite complex. It …”attracts over 40,000 people annually, features nautical arts & crafts, classic wooden boats, activities for children and families, music, pirate shows, local produce and seafood, wines and craft beer, fireworks, and excursions to Bug Light, (the foundation’s) lighthouse” (38).

Figure 32. Dancing in Mitchell Park. Katharine Schroeder Photo
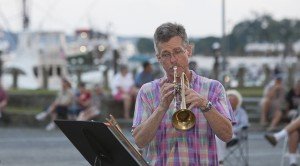
Figure 33. Greenport Band concert in MP

Figure 34. Maritime Festival activities in MP
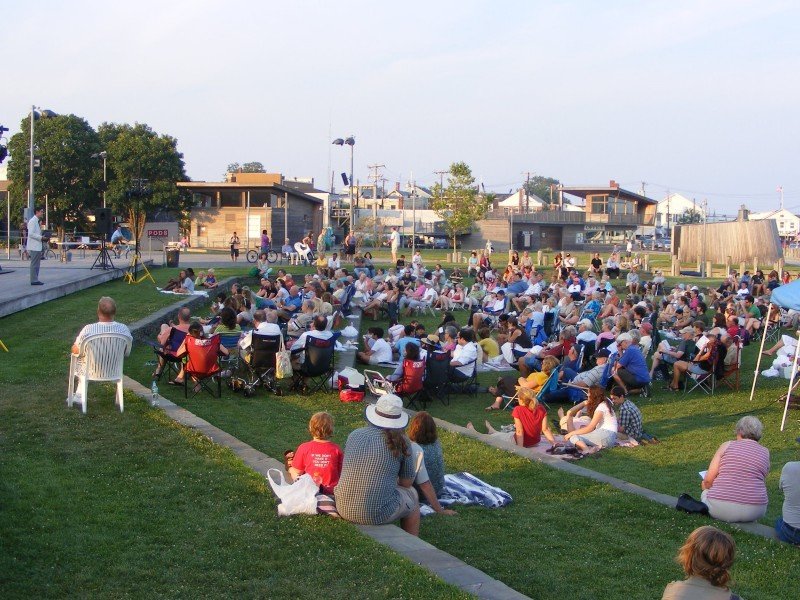
Figure 35. The inverted use of the park’s amphitheater
The Tall Ships events do not occur annually. The last one was in 2012 and the next one will be on the July 4th weekend of 2015. However, they attract the most visitors, an estimated 60,000 for the multi-day event. Greenport apparently has significant recognition among the tall ships. Next July it will be visited by the Hermione, a replica of Marquis de Lafayette’s 18th century frigate. The other ports the Hermione will visit are: Yorktown, Va.; Washington, D.C.; Annapolis, Md.; Baltimore, Md.; Philadelphia, Pa.; New York, N.Y.; Boston, Mass.; and Halifax, Nova Scotia (39). Not bad company for Greenport to be in.
The Maritime Festival and the Tall Ships are events too big to be confined to MP, though it definitely is a location used by them. However, it seems very likely that most of their very large crowds would walk through the park at some time during their visit, given its strategic waterfront location and attractiveness.
The Village’s calendar over the summer indicated that the park was used for two recurring events: public dancing in the park (see figure 32) and concerts by the Greenport Band (see Figure 33). From the information I have been able to gather, MP seems to have less than 30 event days in 2014, but the attendance on some of the days associated with the Maritime Festival and Tall Ships may be in the 5,000 to 10,000 range.
MP has an amphitheater that is basically a very large tiered area with bench-like seating that faces the marina and harbor. It lacks a formal stage, such as the one in Valparaiso’s Central Park Plaza. That has led to situations such as the one pictured in Figure 35. Some events, e.g., dancing in the park, do not use the amphitheater at all.
Management and Budget.
When I asked the village administrator about MP’s budget, he replied that the park was not an entity that the Village’s financial system reported on. I thought this was telling:
- On one hand, from our brief conversation, I am pretty sure that they know how each of the park’s “enterprises” (carrousel, marina, ice rink) are doing on a profit and loss basis
- Yet, there apparently is no one person like a Dan Biederman, a Beth Anne Macdonald or a John Seibert who is managing an organization that is charged with taking overall care of the park
- This was consistent with the decentralized way that events are done
- Perhaps the Village’s governmental structure is so small and the park is so important that overall responsibility and supervision is in the hands of the mayor, the village administrator and the village board
- The park shows little sign of failure or decay. All signs indicate a continued success
- This all can happen in Greenport, because it is so small that interpersonal networks where everybody knows everybody can be meshed with a small group of political and administrative decision-makers who have the needed competencies — or know how to acquire them.
Grants were another source, and they provided most of the money. The Village obtained 25 grants from a wide range of local, state and Federal agencies. One can only imagine the time, energy and money this required. The need for fewer grants might have also significantly cut the time needed to complete the park.
Finally, there was some private funding.The estate of Pauline Mitchell, of the family for which the park is named, provides funds for park maintenance. The Northrop Grumman Corporation donated a full-sized, antique carrousel that has become a critically important park attraction (40).
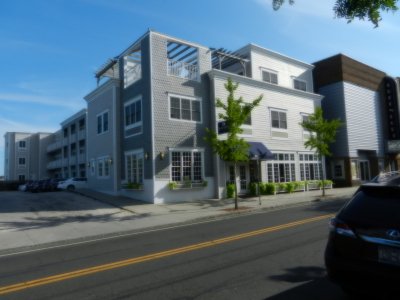
Figure 36. Next to MP is the 35 – room Harborfront Inn that opened in 2004, induced by the park’s creation
Mitchell Park’s Impacts.
Induced by the creation of MP, a new 35-room motel, the Harborfront ( see Figure 36), was built before the final Phase 3 work on the park was completed in 2007. Together, they improved the waterfront and filled some very unattractive holes in a long blockface on the important Front Street downtown entryway that also has the post office and the town’s movie theater. The improved appearance certainly made this part of downtown Greenport a more desirable business location. My observations, which friends living in the Village support, are that the quality of the nearby retail shops and eateries have improved since work on MP was completed. MP’s attractions — e.g., the carrousel and ice rink — also have drawn visitors from well beyond the Village’s borders in eastern Suffolk County. However, I cannot provide statistical information to support these observations.
The limits of MP’s possible impacts are demonstrated by this essential fact: many of Greenport’s merchants still close during the colder months because there is not enough customer traffic for them to stay open.
Over the past 15 to 20 years, the North Fork of Long island has become increasingly popular as a place to visit and own second homes. This, too, has had an impact on business and real estate conditions in downtown Greenport. As a consequence, any analysis of MP’s impacts will have a significant attribution problem: how much of an impact can be attributed to the park, how much to regional economic growth?
ENDNOTES
1- See Pt 1: https://www.ndavidmilder.com/2014/08/bryant-park-the-quintessential-downtown-informal-entertainment-venue-part-1.html
2- Tim Halbur, George Haugh, Ethan Kent, Sarah Goodyear, “The Top 100 Public Spaces in the U.S. and Canada,” Planetizen, October 27, 2011, http://www.planetizen.com/toppublicspaces
3- I want to thank John Seibert, Director of the Dept of Parks and Recreation; Patrick Lyp, Economic Development Director; Bill Oeding, City Administrator and Tina St. Aubin, Executive Director of Valparaiso Events for their assistance and cooperation.
4- Census Bureau, OnTheMap
5- From Chambers website: http://www.valpochamber.org/community/index.php
6- Pam Antonetti, “Groundbreaking Held for Central Park Plaza Expansion,” Valpolife,com, Spet 29, 2014, http://www.valpolife.com/community/parks/46238-groundbreaking-held-for-central-park-plaza-expansion
7- Personal and phone conversations with Valparaiso officials.
8- Census Bureau’s OnTheMap
9- David Kapell, “Creating The ‘There’ In Greenport,” Build A Better Burb at http://buildabetterburb.org/creating-the-there-in-greenport/
10- Telephone interview with David Kapell.
11- See endnote #9.
12- N. David Milder, “So…Surprise! You have a lot of suburban creatives…” The Downtown Curmudgeon, July 3, 2013, https://www.ndavidmilder.com/2013/07/so-surprise-you-have-a-lot-of-suburban-creatives.html
13- Email from Beth Anne Macdonald
14- Ibid.
15- See: Cole E. Judge, “The Experiment of American Pedestrian Malls:Trends Analysis, Necessary Indicators for Success and Recommendations for Fresno’s Fulton Mall,” Downtown Fresno Partnership, November 11, 2013.
16- Ibid
17- See Bryant Park Pt 1 referenced above in endnote #1.
18- Cited in Lawrence Houstoun, “Watching All the Crowds Go By” http://lhoustoun.wordpress.com/public-spaces/chapter-2-watching-the-crowds-go-by/
19- See: Winnie Hu, “Mom, Dad, This Playground’s for You,” New York Times, June 29, 2012. http://www.nytimes.com/2012/07/01/nyregion/new-york-introduces-its-first-adult-playground.html?pagewanted=all&module=Search&mabReward=relbias%3Ar%2C%7B%221%22%3A%22RI%3A7%22%7D
20- Email from Beth Anne Macdonald. I also want to thank Beth Anne for all the information she provided as she patiently responded to my questions.
21- See: N. David Milder, The New Normal’s Challenges to Developing a Downtown Entertainment Niche Based on Formal Entertainments: Part 2 the audiences ,The Downtown Curmudgeon, https://www.ndavidmilder.com/2014/03/the-new-normals-challenges-to-developing-a-downtown-entertainment-niche-based-on-formal-entertainments-part-2-the-audiences.html
22- Email fromBeth Anne Macdonald.
23- DSA’s 2013 Community Survey, n=600.
24- Heather Augustyn, “History of Valparaiso Events – Past, Present and Future,” nwitimes.com, September 04, 2014. http://www.nwitimes.com/news/local/porter/valparaiso/history-of-valparaiso-events-past-present-and-future/article_34213756-41a7-5544-8e49-eeba164a0be6.html
25 – http://www.valparaisoevents.com/central%20park%20plaza%20market/
26 – Telephone conversation with John Seibert
27 – See: http://www.memorialoperahouse.com/events
28 – See for example: http://valpobrewfest.com/main.html . Note the mention of VIPs.
29 – See endnote #24
30 – Valpo Parks 2013 Annual Report
31 – ibid.
32 – Se endnote #24
33 – Email from Tina St Aubin.
34- Incorporated Village Of Greenport, New York Financial Report, May 31, 2013, p. 17, http://villageofgreenport.org/annual-financials/Final%20Fin%20Stmt%20Greenport%202013.pdf
35 – See: http://www.greenportvillage.com/business-improvement-district/ .
36 – Jen Nuzzo, “New Greenport BID board members elected,” The Suffolk Times, 11/25/2012,http://suffolktimes.timesreview.com/tag/greenport-bid/
37 – See endnote #35
38 – See: http://www.greenportvillage.com/maritime-festival/
39 – Jen Nuzzo, Replica of Lafayette’s ship Hermione visiting Greenport at Tall Ships, The Suffolk Times, 11/14/2014 http://suffolktimes.timesreview.com/2014/11/53887/lafayettes-ship-hermione-visiting-greenport-at-tall-ships/
40 – Funding information from 2006 telephone conversation with Mayor Kapell
© Unauthorized use is prohibited. Excerpts may be used, but only if expressed permission has been obtained from DANTH, Inc.