N. David Milder at DANTH, Inc.

Downtown Revitalization Specialist

Main menu

Skip to content
  • Home
  • About NDM
  • News
  • Downtown Curmudgeon
  • Reports
    • Long Island City (pdf)
    • Manhattan
    • Meredith (pdf)
    • Morristown (pdf)
    • Peoria (pdf)
    • Sherwood, WI (pdf)
  • Downtown Revitalization
  • Contact

Category Archives: Entertainment niche

Post navigation

← Older posts
Newer posts →

Let’s Get Real About*: The Arts As An Important Downtown Revitalization Tool — Redux. Part 1

Posted on June 18, 2017 by DANTH

By N. David Milder


“Aeschylus and Plato are remembered today long after the triumphs of Imperial Athens are gone. Dante outlived the ambitions of thirteenth century Florence. Goethe stands serenely above the politics of Germany, and I am certain that after the dust of centuries has passed over cities, we too will be remembered not for victories or defeats in battle or in politics, but for our contribution to the human spirit.”

–John F. Kennedy


Back in 2014 and 2015, I wrote a number of articles related to the development of downtown arts and entertainment niches (1). Their thrust was that while developing and operating formal enclosed venues for arts and entertainment uses can strengthen downtown revitalization efforts, they also are often fraught with organizational complexities, financial difficulties and negative trend headwinds that are overlooked by ardent supporters of arts projects. The result is too many underperforming or even failing formal arts venues. Moreover, many of the purported benefits of these arts venues might be more reliably and cheaply provided by well-activated public spaces, parks and third places.

I recently attended a very good conference that was aimed at mainly small and medium-sized communities located in rural and suburban areas. However, I came away very worried by the strong and incautious advocacy of the arts as a small town revitalization engine I encountered there. These arts advocates, some new to the faith, did little to indicate the wide range of challenges such a strategic approach is likely to encounter. Nor did their audience seem to have any awareness of such challenges. Many of them seemed to be eagerly looking for something to take the place of the weakening retail in their downtowns, and the arts appeared to be a very appealing solution. Alas, arts projects may be highly desirable, but it is foolish to assume they are quick or easy to do.

Part of the problem had to do with how most of our conferences use success stories for their content spines. It seems that in contrast to Silicon Valley, we in the downtown revitalization field only learn from our successes, not our failures. However, it also may be due to the fact that not many downtown leaders and experts are providing the needed information. This has prompted me to update my research and write this article. Let me be clear: its objective certainly is not to rail against the arts as an economic asset. It is, instead, to help downtown leaders and stakeholders better calibrate their arts development efforts, so that more of them will succeed, because they properly mesh with local resources and opportunities.

One reason that great care needs to be taken when using the arts as a key element in a downtown revitalization strategy or program is the hybrid earned/contributed incomes business model that nonprofit arts organizations use. It is more complex and consequently requires a wider set of management and leadership skills than the simpler for profit model used, for example, by the organizations that own and operate our movie theaters or put on our touring Broadway shows. The hybrid arts organizations are both charities with a built-in need for substantial contributions from individuals, businesses, foundations and/or government agencies as well as businesses that sell arts products (including performances and exhibitions) to earn incomes. Unfortunately, as events in recent years have demonstrated, these contributions are very dependent on economic and political conditions and can be very erratic. This model has a high level of financial failure as measured by having budget deficits. The use of the hybrid business model is a de facto admission that these arts organizations cannot cut it financially on just their earned incomes. Some may argue that the hybrid model benefits from greater diversification than the for-profit model, but that may mean, with tight budgets and unreliable donors, more ways to fail than to be safe.

On the earned income side, things these days have not been easy either. For over a decade, all types of arts organizations, be they nonprofit or for profit, have been facing a disconcertingly changing pattern in the way Americans participate in the arts. More arts participation is being done electronically. Some of the performing arts – e.g., opera, ballet, movies, symphony orchestras, jazz – have reported significantly reduced attendance, while others, such as Broadway shows and nonprofit theaters, have experienced serious and sometimes financially stressful fluctuations in attendance. “High culture” performances were losing popular support, while “low culture” entertainment performances (salsa music, comedians, rock bands, rap groups) were gaining popularity. As a consequence, many renovated theaters and new PACs have had hard financial times because they couldn’t find the right programming for their market area. They also had not done their homework.

While I acknowledge that arts venues can strengthen a downtown’s central social district functions and that credible research has demonstrated that they can have positive economic impacts, the impacts on their downtowns may not be as glorious as purported in project proposals – or conference presentations. My research has shown that too often the potential positive impacts of arts projects on downtowns are grossly misunderstood, and their actual magnitudes often go unmeasured, though wrongly assumed to be large. On the other hand, their negative impacts are far too often conveniently overlooked, even if easily noticed and measured.

The demographics of a downtown’s market area have an enormous influence on how many visitors and the amount of the financial contributions downtown arts venues can attract. Arts advocates too often put the cart before the horse, focusing on purported positive impacts, while not looking closely enough at the demographics that influence an arts project’s or an arts organization’s viability.

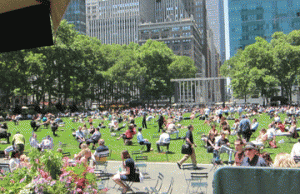
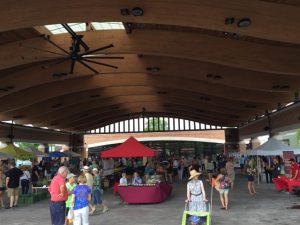
Another hard truth is that many small and medium-sized communities probably will have stronger positive impacts on their downtowns and a consequent higher ROI by investing in strongly activated parks and public spaces as well as in the micro businesses of local artists and artisans, than in building and operating covered venues for the performing arts and museums.

The Lack of Proper Calibration of Aspirations to Available Resources and Opportunities

Through my travels, arts consumption and professional activities, I have encountered many arts organizations that are in such a precarious financial situation. Some are huge with budgets over $100 million, such as the Metropolitan Museum of Art in NYC. Others are large and well-known entities in our big cities such as the numerous symphony orchestras that recently have been downsized and/or re-organized. There are also the PACs that have struggled in suburban communities such as Englewood, NJ, South Orange, NJ, and White Plains, NY. Many small downtowns have museums with very limited operating hours or theaters and cinemas on the verge of failure. In dense, modest-income urban areas, large amounts of community energy and scarce funds have been used to develop attractive arts venues, such as the Jamaica Performing Arts Center in Queens, NY, that are largely underutilized and need deep subsidies to survive. Stories of local governments having to step in to save the day are easy to find: e.g., the city to save a museum in Gering, NE; the county to save a PAC in Englewood, NJ. I could add many more examples to this list, but won’t for the sake of brevity.

My takeaways from all of these examples were:

  • All suffered from the same underlying problem: their aspirations were not properly calibrated to the resources and opportunities available to them. Their eyes proved bigger than their stomachs or wallets.
  • Careful calibration is required to a large degree because of the shaky nature of the business model used by most arts organizations (and other nonprofits) and a changing environment that has made both earned and contributed incomes significantly less reliable.

 The Hybrid Business Model Used by Arts Organizations Has Major Inherent Problems

A Structural Propensity to Have Deficit Annual Budgets. Roland J. Kushner and Randy Cohen in their National Arts Index 2016 paint a picture of arts organizations that should be carefully considered by any downtown leaders who are thinking about making the arts or an arts project a central component of their revitalization efforts. A very large number of arts organizations do not have break-even budgets and consequently, raise concerns about their long-term sustainability. According to Kushner and Cohen:

“Arts nonprofits continued to experience financial challenges: The percentage of arts organizations operating at a deficit has ranged from 36 percent in 2007 (during a strong economy) to 45 percent in 2009 (the deepest part of the recession). In 2013, a time of improved economic health, 42 percent of arts nonprofits still failed to generate positive net income—a figure that raises concerns about the long-term sustainability of arts organizations that are unable to achieve a break-even budget. Larger-budget organizations were more likely to run a deficit, though no specific arts discipline is particularly more likely to run a deficit…. (I)t is clear that the budget fortunes of nonprofit arts organizations got worse during the Great Recession and have been very slow to recover.” (2)

Consequently, it would seem very reasonable and very prudent for downtown leaders to be extremely cautious about using an economic sector populated by organizations with a very high propensity for financial instability as an engine of downtown revitalization.

The Proven Long-Term Uncertainty of Their Revenue Streams. The hybrid model is based on revenues coming from many very different sources and obtained through different means. According to Americans for the Arts: “Support for the nonprofit arts is a mosaic of funding sources – a delicate 60-30-10 balance of earned revenue, private sector contributions and government support.” (3) Here’s a more precise breakdown by AftA:

  • 60 % Earned Income
  • 31% Private Sector Contributions
    • 24% Individuals
    • 4% Foundations
    • 3% Corporations
  • 9% Government support
    • 4% Local Government
    • 2% State Government
    • 3% Federal Government

Other research has found a slightly different funding mix. The National Endowment for the Arts (NEA), using data from the Urban Institute and Census Bureau for 2006-2010, found that the revenue sources for nonprofit performing arts groups and museums were:

  • 55.1% Earned Income, Interest And Endowment Income
  • 38.2% Contributions From Individuals, Foundations & Corporations
    • 20.3% Individuals
    • 9.5% Foundations
    • 8.4% Corporations
  • 6.7% government grants
    • 3.3% local government
    • 2.2% state government
    • 1.2% federal government (4)

Earlier, pre-Great Recession estimates showed that earned incomes accounted for about 50% of the revenues of nonprofit arts organizations.

Perhaps it is best to amend AftA’s statement to read that arts organization funding has been a delicate balance of 50% to 60% earned income, 30% to 40% private sector contributions and 10% or less from government support.

In any case, there is general agreement on the types of funding sources and the fact that there are many of them. In a 2012 study of the factors that challenge the financial sustainability of nonprofit organizations, the RAND Corporation’s authors placed at the top of their list:

“Risk of reliance on external funding sources and streams. In contrast to for-profit organizations, nonprofits in the United States depend on diverse sets of funding sources and streams of funding to sustain their operations. Most nonprofits receive funds from multiple sources (e.g., government, foundations, private donors) and streams (e.g., grants, contracts, membership fees). Substantial cutbacks in both government and foundational funds suggest that nonprofits should develop or revisit their fundraising plans to support financial sustainability.” (5)

At the level of the individual organizations, there can be additional variation. For example, The Goodspeed Theater in East Haddam, CT, gets about 26% of its revenues from contributions and about 57% earned income, while the Weston Playhouse Theater, in Weston, VT, gets 63.4% of its revenues from contributions and about 29% from earned income (6).

 Both theater managements will differ from for-profit arts organizations in their need of staff and board members who are adept at marketing to individuals and organizations that are potential financial donors. The skills involved are quite different from marketing tickets to a movie, Broadway play or ice show to the public. Even the skills needed for obtaining grants from government agencies can be quite distinct from those required to network with and cultivate very wealthy donors.

Does the Weston Playhouse’s greater reliance on contributed income over earned incomes make it structurally more financially vulnerable than the Goodspeed that relies more on its earned income? It seems very likely to me.

Demographics Really Count

Annual Contributions to the Arts by Household Income (table from a report done for Google)

Re: Contributed Incomes. After earned incomes, contributions by individuals are the most important source of revenues for arts organizations nationally. Research has shown that contributions to the arts correlate with household incomes. The table above was generated in a 2007 report for Google that was done by the Center for Philanthropic Giving at Indiana University. It shows that 93.4% of all charitable giving to arts organizations is from households with annual incomes over $200,000. Among the vast number of households with incomes beneath $100,000, just 6.2% contributed to the arts, and they accounted for just 4.4% of all contributions to the arts by individuals.

While I strongly suspect that this report might have met with criticisms, I think it is possible to more generally restate its findings to the more certainly defensible conclusions that:

  • Most of the dollars contributed by individuals to the arts come from rather affluent households
  • Financial contributions to the arts increase with household incomes, and the increases get larger as the incomes get bigger.

Poor and small- and medium-sized communities will likely have below average percentages of very affluent households who are either year-round residents or second home owners. The ability of their arts organizations to have 30% to 40% of their revenues come from private sector contributions is consequently strongly impeded. Moreover, they consequently are relatively more dependent on winning contributions through grants from foundations, businesses and, especially, government agencies.

Re: Earned Incomes. The potential consumer dollars that arts organizations can tap is calculated by the number of people in their market area and their annual expenditures for arts performances, exhibitions, and products. Small- and medium-sized communities probably will have the obvious inherent problem of a market area that is not densely populated. An additional potential problem is, again, their probable comparatively low household incomes.

As can be seen in the above table, nationally, households with incomes over $103,057 account for 54.8% of all expenditures for entertainment fees and admissions, which includes admissions to arts and cultural venues such as theaters, cinemas, PACs, concert halls, etc. Adding the households with incomes over $62,587 shows that the most affluent 40% of our households account for 75% of the expenditures for entertainment fees and admissions. Arts venues in market areas lacking substantial numbers of such households, especially those in the top income quintile, will be hard pressed to have substantial revenues from their paid admissions. Small- and medium-sized communities are likely to have such market areas with relatively few affluent households. They are likely to be absent in poor communities.

Endowment and Interest Incomes. The NEA’s study found that 14% of the annual revenues of performing arts groups and museums come from these two sources. Such arts venues in poor or small- and medium-sized towns, with relatively small budgets and in perennial hand-to-mouth financial situations are not likely to have much interest income and are even less likely to have any endowments.

The Ups and Downs of Business, Foundation and Government Funding for the Arts Matters.  Arts organizations are very sensitive to even slight variations in their philanthropic funding levels. As Randy Cohen at Americans for the Arts wrote in 2015: “We pay close attention to philanthropy because even small fluctuations in contributed revenue can be the difference between an arts organization broadening its reach or facing a deficit.” (7)

Moreover, charitable giving for the arts has a history of significant fluctuations. Here, again, is an astute observation from Cohen: “The arts compete well for charitable dollars in good times, but tend to struggle in a down economy as many funders move their giving to what they perceive are more pressing human service needs.” (8)

The above table shows how total contributions to arts nonprofits varied annually from 2008 to 2016 (9). In two years there were decreases, but even when there were increases, the amounts could vary from just 1.6% to a more robust 15%.

Funding From Foundations.   After individuals, foundations are the next most important source of contributions to arts organizations. The National Arts Index for 2016 found that:

“Along with the number of grants, foundation dollar amounts increased from 2001 through 2012 only modestly, by six percent to $2.2 billion, when measured in current dollars; this leads to a decrease of about 18 percent when adjusted for inflation.” (10)

 Major Corporate Giving.  Data from the Conference Board indicate that contributions from large corporations declined by about 51% from $418 million in constant dollars in 2006 to about $215 million in 2010. However, it has rebounded somewhat lately, about 27% between 2013 and 2015 (11). Smaller firms, of course also contribute to the arts, but at lower levels in terms of numbers and amounts (12).

Government Funding. At this point in time, June 2017, the future of the NEA is again very much in doubt. However, as some conservative political observers have been quick to note. It accounts for only a relatively small percentage, about 1.2%, of the funding of our arts organizations.

State and local government arts funding responded to the Great Recession by dipping significantly between 2008 and 2012, but they have followed a positive, if uneven, trajectory since then.

However, looking at a longer time frame shows a different picture. As Ryan Stubbs, another astute observer of the arts funding scene, has noted about the 1994-2014 period:

“Although the nominal increase over the past twenty-one years is positive, the landscape for public funding for the arts in this time period is much bleaker when accounting for inflation. In fact, after adjusting for inflation, public funding for the arts has decreased by more than 30 percent in this same period.” (13)

 Concerns about government funding are arguably diminished because they account for fewer than 10% of all arts organizations’ funding. However, my observations suggest that, in many small- and medium-sized communities, when a significant local art organization is on the brink of financial collapse, it is a municipal or county government that steps in to save the day. Such interventions can have critical impacts on the arts organization and the whole community it serves. I wonder what would happen if local governments really did stop making such bailouts?

One thing seems certain: any arts organization that predicates its future financial well-being on continually receiving government grants has placed itself in a very risky situation.

 Budget Size Matters.

Most arts organizations are small, with revenues under $25,000. In 2012, about 63% of the nation’s estimated 110,000 arts organizations had revenues below $25,000. (14). A study done in 2017 estimates that there were 39,292 nonprofit arts and cultural organizations in the USA that had revenues over $50,000 (15). This means most art nonprofits will have little or no staff and will very likely either have very few performances or very few hours when they are open to the public. If they rent street level storefronts, when closed, they function as dead spaces that detract from their block faces walkability, while also signaling a lack of vibrancy.

Even when budgets get somewhat higher, the impacts are not likely to be significantly large. For example, the Wyoming Territorial Prison, a museum in Laramie, WY, (population 32,000) reported revues of $90,290 on its IRS Form 990 in 2015, but its annual visitation is about 16,000 (averaging about 2,700 per month) during a season that lasts from May 1st through October 31st. To put that attendance in perspective, consider that the Laramie Main Street Alliance holds seven one-day events that attract a total of around 8,250 people (16).

Small arts venues can have some meaningful benefits for their communities, though their economic impacts in terms of bringing in more dollars to the downtown district are relatively small. Some may be vanity expressions of a local resident, while others may have significant community impacts by celebrating a local scenic feature, historic local event or a famous local resident that is important to the community’s pride and cohesion. They also can fill vacant downtown spaces and add variety to the district’s store mix. However, their economic impacts still are likely to be negligible. Their budgets are too low and their customer magnetism just too weak for them to have significant direct and indirect economic impacts. Moreover, the small number of merchants in these downtowns also means that there are fewer that can be impacted positively by the arts activities.

It hard to say what the budget threshold is that has to be exceeded for arts organizations to have significant economic impacts. However, bigger budgets certainly increase the potential for having stronger and better arts “products” – e.g., performances, exhibitions, items created by artisans, etc. — and they can have more significant economic impacts.

The Quality of the Arts “Product” and Its “Packaging” Really Matter.

A Strong Cautionary Note: Do Not Allow Attention to Arts Buildings Dwarf Proper Attention to the Programs and Events That Will Occur Within Them. Since the early 1980s, I have come across several projects to either build or restore an existing theater or PAC. All of the completed buildings were physically attractive. However, a good number struggled financially after they opened because they were not attracting the audiences their advocates had said would appear. While enormous efforts were made to properly design and fund the building or renovation project, too often insufficient attention was paid to what would happen once the venue opened to the public. Their creators had not properly thought through what their product was, which market segments they would be sold to, how they would be marketed or how much money and personnel would be needed to do all of this. Sometimes those managing the new venues had little or nor prior appropriate professional experience.

Many of these projects were sold as bastions of the Arts, with a capital A, carrying the implication that they would be venues for performances of classy “highbrow” arts such as operas, ballets, and symphonic music. They soon found out, the hard way, that it was popular entertainment acts that paid the bills, not high culture arts performances. Furthermore, expectations about the types of acts that could be attracted were doused when board members and novice managers learned that their facility was too small to generate the revenues needed to pay the entertainers they wanted on their stages. Yes, they could have the occasional concert pianist, chamber music ensemble, dance group, touring Broadway play or even plays performed by local drama groups, but it has been the performances by pop singers, salsa bands, rap groups, rock bands, screened broadcasts of NFL games, classic films and comedians that paid the bills.

The folks at the Paramount Theater in Rutland, VT, have been wonderfully frank about their initial problems after a major renovation that enabled the theater to reopen after decades of darkness. That frankness is probably enabled because, after a few years of struggling and an important management change, the theater finally got on track by finding the right programming and pricing. Learning about the local market was critical. Eric Mallette, the programming director of the Paramount, says: “that he pays a lot of attention to what the local market responds to and tries to book shows and adjust ticket costs to fit those trends.” For many years that meant popular music and family entertainment, including the booking of a lot of comedians. According to Bruce Bouchard, who runs the Paramount Theater: “We started booking comedians and it just took off.”

What a Strong Arts Product Can Do for Arts Venues in Smaller Towns. The importance and power of the products that arts venues offer is perhaps best demonstrated by some venues I have visited that have substantial budgets, strong regional or national reputations and draw a significant number of patrons from relatively large market areas — even though they are located in small and medium sized towns. Below are four examples.

The Norman Rockwell Museum. Stockbridge, MA, is a very small town, with a population around 1,700 people. It has a wonderful old building stock, including a famous old hotel and inn. Located on Route 7, it has long been a significant tourist destination in the Berkshire Mountains. The famed artist/illustrator Norman Rockwell lived there. Local residents were models in many of his paintings. The Norman Rockwell Museum in Stockbridge is the primary repository for the artist’s paintings.

For decades his paintings were the covers of well-known national magazines. Most of his work presented an idealized version of small town, Main Street America and was very patriotic. The museum, from its inception, had name recognition and was able to build upon Rockwell’s national fame and popularity.

It has a substantial annual budget of about $4.3 million, though that is well below the average of about $8 million for art museums nationally that have annual incomes above $50,000. About 28% of its revenue comes from contributions and 52% from program services. The museum attracts around 125,000 visitors a year – about average nationally for an art museum — mostly from NY and New England, as well as another 200,000 to its traveling exhibitions. It is professionally operated with 27 full time employees, 38 part-timers, and 30 volunteers.

This museum has gravitas: lots of a high-quality arts products (i.e., many Rockwell paintings) that are packaged in a charming town in the attractive Berkshires. The area attracts many well to do second home owners and even day-trippers from the heavily populated Northeast Corridor. Its budget and visitor appeal infuse this museum with the potential to have meaningful economic impacts even though it is located in a small community. How much of those benefits go to Stockbridge and its charming Main Street and how much goes elsewhere in its region is another issue.

Brandywine River Museum of Art. It is located in Chadds Ford, PA, population 3,640. The township is about 40 miles from Philadelphia in a scenic river valley, where the DuPont family has had a big influence. The township’s population is affluent, with the median household income being $117,961 and the mean $165,971.

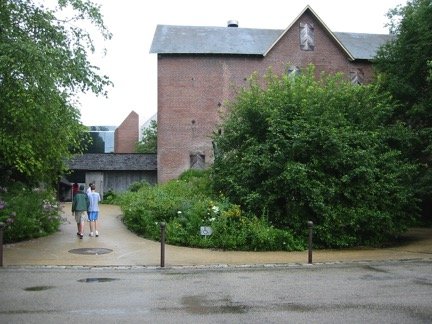
Brandywine River Museum in Chadds Ford, PA

Its core attractions are Andrew Wyeth’s studio and a very large collection of his paintings. Wyeth is also one of America’s best-known artists. His painting, Christina’s World, achieved almost iconic status nationally. The museum attracts 200,000 visitors annually, double that of the average art museum. Wyeth’s fame and popularity are enormous marketing assets for the museum. Its annual revenues are relatively very substantial, around $24.6 million. That’s about three times the average art museum in the USA. It has 164 employees. Its total assets are valued at a relatively hefty $156.7 million. The museum’s operational strategy is unique since most of its annual revenues come from asset sales — probably the sales of Wyeth lithographs and paintings for which there is still a big demand.

One gets the impression that the management of this museum is trying to run it as a business as much as is possible. Its revenues, employment, and visitation indicate that it has considerable potential to exert positive economic impacts, within its county, though where and who within it would benefit are other issues.

Goodspeed Musicals. This organization is famed nationally for developing musicals, with many of its productions going on to stages in New York City and London, e.g., Annie. It owns and operates an impressive cluster of artistic facilities located in East Haddam, CT, population 9,126. The town has a median household income of $82,117 and a mean of $103,376. The town is on the scenic Connecticut River and has many historic buildings. The Goodspeed Musical’s facilities include:

  • The Goodspeed Opera House
  • The Terris Theatre
  • Artists Village
  • The Chauncey Stillman Production Facility
  • Larry A. McMillian Rehearsal Studios
  • The Alice Rehearsal Studios Barrington Costume Center
  • The Factory Building (17).

At the functional core of this cluster is the historic Goodspeed. Built in 1876, after a long period of decline, it was restored and reopened in 1963. Attendance at the Goodspeed for 2014 was about average for an American nonprofit theater company: 105,368 patrons at 297 performances. About 26% of its revenues are from contributions, about 57% program services. Its total revenues in 2014 were an above average $13,159,845, while expenses were relatively robust at $11,708,637.

The Artists Village is an interesting and relatively recent addition. It is within walking distance of the Goodspeed Opera House and includes 17 new and five older homes. All have three or six bedrooms, with shared kitchens and living rooms. The new houses were designed specifically with artists in mind: “every bedroom has a private bathroom, extra insulation was added between walls to ensure quiet rooms, and large common areas were provided to encourage camaraderie and a sense of community” (18). The project cost for the Artists Village was $5.5 million, with $2.5 million provided by a grant from the Connecticut Department of Economic and Community Development, and the rest from private donors.

Weston Playhouse Theater. The Playhouse is located in a very attractive building in Weston, VT, population 566, one of the most charming villages in the state. A running stream and the town green abut the theater. Route 100, one of the state’s most scenic highways, runs through the town. Also located in the town is the very popular Vermont Country Store that literally draws busloads of tourists. Weston’s median household income is $62,500, the mean is $100,796. The area surrounding Weston attracts lots of second homeowners because of its famed scenery and nearby ski resorts, such as Okemo. The Town of Ludlow, population around 1,900, is about a 15-minute drive from Weston and close to Okemo. It has had a notable downtown revitalization in recent years, driven by an attractive cluster of restaurants and bars.

The Weston Playhouse Theater

The Playhouse is Vermont’s longest running professional theater, though it only operates for about 10 weeks during the summer months. While it does the classics, it also prides itself on nurturing new plays. Its total revenues in 2014 were an above average $2.45 million. An astonishing 63.4% came from contributions, only about 29% from ticket sales. Its annual expenditures in 2014 were $1,835,630. Its annual attendance, based on just a summer stock type operating season, is above average at about 20,000. However, its operating expenditure per visitor is quite high, $91.78, and most of it cannot be covered by ticket sales. This has placed it in potential financial jeopardy.

The Playhouse has a bar and restaurant inside, probably because there are so few other eating and drinking places in this very small town or even further out in this very rural area.

I have been following the Playhouse and visiting Weston since the early 1990s. To my ken, during that time, it has had two significant bouts with financial stress. The most recent occurred a few years ago and was probably due to the impacts of the Great Recession on donors combined with the Playhouse’s strong dependency on contributed income.

The people in the Playhouse company appear to live and work most of the year in big cities in the northeast, where they are theater professionals and/or academics. Perhaps they also have second homes in or near Weston. In many respects, what they have done reminds me of the Judy Garland and Mickey Rooney films where someone says: “ let’s put on a show” and they do. The folks that run the Playhouse company want to put on their kind of plays in Weston, a town they obviously like, during the summer, when they are more likely to have available time. They largely have been willing and able to do the hard work of attracting a substantial amount of contributions. I suspect that a lot, if not most, of those contributions, come from outside Weston’s region. If the picture I just painted is correct, then the very small town of Weston has a well-known theater because it has been able to attract a group of outside theater professionals who then have been able to attract a good deal of outside money. To my mind, that’s like Weston filling an inside straight. It’s a wonderful story, but a model that is very hard to emulate.

The Playhouse probably does not have much potential to have favorable impacts on other Weston businesses, because there just are not that many of them and it is only open for about 10 weeks a year. On the other hand, the Vermont General Store is so strong that anything the Playhouse could add to it probably would be like chump change. The most likely potentially positive economic impacts are probably felt at a county or regional level – in Ludlow, for example — and probably more on residential property values than business revenues.

Some Hypotheses About the Characteristics of Arts Venues in Small- and Medium-Sized Towns That Are More Likely to Be Successful and Have a Strongly Appealing Arts Product. Based on my research and field visits, I have generated the following hypotheses:

  • Their arts product, while reflecting strong local roots, also appeals to many people outside the local area. They attract tourists.
  • Their arts product is packaged in an attractive building that is located in a very attractive town that often is in a very attractive region.
  • These successful venues usually do not create the tourist traffic but take advantage of, and then help grow existing traffic.
  • Their towns have significant numbers of solidly middle income and/or affluent households, their percentages often greatest in the towns with the smaller populations.
  • The arts venues are professionally managed and their board members are knowledgeable about the art form the organization is engaged in.
  • The venues have significant budgets. (This not to say that they are always safely in the black financially.)
  • The venues have leaders and managers with strong working connections, one way or another, to the arts community outside of their local areas. Such networks of personal connections are valuable for accessing talent, fund-raising, earning income and marketing. Many have come to the area as tourists, second home owners or as visitors to friends and family who are residents. That means that tourism, once it reaches a certain level, can simulate local arts projects by bringing in people who work in the arts. I think such links are far more important than is commonly realized.


ENDNOTES

1) See, for example: N. David Milder. “The New Normal’s Challenges to Developing a Downtown Entertainment Niche Based on Formal Entertainments: Part 1.” March 9, 2014 https://www.ndavidmilder.com/2014/03/the-new-normals-challenges-to-developing-a-downtown-entertainment-niche-based-on-formal-entertainments-part-1 and N. David Milder. “Based on Formal Entertainments: Part 2 the audiences; revised 041214.” March 28, 2014 https://www.ndavidmilder.com/2014/03/the-new-normals-challenges-to-developing-a-downtown-entertainment-niche-based-on-formal-entertainments-part-2-the-audiences N. David Milder. “Downtown Formal Entertainment Venues: Part 3.” April 24, 2014. Revised April 26, 2014. https://www.ndavidmilder.com/2014/04/downtown-formal-entertainment-venues-part-3   N. David Milder. “Downtown Formal Entertainment Venues Part 4: Movie Theaters.” May 25, 2014 https://www.ndavidmilder.com/2014/05/downtown-formal-entertainment-venues-part-4-movie-theaters

2) Roland J. Kushner and Randy Cohen. National Arts Index 2016, p.2; Americans for the Arts.   http://www.americansforthearts.org/sites/default/files/2016%20NAI%20%20Final%20Report%20%202-23-16.pdf

They did not look at arts organizations with annual revenues under $50,000 so their finding that larger arts organizations are more prone to having deficits should be treated with caution. The 2016 version of the NAI will be its last and that is a real shame. It has been a treasure of data that arts organizations should use not only for advocacy, but also for planning their budgets and programs.

3) See: http://www.americansforthearts.org/sites/default/files/ArtsFacts_ArtsOrganizationRevenues2014.pdf

4) NEA. “How the United States Funds the Arts.” 2012. P 1. https://www.arts.gov/sites/default/files/how-the-us-funds-the-arts.pdf

5) Lisa M. Sontag-Padilla, Lynette Staplefoote and Kristy Gonzalez Morganti. RESEARCH REPORT. Financial Sustainability for Nonprofit Organizations: A Review of the Literature. Rand Corporation, 2012. http://www.rand.org/content/dam/rand/pubs/research_reports/RR100/RR121/RAND_RR121.pdf

6) Data on the revenues and expenditures of the specific arts organizations described in this article come from the Form 990 filed with the IRS and available from online sources.

7) Randy Cohen. “What’s Measured Matters . . . Private Giving to Arts &

Culture: Way Up in 2014.” ARTSBLOG, July 10, 2015. http://blog.americansforthearts.org/2015/07/10/what%E2%80%99s-measured-matters-private-giving-to-arts-culture-way-up-in-2014

8) Ibid.

9) Giving USA. “Data Tables for Charts in The Numbers

Giving by source, 1976–2016.”

10) See endnote 2, p.24

11) The Conference Board. “TCB Giving Numbers 2016.” https://www.conference-board.org/publications/publicationdetail.cfm?publicationid=7297&centerId=1

12) See Endnote 2

13) Ryan Stubbs, “Public Funding for the Arts: 2014 Update.” GIA Reader

Vol. 25 No. 3, Fall 2014 http://www.giarts.org/article/public-funding-arts-2014-update

14) Andy Horwitz, “Who Should Pay for the Arts in America?” The Atlantic, Jan 31, 2016. https://www.theatlantic.com/entertainment/archive/2016/01/the-state-of-public-funding-for-the-arts-in-america/424056/

15) Zannie Voss and Glenn B. Voss, “Arts and Culture Are Closer Than You Realize: U.S. Nonprofit Arts and Cultural Organizations Are a Big Part of Community Life, Economy, and Employment —and Federal Funding Enhances the Impact.” National Center for Arts Research, SMU. Pp.7. https://sites.smu.edu/Meadows/NCARPaperonNationalArtsandCultural%20Field_FINAL.PDF

16) Information kindly provided by Trey Sherwood, Executive Director of the Main Street Alliance in 2016.

17) Information about these facilities was obtained from the Goodspeed Musicals website: http://www.goodspeed.org/?gclid=CJ7Tqp6sxdQCFYaPswodusULkQ

18) See the Artist Village pages on Goodspeed’s website.


UP NEXT IN PART 2 OF THIS ARTICLE

Part 2 of this article will focus on the changing characteristics of our population’s participation in the arts and the impacts of the arts on downtowns. Failure to understand the altered arts participation landscape is leading to bad project and program choices by arts organizations. Failure to understand the impacts the arts really have on our downtowns has led to some very disappointing results for downtown leaders and stakeholders who worked hard to bring arts projects to their districts.


* The Forthcoming “Let’s Get Real About…” Series of Articles.

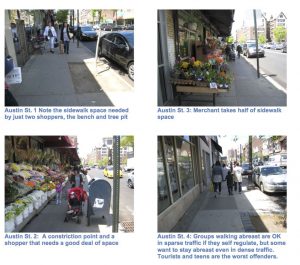
My recent article on pedestrian activity concludes the large number of articles I’ve done on the New Normal for Downtowns that I have been working on since 2008. I will, of course, again return at times to that topic in the future, but I also want to write about many other subjects. At this moment, that means describing and trying to spark debate about a number of subjects I believe are being mishandled by downtown revitalization leaders and experts because either unproven assumptions are being made or the subject is simply not being properly understood. This will be done in a new series of articles that I have dubbed “Let’s Get Real About…”. I have already taken on one of these subjects in my articles about leakage analyses. Above, is the first article in that series. It details the challenges presented by trying to use the arts as a key downtown revitalization tool. Other topics I plan to address in future articles, though not in the order in which I probably will take them on, include:

  • Are lots of people strolling, window-shopping and browsing in stores what makes downtown retailers successful? I already broached this subject with some detail in my pedestrian activity article, but I want to do a deeper dive on this subject because I think this behavior pattern holds such a pivotal position in our conventional wisdom about how downtowns work.
  • Are the uses of best practices/success stories usually beneficial?
  • Are small businesses always revitalization assets — and big businesses bad for the small ones as well the community at large?
  • Are new retail spaces not needed because the market is already glutted?
  • Eyes on the street: is that what really makes people feel safe?
  • Are most downtown retail market analyses on the mark?
  • How the Internet is eroding the legendary importance of location, location, location.

I welcome suggestions about other topics and articles from other authors on them.

Posted in BIDs, Business Recruitment, Central Social Districts, Change Agents, Creative Class, Downtown Niches, Downtown Redevelopment, Economci Development, Entertainment, Entertainment niche, Financial tools, Formal entertainment venues, movie theaters, New Normal, Planning and Strategies, Small Towns, Suburban Downtowns, The Arts |

SOME THOUGHTS ON THE PERPLEXITIES OF DOWNTOWN PEDESTRIAN ACTIVITY

Posted on May 13, 2017 by DANTH

By N. David Milder

Introduction

Over the past 15 to 20 years, pedestrian activity has become an essential element in our understanding of how successful downtowns and Main Street districts work. Such activity has qualitative and quantitative aspects. The well deserved and growing attention that downtown “walkability” has garnered reflects the qualitative concerns of those active in downtown revitalization about the physical and social conditions that encourage pedestrian activity. It is also a de facto acknowledgement of the importance of such activity. However, in my opinion, a lot of important issues are being generated by pedestrian activity that are not being acknowledged, much less being resolved. They could benefit from conceptually and methodologically rigorous quantitative analyses. Moreover, such analyses needs to look at not just pedestrian activity in isolation, but also how it relates to other economic and social behaviors and attitudes. In this article, I’ll take a stab at outlining some of these issues.

How Much Pedestrian Activity Should Your Downtown Have?

It might be reasonably argued that this is one of the most basic questions that should be addressed by any downtown revitalization plan or strategy. Below are some observations and ruminations about pedestrian flows I’ve been accumulating over several years. They stimulated me to look more closely into this question and to realize how complex the task of answering it might be.

The Importance of the Quality of the Pedestrian’s Experience. Many years ago, before the NYPD instituted corrals for the event, I took my nine-year old daughter to Times Square on New Years Eve. It was a ghastly mistake! A strong surge in the crowd sent people flying into us and my daughter went to the ground. I thankfully was able to get her in my arms before she was trampled by the crowd. Lesson learned: a lot of people close together on foot can be very, very dangerous. At what point does pedestrian density become dangerous? Is there some metric about how much space a pedestrian needs to be safe and to feel comfortable and unstressed?

I have long avoided many streets in Midtown Manhattan at certain times of the day, e.g., lunchtimes and during the evening rush, and especially at certain times of the year, e.g., most of December and St Patrick’s Day, because the sidewalks are so crowded, sometimes also with raucous people, that:

  • I have to walk in the street and then take care that I’m not run over by passing vehicles or
  • Staying on sidewalks, I strongly fear bumping into other people or being bumped into far more often than I’d like by unpleasant people. Walking then becomes a very labored, fearful and thoroughly unpleasant experience. Lesson learned: overly crowded pedestrian traffic is inducing me to dislike walking in these areas so I avoid them, much as New Yorkers avoided Bryant Park back when it was known as a crime ridden and dangerous place. I suspect I am far from alone in having this reaction. As Yogi Berra famously said, “no one goes there anymore—it’s too crowded.”

How many downtowns are inducing avoidance behavior and having their images tarnished by too much pedestrian traffic congestion? My suspicion is that it is happening far more often than their leaders and stakeholders either realize or would want. In turn, this raises the question of at what point does the density of pedestrians begin to significantly make walking an irritating, joyless labor and an inducement for avoidance behavior? How much pedestrian traffic is too much pedestrian traffic?

A headline in a 2016 article in the New York Times blared: “New York’s Sidewalks Are So Packed, Pedestrians Are Taking to the Streets.” (1) Such behavior is a good indicator of a malfunctioning pedestrian environment, but it is not a good measure of the extent of the underlying problem. Many, many other pedestrians are staying on the sidewalks, but are far from happy about the situation they are in.

While this happening in Manhattan on 5th Avenue in and near Rockefeller Center, in the Times Square Bowtie, along Broadway and elsewhere in Lower Manhattan, around Macy’s and near Penn Station is perhaps to be expected, I have been in similar pedestrian traffic jams, though less frequently, on the sidewalks of: Austin Street in Forest Hills, NY; Main Street in Flushing, NY, Jamaica Avenue in Queens; Fordham Road in The Bronx, Main Street in East Hampton, NY, Michigan Avenue in Chicago, Newberry Street in Boston and Ocean Drive in Miami Beach.

Impediments to a Good Pedestrian Experience. In many of these pedestrian traffic jams, walking is being constricted by such things as narrow sidewalks, stores bringing their merchandise stands out on the sidewalk, outdoor restaurant seating, newsstands, street and truck vendors and their customer crowds, street performers, street tree pits, planters, benches, construction sites, bus shelters and normal window shoppers. In too many instances, the possible pedestrian path on the sidewalk is only wide enough for one person. Lessons learned:

  • When these issues are not properly addressed they can make walking so difficult and unpleasant that they negatively impact a district’s image and increase avoidance of important portions of it.
  • Even very desirable amenities, e.g., street trees, planters, benches and bus shelters can cause problems simply because of the amount of sidewalk space they occupy. (See the Austin Street photos below). Also, shoppers with shopping bags, shopping carts and children in strollers/carriages will need more space than the average pedestrian. Americans are also getting more obese and consequently occupy a larger volume of space. Smaller communities certainly are not exempt from having such problems.

Downtowns that want to attract more pedestrians need to take these factors into consideration. Just setting the attraction of more pedestrians as a goal is acting with blinders on. As the astute Andy Manshel recently emailed me: “Our work is always all about balance.”


Austin Street in Forest Hills, NY (and in NYC) is a very strong and popular shopping corridor. It suffers from narrow sidewalks, sometimes even when pedestrian flows are relatively sparse. That problem rises to the point of being very detrimental during late afternoon and weekend pedestrian peaks.


Rules for the Sidewalk? Certain pedestrian behaviors, those that might be called pedestrian incivilities, too often also impede the smooth flow of pedestrians and make walking thoroughly unpleasant. Some of these incivilities are: raucous, drunken behaviors; walking against the flow of traffic; walking in groups of three or more lined up across the sidewalk; aggressive passing; stopping and standing in the middle of the sidewalk, especially in groups. Lessons learned:

  • There may be rules of the road for drivers, but apparently, there are no behavioral rules of the sidewalk for pedestrians.
  • There is a need for an accepted etiquette of pedestrian behavior, but its codification and acceptance will probably be very, very hard to accomplish. How could it be accomplished and by whom?
  • Pedestrian flows, I’ve been told by experts, are self-regulating. Who or what steps in when that self-regulation fails to work properly? Incivilities are good examples of such failures.
  • Individuals can find that self-regulation can become a very negative experience, full of uncertainties and possibly fears. It also can require a lot of hard work.
  • My observations suggest that tourists are more prone than New York residents to engage in pedestrian incivilities, though local teenagers are also frequent miscreants. If this is the case, how do the tourists impact on our ability to remediate this problem?
  • Districts with high levels of pedestrian incivilities should not try to develop levels of pedestrian traffic that increase the frequency and adverse consequences of such incivilities.

Pedestrian Traffic in Small Towns. Small and medium-sized downtowns will never have the consistently strong pedestrian flows found in our big, traditionally urban cities such as NYC, Chicago and Boston. (See the table below.) They just do not have the needed large daytime populations and the development densities that generate them. So, how much pedestrian traffic should they have? And how can that be determined? By their land use densities? By the needs of local merchants and those targeted for recruitment? By sidewalk capacities? By the number required for the district’s sidewalks to look active and interesting? Or are they so small that such a concern is simply irrelevant for them?

Who You Add Really Counts! Among the relatively smaller downtowns, I have come across some instances where local leaders have complained that their events have drawn either more people than they could handle properly or the kinds of folks they did not want (e.g., bikers, hot rodders, aggressive panhandlers, drug dealers). In several other small and medium-sized downtowns both merchants and residents have complained that a recent big influx of tourist traffic has changed the basic character of their district for the worse. Lesson learned: the composition of the increased pedestrian traffic can really matter; another reason more pedestrian traffic may not always be beneficial.

Pedestrian Traffic as a Locational Asset. Conventional wisdom has long held that strong pedestrian traffic should be one of a downtown’s most valuable locational assets. However, I have not been able to find any research supported metric that shows with any accuracy how many pedestrians passing by a location are needed to support any kind of retail, food or entertainment operation. Questions:

  • How is a retailer to know if the pedestrian count near a potential new location is a really sufficient for its store to prosper there? Apparently, from their sales records, many retail chains do know, though in fairly broad terms, that their stores do better in locations with relatively high pedestrian counts. Yet, there is no evidence that they know of a threshold of pedestrian activity that has to be exceeded, much less how many passing pedestrians are needed to support a square foot of leased space or $1,000 of store sales.
  • How, then, is a downtown EDO to determine what level of pedestrian activity its prime retail-prone spaces need to attract and sustain desired retail tenants?

My recent look at the 34th Street District had an admittedly small sample to study, but it did indicate that some of the district’s most desirable retailers probably valued being closer to other retailers of similar caliber more than proximity to larger pedestrian flows (2). Question: how important is pedestrian traffic in retail locational decisions compared to other factors? Which other retailers are nearby, the characteristics of available spaces, including their size, rent and lease terms, may be more important.

One of the unexplored and untested gospels about healthy downtowns is the pedestrian strolling, window-shopping and browsing scenario for retail success. According to this lore, downtowns are healthy and retailers successful when downtown visitors can leisurely stroll along its sidewalks, window-shop and then browse inside the shops. It is one of the reasons why downtown retail locations are supposedly advantageous. However, today, this scenario often breaks down:

  • In many smaller downtowns and Main Streets, there just are not enough shops to warrant much strolling and the shops are not apt to change their merchandise frequently enough to warrant much window shopping or browsing. My field experiences in such towns suggest that store visits are overwhelmingly need driven to merchants that are locally well known and these merchants are identified destinations before the shopping trips are initiated. Question: In these downtowns/Main Streets, can more resident-driven pedestrian traffic really make all that much difference for retailers?
  • In really big downtowns with very high pedestrian traffic, it is sometimes hard to window shop because of frictions with passing pedestrians. At what level does high pedestrian traffic begin to significantly discourage window-shopping?
  • Today, before Americans go on a shopping trip, they overwhelmingly search on the Internet for the merchandise they want and the shops where it is sold. Consequently, the related residential shopping trips are now much more destination generated, less the result of strolling, browsing and exploring. With tourists, strolling and window-shopping behaviors are probably still significant. However, it may be asked if a lot of pedestrian traffic is still really an important factor for the retailers that are mainly attracting Internet-driven destination shoppers? The Internet is eroding what location, location, location has meant in our downtowns.

Is Simply More Really Better? In decades past, when downtowns were in decline or just starting to revive, getting higher levels of pedestrian traffic was a highly desired objective, even when there was little hope of achieving it. In more recent years, almost every downtown and Main Street revitalization strategy or plan I’ve seen has echoed this “more pedestrian activity is better” theme. Some of them, I wrote. One of my strongest arguments above has been that more is better only if a good pedestrian experience can be maintained or created. Many more of these revitalization plans and strategies should have addressed this issue of the quality of the pedestrian experience they provide – including some of mine. The objective downtown EDO’s should really adopt is attracting more visitors who will be happy because they so enjoyed walking on your downtown’s sidewalks and in its public spaces. I am even tempted to say that should be The First Commandment of Downtown Revitalization.

A Quick Look at the Times Square Bowtie

A brief look at Times Square is worthwhile because it demonstrates so forcefully a number of the points I have argued above.

One of the most salient features of the new normal for our downtowns is that while being successful, they must face a range of relatively new problems. Nowhere is this more forcefully demonstrated than in Times Square, where very high pedestrian flows have been a growth and business recruitment asset as well as the cause of overcrowded sidewalks, frequently unhappy pedestrian experiences and possibly a disincentive for business attraction and retention.

The behavior of the Times Square Alliance (TSA) also demonstrates how important the collection of data on pedestrian traffic has become for some downtown district management organizations. In 2012, the TSA completed the installation of an automated counting system that “provides 24/7/365 data on the number of pedestrians who enter and pass through specific counting zones of the Times Square Bowtie (7th and Broadway between 42nd and 47th).” (3)

It’s Economic Rebirth. This world famous urban area, especially in the “Bowtie,” has experienced an enormous and impressive rebirth. In the latter part of the 20th Century, despite its large cluster of legitimate “Broadway” theaters, the many show-goers they brought in, and the hordes of tourists attracted by its signage and honky-tonk atmosphere, Times Square increasingly was known as a decaying place filled with of all sorts of porn establishments, lots of homeless and prostitutes and a high level of criminal activity. Today, that blight and most of the deviant behavior has disappeared – to the point that a few mavens long for some of its former edgy, honky tonk atmosphere to return. The area has attracted new office buildings with major corporate tenants and hotels. Major retail chains have opened, including: Loft, Forever 21, Gap, H&M, Uniqlo, Levi’s, American Eagle, Charles Tyrwhitt. The theaters have had record box office numbers in recent years. Overall, today, Times Square is a stronger than ever attraction for tourists.

Its retail rents are an important indicator of its resurgence and desirability as a retail location. In 2016, average asking rents in the Bowtie were $2,170 PSF, the second highest among all of Manhattan’s major retail corridors. Moreover, these rents grew by 150% between 2008 and 2016, the largest increase among those retail corridors. (4)

An Astonishing Level of Pedestrian Activity. The TSA’s counts for March 2017 showed that:

  • Over 300,000 pedestrians enter the Times Square Bowtie each day. That is equivalent to being the 64th largest city in the USA by population.
  • On the busiest days, Times Square pedestrian counts are as high as 480,000. That is equivalent to being the 35th largest city in the USA.
  • Times Square stays active in the evening: 66,000+ pedestrians enter the “Bowtie” between 7 pm and 1 am. (5)

Only a handful of commercial districts worldwide can rival these numbers.

The map below shows the March 2017 pedestrian counts broken down by the nine sidewalk and five plaza locations where they were observed. Within the core Bowtie area are six of the sidewalk locations and all five plazas. The plazas are more like public spaces, with places for people to sit and stay. They averaged 93,866 visitors per day, with a high of 158,739 and a low of 72,266. The average sidewalk counts in the Bowtie, that look at the more constantly moving pedestrians in smaller spaces, was about 30% lower than that of the plazas, 66,020, but still impressively strong. The sidewalk counts ranged from a high of 78,810 to a low of 48,608.

Times Square 1: Map from the Times Square Alliance shows pedestrian counts in March 2017 at different locations.

These High Levels of Pedestrian Traffic Are Not Problem Free. By the early 2000s, because of the negative experiences generated by Times Square’s very heavy pedestrian traffic, I and many, many other New Yorkers, avoided walking in the area as much as possible, only doing so when going to important business appointments or shows at one of its many theaters. The sidewalks were so packed that walking in the area was thoroughly unpleasant and too often irritating. A good tell of this was the fact that more and more people were leaving the sidewalks and taking to the streets. A TSA pedestrian count in 2006, for example, found that as many as 9,148 pedestrians a day were walking in the street on Broadway between 46th and 47th Streets despite high levels of vehicle traffic (6). It seems reasonable to assume that many of them felt it was safer, easier and/or faster to walk among the vehicles than in the dense flow of pedestrians!

A Very Gutsy Project to Rebalance the Situation. Broadway is an old and long street that predates Manhattan’s street grid and runs 13 miles through Manhattan, two miles through The Bronx and 18 miles through towns in Westchester. Because it cut diagonally across so many important north-south avenues it caused a lot of vehicular congestion. Its sidewalks in the Times Square Bowtie were also badly overcrowded. Around 2008, the Bloomberg Administration decided to take a very bold move on Broadway below Columbus Circle that basically banned it for vehicles or made it very unfriendly for drivers. At least half of its traffic lanes were closed and repurposed for bike riders and pedestrians. Between 33rd and 35th Streets near Herald Square and in the Times Square Bowtie between 42nd and 47th Streets, Broadway was completely closed to vehicle use. The resulting freed space in the Bowtie was used for more sidewalk space for pedestrians and for plazas with street furniture that visitors could use. (See photos above Times Square 2-4)These renovations took about six years to complete, finally concluding just before New Years Eve in 2016. They reportedly added about 100,000 SF of pedestrian space that reduced pedestrian congestion and added 50% more space for events and concessions (8). Reportedly, 65% of NYC residents felt the plazas made the experience of being in Times Square better. Pedestrian traffic in the street bed also was said to have been reduced, even while overall pedestrian traffic reportedly increased.

New “Old” Problems Emerged. Unintended consequences are perhaps the devil of downtown revitalization — they certainly bedeviled Times Square’s new plazas. Before the area’s revival, it was known for its porn-oriented businesses. They left, but around 2002 the Nude Cowboy (who was not completely nude) appeared, who sang and posed for photos for tips. Over the years, especially after the creation of the plazas, other buskers came in along with cartoon, comic book and action hero costumed people who posed for photos with visitors for tips. They were joined by the “desnudas,” women who were nude, but had costumes painted on them. (See photos Times Square 5-7). By 2015, as the numbers of these tip seekers increased and as complaints rose about their nudity and aggressive, perhaps illegal, treatment of visitors rose to a crescendo, a significant political movement emerged to tear up the plazas. The NYPD seemed to be in the lead. Noted urbanists, such as Jan Gehl, rushed to the plazas defense, arguing that better stewardship could keep them both vibrant and orderly.

One outcome was the creation within the plazas of Designated Activity Zones to which the tip seekers were confined. You can see the white boundary line of one of these zones in photos Times Square 6 and 7. I have not seen any study of the zone’s impacts. My own field observations on three visits over the last year are that the behavior of the tip seekers has become less aggressive or problematic. My hunch is that a lot of them know that if their behavior again becomes an issue, then they will soon be gone.

Impact On Business Recruitment and Retention. In a lot of ways, the somewhat edgy behavior of the tip seekers is consistent with Times Square’s edgy honky-tonk behavior of decades past. Furthermore, one might reasonably argue that, today, edginess along with its humongous colorful signs and dense crowds remain as fundamental pillars to the area’s image and attractiveness to tourists. But, how consistent are they with the needs of local business recruitment and retention efforts?

Around the time, in 2015, when the plazas were being called into question, an article appeared in the New York Times that was titled “Times Square’s Crushing Success Raises Questions About Its Future.” (9) The article asks: “With all this going for it, why are so many landlords, office tenants and theater owners worried about the future of Times Square?” Its answer is very noteworthy because it was made well after steps had been taken to significantly reduce pedestrian congestion in the area: “The same reason that retailers and advertisers lust after a Times Square location is the same reason that others now find it unbearable: the crowds.” (The emphasis added is mine).

Office workers were said to complain about navigating “thick and sometimes unyielding knots of tourists in various hot spots.” Some business people said the area was too congested for New Yorkers to do business. Office workers found it hard to get lunch in restaurants so crowded with tourists. Major corporate tenants were trying to solve crowded streets problem by opening cafeterias and gyms within their office buildings. Others had their executives conduct business east of the district.

A lawyer in a large white shoe law firm that left Times Square noted: “Everyone agreed, it’s awful there. People would go well out of their way to avoid Times Square.” (10)

Also noteworthy is the fact that local businesses that basically deal with the tourists, i.e., those in the hospitality and retail sectors, are not negatively impacted by the crowding.

The Impacts of the Plazas. The plazas have increased pedestrian traffic, but whether or not they have substantially improved the pedestrian experience remains unknown. My personal experiences suggest the improvements, if any, are marginal. My suspicion is that tourists are much more likely to put up with the area’s poor pedestrian experience because it is, in a sense, what they came to have and they know they do not have to endure it on any repeated basis – they can go back home. We New Yorkers, on the other hand, are usually in a rush and we will avoid the area’s congested pedestrian flows whenever and however we can.

The leaders of the TSA are pros and apparently fully aware of the situation. As one of them stated to the Times: “Our concern is that the public realm is so unpleasant that we may at some point hit a tipping point, where companies won’t take space in Times Square. We’re not there yet, but the data is telling us we could get there.” (11)


ACKNOWLEDGEMENT

This book has had a great impact on my interest and understanding of urban pedestrian behavior: Urban Space for Pedestrians by Boris Pushkarev and Jeffrey Zupan (MIT Press 1975). My understanding is that Jeff and his RPA crew are doing an update to it. I am eager to see the results and recommend that anyone interested in downtown revitalization should be as well.

ENDNOTES

1- Winnie Hu, “New York’s Sidewalks Are So Packed, Pedestrians Are Taking to the Streets.” The New York Times. June 30, 2016.   http://nyti.ms/29dy7m3

2- See: https://www.ndavidmilder.com/2017/04/34th-street-a-fabled-shopping-district-and-window-on-the-future-of-downtown-retailing

3- From the Times Square Alliance (TSA) website: http://www.timessquarenyc.org/do-business-here/market-facts/pedestrian-counts/index.aspx#.WQda-lPyvjA

4- Real Estate Board of New York (REBNY) Retail Report 2016

5- From the Times Square Alliance (TSA) website: http://www.timessquarenyc.org/do-business-here/market-facts/pedestrian-counts/index.aspx#.WQda-lPyvjA

6- See: The TSA’s 2006 Summer Pedestrian Counts, Wednesday, July 16 available on its website.

7- See: http://www.timessquarenyc.org/live-work/times-square-transformation/faq/index.aspx#.WRMVWFPyvjB

8- See: https://en.wikipedia.org/wiki/Times_Square

9- Charles V Bagli, “ Times Square’s Crushing Success Raises Questions About Its Future.” New York Times, Jan. 26, 2015. http://nyti.ms/1DcL5o6

10- Ibid.

11- Ibid.

Posted in BIDs, Business Recruitment, Central Social Districts, Crime, Downtown Niches, Downtown Redevelopment, downtown retailing, Economci Development, EDOs, Entertainment, Entertainment niche, Informal entertainment venues, New Normal, Office Development, Pedestrian traffic, Planning and Strategies, Public Spaces, retail chains |

The New Normal For Our Downtowns Cheat Sheet

Posted on February 1, 2017 by DANTH

By N. David Milder

Since 2008, I have been writing about the New Normal for our downtowns. Recently, I have been asked on several occasions if I had a relatively brief summary article. I didn’t, so it seemed the time to write this one.

Downtowns Are Now Expected To Succeed

Success stories abound everywhere you look. Not every downtown has made it, but many have, and many more are well on their way. Today, laggard downtowns really stand out.

Downtowns Are The Place To Be

Today, lots and lots of people seem to want to be downtown, not to flee or avoid it. They are easily attracting people to visit, work and, especially, live. Importantly, this is increasingly happening organically. That’s a significant paradigm shift from a few decades ago.

In fact, downtowns have become so popular that many are now facing problems of high pedestrian congestion and how to get all these people in and out of the downtown quickly, comfortably and affordably via mass transit, vehicles, bikes and on foot. Success does not always mean the end of all problems; sometimes it brings along its own set of new ones.

The Negative Impacts of the Fear Of Crime And Actual Crime Rates Have Diminished Significantly

Downtown streets at night are less likely to be empty and fear-inducing.

In most large cities, crime and the fear of crime have fallen so significantly that they have fallen out of sight as an issue. There are several strategies that appear to be effective. However, drug use and drug trade induced crime has increased dramatically in many smaller and more rural communities.

Our Ability To Revitalize Downtowns Has Vastly Improved Since The 1980s

We may not be able to solve every problem, but we have a lot of real knowledge about how to revitalize and manage downtowns. Moreover, we now have in many places the professionally staffed organizations to use that knowledge, e.g., BIDs, SIDs, Main Street organizations.

Downtown Housing    

Most downtown leaders and experts would agree that the development of significant amounts of market rate housing has been the most important force in successful downtown revitalization efforts. Housing placed in walkable urban contexts, especially near downtown workplaces, has sparked large district revivals. Housing near commuter rail and subway stations also have helped power suburban downtown and neighborhood district revivals away from the urban core.

Mixed use housing in downtown Cranford, NJ

Since the Great Recession, new condo and coop projects have been eclipsed by new rental projects in many downtowns as a result of changing consumer preferences and the impacts of “deliberate consumer” behaviors.

In many medium-sized downtowns, retail has become a less viable component for mixed-use projects because of the reduced demand for retail space and the retail chains’ greater preference for proven locations.

Market rate downtown housing seems more and more to be only for the affluent and very wealthy. As a result, projects with “micro-units” are being built to provide an affordable solution.

Will downtowns stop being everyone’s neighborhood? In the 1970s and 1980s, many feared downtowns were destined to house only our poorest, most disadvantaged residents. Now, will they be ghettos of the wealthy? Should policies be put in place to assure economic diversity in our downtowns?

Nevertheless, the value and viability of downtown housing as a growth engine continues.

Deliberate Consumers

These consumers display much more deliberation about their expenditures than their pre-2008 counterparts, are much more liable to be concerned about needs than wants and tend to focus on a product’s price, quality and/or value. Many have come to expect steep discounts.

They include the vast majority of middle income households, especially those whose incomes have not increased meaningfully for many, many years. Also, this behavior pattern is seen even in customers of luxury markets, where about 30% of the sales are “off-price.” Economic recovery seems to have increased consumer expenditures somewhat, but the cautious consumer decision-making seems to have continued on in full force.

These consumers are everywhere, careful, want their money’s worth, and are here to stay.

E-commerce  

Though more than 90% of all retail sales are still in traditional brick and mortar stores, e-retail sales for specific lines of GAFO merchandise have passed 25% to 50%. If current trends hold, they will pass those levels in several other merchandise lines within a few years. But, e-retailing’s biggest impact comes through how it has changed consumer behavior. Most Americans now make an online product and store search before shopping in traditional shops. They browse less inside shops and more often go directly to the merchandise they want and then leave after a purchase. They use smartphones inside stores to find competitive prices online. Some pay with their phones.

It is highly unlikely that brick and mortar shops will disappear. The vast majority of Americans still prefer shopping in them to shopping online. Even online born retailers – e.g., Amazon, Warby Parker — are also opening brick and mortar stores because they see potential benefits resulting from customers being able to use both channels together.

Nonetheless, traditional retailers have to change their business formulae to better integrate the internet into their brick and mortar operations. This probably means that their legacy stores will become less important in the initial stages of the retail sales transaction process, though often more important in the later stages. They will have to take on new functions like pick up points for online orders, storage for quick local deliveries of online purchases or the venues for special attention and pampering for customers filtered out by retailers for making significant online purchases and how they navigated the store’s website.

Retailing In Various Types Of Downtowns  

The emergence of deliberate consumers, the growing power and influence of e-commerce and the prior building of too much of retail space have combined to create large upheavals in the retail industry. Retailers are looking for fewer and smaller new spaces in very low risk locations where other retailers are doing really well.

Different kinds of downtowns have been impacted in different ways and to varying extents by the Great Recession. Here are some examples:

  • Districts with large luxury markets came through the Great Recession the least scathed and recovered the fastest. Their wealthy shoppers had the best recovery to pre-recession spending levels. Their luxury retail chains benefited from a growing global luxury market and were consequently financially better able to absorb any sales downturn in the US market
  • Very small towns with populations less than about 2,500, were among the least hurt downtowns because they had few if any national chain stores. Their retail prospects improved as the incomes of their deliberate consumers recovered
  • Many towns in the 15,000 to 35,000 population range have seen their malls badly falter or completely fail as their anchor department stores (e.g., Sears, Kmart, JCPenny) and specialty retail chain tenants closed.
  • These retail failures have created an opportunity for many small GAFO merchants to open and do well. The e-retailers and the local mass market merchants like Walmart, Target and Best Buy did not capture all of the market share that the closing department stores and specialty retailers had disgorged. The mass market retailers are typically also ignoring that disgorged share for the small retailers to capture by not increasing their presence in these towns, .
  • GAFO retailers in towns in the 2,500 to 15,000 population range also seemed to benefit from these closings. Their local trade area residents previously typically outshopped for GAFO merchandise in the struggling/closed malls
  • As many commercial districts in The Bronx, NY, have shown, moderate income ethnic downtowns and neighborhoods are attracting retailers under the new normal to the degree that they can accommodate the often very large space needs of the value oriented and off-price retailers, e.g., Target, Best Buy, Marshall’s and TJ Maxx. Sometimes this means the “factory store” or “outlet” formats of some very highly regarded chains such as GAP, Banana Republic, Ann Taylor and Nine West. Fitting the large format value retailers into these downtowns so as to retain their walkability and scale is a critical urban design issue. Unfortunately, too often the project solutions have been damaging or half-thought through.
  • Many downtowns in affluent suburban communities with large numbers of well-regarded specialty retailers, have seen many of them close. Among them were chains such as Chico’s, Coach, Eileen Fisher, Gap, Talbot’s and Ann Taylor. In many instances, the closed stores had under average sales for their chains. This made them vulnerable when their brand encountered strong sales headwinds nationally. In some instances, the stores’ subpar sales were due to more cautious spending by local shoppers. In others, the chain’s merchandise did not mesh with local lifestyles. For example, one expert has noted that Chico’s shoppers nationally had basically “aged out.” In any case, these downtowns are now faced with an unusually large number of vacancies of relatively large spaces that are located in highly desirable locations. They need a strategy to fill those space that will also maintain the strength and attractiveness of the downtown. A viable strategy for maintaining the downtown’s strength may have to look at non-retail uses, as well as subdividing large spaces.

Office Functions and Development  

How firms now use office space has drastically changed, influenced by practices at successful high tech firms. With that change, many firms, large and small, are now looking for open spaces for “hot desks.” They have few if any private offices and are configured to stimulate worker interaction and cooperation. They are also using less office space per worker, because the workers are spending more time telecommuting from home or being out with clients.

Consequently, overall demand for office space is being constrained, while on the supply side many of the older downtown buildings are badly out of date and unmarketable. New or adaptively rebuilt downtown office buildings are needed that are configured for the no-office, hot-desk, interactive work environment. Many of the dated office building are either being torn down or converted into residential buildings.

Here and there, usually organically, but sometimes according to a plan, downtown office spaces are being used to stimulate new businesses. This trend is manifested in business incubators, co-worker spaces and buildings geared for start ups. Given the steady growth of the nation’s contingent workforce, many downtowns – be they urban or rural — may find significant economic growth if they can attract and nurture local contingent workers. However, to do that will likely require the presence of several kinds of county or regional level support programs.

Central Social Districts  

Since antiquity, successful communities have had vibrant central meeting places that bring residents together and facilitate their interactions, such as the Greek agoras and the Roman forums. Our downtowns long have had venues that performed these central meeting place functions, e.g., churches, parks and public spaces, museums, theaters, arenas, stadiums, multi-unit housing, etc. They are all essential elements of the downtown’s Central Social District (CSD).

Greatly strengthened CSDs have been another important factor associated with the emergence of strong and popular downtowns. In an increasing number of downtowns, their CSD functions have become more important than their traditional CBD functions, e.g., retail and office based activities. Today, for most downtowns, be they large or small, their revitalization strategies must focus on strengthening and growing their CSD’s elements.

The housing element has been discussed above; here are some comments about other important CSD elements:

Formal Entertainment Venues. These include such venues as museums, PACs, concert halls, stadiums, and arenas. They often are held in great esteem within their communities and especially among the local social, business and political elites. However, they also tend to be relatively expensive to build, maintain and operate. Many are venues for types of arts events that have suffered significantly decreased attendance in recent years. There have been a substantial number of failures among these venues and a much larger number that struggle financially each year because their true costs for each admission cannot be sustained by their ticket prices. They consequently need to constantly ask for lots of donations and grants to remain solvent. Too often, it is not a sustainable business model.

Many of them are seriously underutilized: closed during the days and only “lit” some of the evenings. Most performance venues in medium-sized downtowns probably will have under 80 events a year. They can have positive impacts on local eateries and watering holes to the degree that they are active. Their impacts on retail, if any, have an overwhelmingly indirect and contingent route – through the new residents they might attract. Conversely, dark cultural centers can actually be detrimental to a downtown’s sense of vitality.

Ticket prices for these venues are usually relatively expensive – far above the price of local movie tickets, for example – so a substantial portion of middle income households are discouraged from attending their events.

There is little doubt that formal entertainment venues can be wonderful assets for a community. However, they demand a lot of resources and management expertise. Before a downtown decides to build one of these venues, local leaders must realistically assess whether they have the resources and management skills to not only build it, but also to maintain it and to run its programs without continued financial stress well into the future.

Restaurants. Restaurants are particularly important for downtowns not only because they are places where people can obtain needed nourishment, but also because they are places where folks go to have fun, be entertained and, most importantly, enjoy the company of other people. They are the essential driver of downtown vitality.

The growth of strong downtown restaurant niches and clusters has been another strong characteristic of successful downtowns of all sizes. They help bring downtowns alive after dark. Even though independent merchants are unlikely to be open during dinner hours and thus benefit from the restaurants’ customer traffic, they do benefit from the restaurant patrons’ lunchtime visits and their improved image of the district. Retail chains, with longer operating hours, are more likely to benefit directly from the restaurants’ customer traffic.

In small and medium sized communities, restaurants are relatively easy to start-up because of the relatively small market share they have to win to be viable as well as their districts’ comparatively low rents and labor costs.

The consumer market for restaurant fare is enormous: households in America spend relatively similar amounts for eating out as they do for meals prepared at home.

Any community that wants to build a strong CSD should first focus on strengthening its restaurant niche through recruitment and start-up assistance.

Movie Theaters. Though they have passed the digital projection/distribution divide that threatened to put many of them out of business, downtown movie theaters remain vulnerable. They are still threatened by home and electronic device movie watching – that is how most movies now are viewed. More importantly, they are vulnerable to some influential Hollywood execs who, because theaters provide such a small slice of their overall revenues, want same day release of new films through the theater and purely electronic distribution channels. Goodbye first run theaters.

Cinemart Theater in Forest Hills, NY,, its restaurant’s outdoor dining, with Eddie’s Ice Cream shop in background

For most downtowns and neighborhood commercial districts, cinemas are important parts of their CSDs. They have fewer user frictions than many other kinds of entertainment venues. They have comparatively reasonable prices; are open afternoons and evenings almost every day, and present frequent showings through the day. They also occupy large spaces, usually in highly visible locations. Failed cinemas are hard to redevelop and can be terrible eyesores.

When they get in trouble, there is usually not a lot of time available to save them. Savvy downtown EDOs should have an action plan ready to go, should their cinema face closure. In dealing with the digital divide many communities used new tools such as community based businesses and crowdfunding to save their theaters. These tools can be used readily by other downtowns should the need arise.

Parks and Public Spaces. These are not just green or open urban spaces where people can retreat for quiet relaxation. They are also places that are great for that most fundamental of entertainments, people-watching.

Bryant Park, once a festering venue for drug use and drug sale is now an exemplar engine of economic growth

Great parks and public spaces also usually have infrastructures and equipment that allow guests, at little or no cost, to engage in a range of leisure behaviors. Among them are a pond for sailing model boats; a boules court; a ping pong table; chess and checkers tables; a carrousel and an ice rink. The resulting activities constitute performances that other people-watching visitors can observe and enjoy.

Ice skating rink in Central Park Plaza in Valparaiso, IN.

Great parks and public spaces also often have performance spaces for events such as movies, plays, dance recitals, concerts, lectures, etc. The smart ones use temporary stages, so the same spaces can be used for multiple purposes over the year. For many small and medium-sized communities, this is the most cost effective venue they can have for entertainment and arts performances. But public space programming is not (at least initially) self-generating and government or some other entity must have the capacity to book and produce public events.

DANTH, Inc.’s research has shown that well-activated parks and public spaces are usually much cheaper to build, maintain and operate than any of the formal entertainment venues. Most communities already have them in key locations. Even where they are absent, the cost of a new build is generally far less that of a new enclosed venue. They have, by far, a lower ratio of operating costs per visitor/user. They also have the fewest user frictions. Access is free. Use of their infrastructure and equipment is either free or very affordably priced. They are open all day and often well into the evenings almost all year. No one has to make an appointment to use them or buy a ticket in advance of their visit. Visitors can stay 10 minutes or several hours.

Furthermore, successful parks and public spaces have a proven ability to increase values for properties from which they can be seen – even those 480 to 800 feet high and about 0.25 miles away. They also have a proven ability to improve adjacent property values to levels equaling the costs of initial construction or later renovation.

Downtowns of all sizes can have such successful parks and public spaces.

Downtowns that want to strengthen their CSD functions should make sure, early on, that they have an attractive, well activated park or public space. They can be very popular and produce the best bang for the buck of any type of downtown entertainment venue.

One note of caution. The success of a park or public space has far less to do with how beautiful it is – though it definitely should be attractive – than with how it is programmed by its infrastructure, equipment and events and the people it attracts. Unfortunately, this is not widely recognized.

Posted in Central Social Districts, Crime, Deliberate Consumer, Downtown Niches, Downtown Redevelopment, downtown retailing, E commerce, Economci Development, Entertainment, Entertainment niche, fear of crime, Formal entertainment venues, Informal entertainment venues, multichannel retailing, New Normal, Planning and Strategies, Public Spaces, retail chains, Trends |

The Challenges Facing Suburban Downtowns With Trophy Retailers Under the New Normal©

Posted on October 31, 2016 by DANTH

By N. David Milder

Introduction    

This article is a follow up to:

  • “Some Key Aspects of the New Normal for Downtowns: some emerging challenges” which can be found at: https://www.ndavidmilder.com/2013/12/some-key-aspects-of-the-new-normal-for-downtowns-some-emerging-challenges
  • “The Changes in the Retail Industry That Are Impacting Our Downtowns” which can be found at: https://www.ndavidmilder.com/2016/09/the-changes-in-the-retail-industry-that-are-impacting-our-downtowns
  • “How Smaller Rural Downtowns Are Faring Under the New Normal’s New Retailing“ which can be found at: https://www.ndavidmilder.com/2016/10/how-smaller-rural-downtowns-are-faring-under-the-new-normals-new-retailing
  • “Downtown Retailing in Smaller Rural Regional Centers Under the New Normal” which can be found at: https://www.ndavidmilder.com/2016/10/downtown-retailing-in-smaller-rural-regional-centers-under-the-new-normal

Following the path of the last article, it also will explore how the changes in the nation’s retailing are manifesting themselves in different types of downtowns. The changes this article will look at again are:

  • The emergence of the deliberate consumer
  • Reduced demand for retail spaces
  • The growing strength of e-commerce
  • The continued growth of a broadly defined “value” category of retailers
  • The decline of traditional department stores and traditional specialty retailers
  • The uneven opportunities for small merchants

This time the focus will be on suburban downtowns that have the kind of prestigious retail chains that many downtown leaders, in both the suburbs and cities, very often crave or covet: Gap, Talbots, Starbucks, Victoria’s Secret, Williams Sonoma, etc. I will focus attention on a few of these downtowns that I know well, because I have visited them and/or previously done research about them. Between 1994 and 2000, I did several projects for the Englewood EDC and worked closely with its director, Peter Beronio. I’ve done one small assignment for Westfield’s Main Street program but, I researched in-depth the downtown’s retailing for two assignments I did for the neighboring town of Cranford. I’ve continued to visit Westfield over the years, because I found it to be so successful and interesting. For eight straight years I visited Wellesley, MA, about four times a year as my daughters attended college in the area. I last visited in 2008 and have tried to keep pace with its retail mix since then online. I will then compare these downtowns to downtown Morristown. In contrast, that district depends on successful smaller retailers whose prospects are enhanced by the downtown’s strong Central Social District assets. All four downtowns are among my favorites because of their scale, walkability and attractive establishments that provide food and drink.

The trophy retail downtowns, to varying degrees, are now being wounded by the very retailers that have previously made them strong: the traditional specialty retail chains. The strength and character of the demand for local retail space consequently has changed very significantly – not only do the landlords in these downtowns need to find different tenants, but they also must provide different kinds of spaces to accommodate them. The changing strength and presence of the major retail chains are also altering the array of problems local independent merchants have to face.

I suggest that many of the conclusions and observations I make below should be treated as hypotheses, since I cannot claim that they are based on a rigorous, wide reaching, systematic research effort. However, I hope that the discussion below convinces readers that I have done enough number crunching, field visits, personal interviews and analytical thinking to warrant my observations and conclusions being deemed worthy of serious attention and consideration.

Many of the old rules of the retail game are still in effect. Bad urban design and the lack of appropriate spaces can still thwart downtown retail health and growth. Also, the dynamics of constructive economic destruction can still mean that when some retailers falter in a market, others have the opportunity to enter and compete for that lost market share. When conditions change, downtowns need to develop appropriate adaptive responses – this is the biggest challenge now facing downtowns of this ilk.

Some Background on These Communities

Wellesley, MA. On my first trip to Wellesley in the early 1980s, as I walked along Central Street, I was first grabbed by a very attractive aroma that I traced to one of George Howell’s Coffee Connection locations. Inside, they were roasting coffees that smelled delicious and tasting them proved that they were. Howell is one of the best coffee bean selectors and roasters in the nation. He later sold his chain to Starbucks and his Wellesley location is today a Starbucks. Also, noted chef Ming Tsai has his Blue Ginger restaurant in this downtown.

demog-data-for-3-dts

After that terrific cup of coffee, I then quickly noticed that the downtown had an attractive scale, was very walkable and was filled with a mix of very attractive independent retailers, small regional chains and highly coveted national chains. I had never seen before so many prestigious retail chains in one suburban downtown.

Wellesley is most definitely a college town, but not a normal one, because it is also a very wealthy residential suburb of Boston and adjacent to a number of other wealthy suburbs. As can be seen in the above table, the average household income in Wellesley is about $237,462; for Wellesley and its abutting towns, the average household income is $188,239. These numbers are substantially higher than those for Westfield and Englewood, that, in turn, are also well above those for most other suburban communities. This affluence is reflected in the median value of owner-occupied homes in Wellesley, $914,000.

Wellesley College with its 2,344 students, has a definite impact on this downtown’s eateries and drinking establishments. The campus is within very easy walking distance of the downtown’s commercial core. While the research results I’ve reviewed recently suggest that college students nationally have significantly less discretionary funds available to them than they did in years past because of much higher costs for tuition, board and fees, my strong guess is that this is far less the case for Wellesley College students. For one thing, their costs for tuition, room, board and fees total $61,088 per year and only affluent households can afford those expenditures. While many of the students will get financial assistance, many of them will still come from households that have above average household incomes. Babson College, known for its entrepreneurship education, with about 3,000 students, is also in this town. It costs about $62,440/yr for a boarding student to attend. Additionally, within an easy walk of the downtown core is the Dana Hall School with its 356 female students in grades 9-12. Its annual costs are $40,116 for day students and $53,211 for boarding students.

Wellesley College provides many cultural-entertainment facilities: a movie theater, legitimate theater and art museum.

The strange thing is that so few of the retailers seem to focus on the students. Most of the apparel shops, for example, have been those that target an older demographic. The students seem more likely to shop in malls in Natick and Chestnut Hill.


wcs-entrance-gate

Entrance to the Wellesley College Campus on Central Street, downtown Wellesley.

talbots-wellesley-2015

On Central Street in downtown Wellesley, this is one of the largest Talbot’s stores I’ve ever been to.

According to the Census Bureau’s On-the-Map dataset, Wellesley has a significant number of people working there, with 16,813 having fulltime jobs. The presence of this many college students and employees means that there is a significant local daytime population for merchants to tap.

Total annual retail sales in Wellesley are fairly robust, about $432 million. The Natick Mall is 5.5 miles away, The Shops at Chestnut Hill are 7.7 miles away. Both remain powerful, with impressive lists of high quality retail tenants. They are among the small percentage of malls that are doing really well under the new normal and in sharp contrast to the retail malls in Rutland, VT, and Scottsbluff, NE, that I discussed in my last article.

There is a downtown merchants association, but the development of this district does not appear to have been impacted by any EDO or revitalization strategy. That speaks loudly about the strength of the community’s economic development related assets and healthy market forces.

Englewood, NJ. Of these three communities, Englewood is the one I know best having done many assignments there from 1994 to 2000.

Englewood is the most diverse of the three communities. About 45% of its population is white only. In comparison, both Westfield and Wellesley are over 85% white only.

englewood-trade-area

Englewood has a fairly high average household income, $115,679, and its trade area’s is $131,256. Its most affluent shoppers do not reside in the city, but in other parts of its trade area. However, its median income, at $73,249, is just 1.6% higher than that of the state. This points out that a lot of people, mostly of color, with relatively modest incomes, live near the downtown. However, Englewood also has had as residents some very successful people of color, such as Dizzy Gillespie, Eddie Murphy, George Benson, Nancy Wilson and Patrick Ewing.

This income divide was reflected for many years in how the downtown worked. An active railroad track ran through the heart of the downtown and “the other side of the tracks” along Palisade Avenue (the primary retail corridor) was a very meaningful term. The east side had many successful boutique shops and restaurants that successfully attracted upscale shoppers living up the hill in Englewood as well as from Tenafly, Alpine, Closter, Haworth, etc., (see the above map). The city has long had a sizeable daytime workforce, recently totaling about 14,708 fulltime jobs, but it’s eateries and merchants can also easily tap the 8,437 workers employed in major corporate offices located nearby on Rte 9W in Englewood Cliffs.

The west side of the downtown, however, was falling into increasing decline. Armory Street became the scene of much drug use and sale as well as prostitution.

palct-entrance

Entrance to Palisade Court in downtown Englewood

gpusachilplce2

Group USA and The Children’s Place on West Palisade Avenue. Both are now gone.

Around 1991, the city brought in Treeco, a local developer and land owner, to build an in-downtown shopping center, Palisade Court (see photo above). It was and is anchored by a large (now 60,000 SF) supermarket. While that center was successful, it failed to help revitalize the shops just steps away on West Palisade Avenue, because it was so inward looking. However, by 1996, a surge of new, highly desirable retail chains began to appear on East Palisade Avenue, e.g., Ann Taylor, Nine West and Starbucks. Within a few years the problems on Armory Street were cleared. Soon thereafter Group USA opened in its own new building on West Palisade, bringing in Mikasa with it. Group USA also brought in The Children’s Place, when Mikasa left (see photo above). Treeco, too, was actively recruiting quality new retailers and developing a substantial number of housing units. It would bring in Victoria’s Secret and New York & Company. By 2000, downtown Englewood was the success story of downtown revitalization in New Jersey, and leaders in many other communities wanted to emulate its achievements. It’s success was noted frequently in the media, including several articles in The New York Times.

The city of Englewood has very strong total retail sales, over $1 billion a year. A lot of that comes from its 11 major automobile dealerships, with most of them selling high value brands — such as Mercedes Benz, Lexus, Infiniti, Porche and Audi. They are strong regional draws. However, Englewood’s retailers potentially must contend with powerful malls: the Shops at Riverside is 4.3 miles away, the Outlets at Bergen Town Center is 6.1 miles away and the Garden State Plaza is 7.3 miles away. All of these malls were upgraded in recent years.

During its most successful years of downtown revitalization, Englewood had an extremely effective economic development team that included its mayor, the city manage, its community services director, its planner and the president of the city council. They were able to get the sustained support of most city council members and to develop consensus among these key decision makers about the strategy to pursue and the projects to build. Today, that team and the consensus about strategy and projects appear to be gone.

This downtown has the Bergen PAC, which was formally the John Harms Center. It draws a considerable audience to its many events. The downtown has no movie theater. Its restaurants have been strong, but now seem to be in flux. It also lacks a well-activated and popular public space.

The downtown’s retail revitalization has greatly benefited from having a capable developer, Treeco, and a very savvy commercial broker, the Greco Realty Group LLC, located in the city.

Westfield, NJ. I initially visited this downtown around 1995 or 1996 to do a small assignment for its Main Street program. I was then impressed, because I found another of George Howell’s Coffee Connections there. Ever since, when I think of one of these two towns, I inevitably also think of the other. A year or two later, I had to take an in-depth look at Westfield’s retailers as I researched for a retail revitalization strategy DANTH was developing for the Cranford Downtown Management Corporation. By then Starbucks had replaced the Coffee Connection, and the downtown had a growing number of important retail chains. The presence of a real department store, Lord & Taylor, had long given this downtown a key recruitment asset. Some of those retailers were regional chains that fell victim of the dot.com economic downturn, but they were soon replaced by a trend of more and more high quality specialty retail chains.

gap-westfield

The Gap in downtown Westfield. This chain is harder and harder to find in suburban downtowns – photo from Google Maps

By around 2007, when I again had to study downtown Westfield’s retailers. Its cluster of highly regarded national retail chains reminded me of a lifestyle mall, but one without a common ownership.

Westfield long has had lovely homes and great schools. Recently, it acquired a direct commuter rail connection to Manhattan. Consequently, it is an even more highly desirable residential community than ever before. It’s population is well educated – 66.4% have a B.A. degree or higher. The average household income is $187,669/yr, and the average for Westfield and it surrounding communities together is about $152,000/yr. Westfield’s median household income is $138,165, so a substantial majority are probably in the $100,000+ bracket. That affluence is reflected in the median value of owner occupied residences in Westfield, $653,900.

anntaylorwestfield

Ann Taylor in downtown Westfield. In the 1990s, this chain stood out for its interest in suburban downtown locations. Today, it looks very closely at such locations.

One thing that downtown leaders elsewhere should take away from this discussion of Wellesley, Englewood and Westfield is that if they want to attract “trophy retailers,” they better have an awful lot of households with incomes above $100,000/year – over $200,000 would be better still.

Total annual retail sales in Westfield is the lowest of the three communities being looked at in this article, at $262,436,000/yr. Of course, over a quarter of a billion dollars in sales is far from shabby in anyone’s book. The nearest major mall, the very powerful Short Hills Mall, is about 8.9 miles, or about an 18-20 minute drive, away. There also is a substantial amount of retail strung out along the nearby Rte 22 corridor, but those retailers are not of the kind likely to compete with the ones in downtown Westfield – those in the Short Hills Mall are. On the positive side, the distance between downtown Westfield and Short Hills means that some retail chains could consider having stores in both locations. That is not the case, for instance, with Maplewood and Morristown; both have been basically shunned by major retail chains because of their proximity to Short Hills. I think that factor helps explain why Westfield attracted so many of the highly coveted specialty retail chains.

Of the three communities, Westfield has the fewest people working in the community, 9,281.

This downtown has a movie theater. It lacks a well- activated and popular downtown public space. It does have about 50 restaurants, and many are highly rated and been around for a long time. Its inventory of fast food restaurants includes a lot of today’s most popular with Millennials: e.g., Panera Bread, Chipotle, and Five Guys.

papyrus-westfield

Papyrus is in all three of the downtowns under discussion.

Downtown Westfield probably has the smallest daytime population of the three communities. It has really depended on the repute of its large cluster of high quality retail chains to generate daytime customer traffic. The rents close to the strongest of these popular retail chains will be significantly higher than spaces farther away from them. Independent merchants are thus caught between wanting to be close to these strong retail attractions and having to pay the higher rents to do so.

Westfield also has benefited from having an effective local commercial brokerage community and a well-run, nationally recognized Main Street program that also manages a SID.

What Happened

retail-chains-in-three-downtowns

As was explained earlier in this series of articles, specialty retail chains have been facing increasing competitive pressures since the end of the Great Recession. A good number have gone bankrupt. Many others are struggling, closing many stores and trying to establish a more effective online presence. Consequently, it is not surprising that these three downtown have seen the flight of many of their prized national retail chains, though to significantly varying degrees. This flight has posed a number of challenges, some old, others new. Most importantly, it poses the challenge of formulating an effective strategic response.

The Extent of Retail Chain Closings. The above table lists the major retail chains I could identify that are now present in each of these downtowns as well as those that have left in recent years:

  • Englewood, NJ: A total of 19 major retail chains were at one time located in Englewood since 2008. Eleven, 58%, have left. Seven of the 11 sold apparel. Eight of them remain.
  • Westfield, NJ. This downtown attracted a total of 34 major retail chains, of which 14, or 41%, closed. Nine of the 14 sold apparel of one kind or another. That still leaves the downtown with an impressive array of 20 national retailers that includes: Ann Taylor, Banana Republic, GAP, Lord & Taylor, Urban Outfitters, Victoria’s Secret, Williams Sonoma and Trader Joe’s.
  • Wellesley, MA. Of the 17 retail chains that I was able to identify as having a downtown Wellesley location during this time period, five, or 29%, closed. Of the five, three sold apparel of some sort. 12 of the retail chains remain downtown. However, a local newspaper article provided information that suggests that in this downtown, the small independents and small chains may have been the worst hit by the new normal’s tougher environment for retailers. For example, Kaps, a four-location menswear chain, closed down. A good number independents also reportedly closed or moved to new locations that had lower rents and good proximity to the customer traffic generated by the Natick Mall.

Why They Closed. First, in absolute numbers, the more national chains a downtown had, the more it was likely to lose them: Westfield 14 of 34; Englewood 11 of 19, and Wellesley 5 of 17.

Also, in these three downtowns, the percentage of retail chain closures seems to be associated with the affluence of their potential customers. Wellesley and its surrounding towns have the most affluence, and that downtown has the lowest percentage of retail chain closures. Englewood and its trade area have the lowest household incomes of the three communities (though averaging over $100,000), and the highest percentage of chain closures. Might other downtowns, with even less affluent trade areas face even more retail chain closures? The sample size of three is admittedly miniscule, but this finding, when added to other pieces, begins to paint a picture worthy of serious consideration, if not of certain acceptance.

Tony Schilling, of Relocation Realty, is a very savvy commercial broker based in downtown Westfield. He has helped put many major retail chains in New Jersey downtowns, including several in downtown Westfield. He has been involved in the selection of 30 Chico’s store locations. He reports that the chains in downtown Westfield told him that, since the Great Recession, they saw a serious drop in customer traffic and spending. This, of course, is consistent with the Great Recession induced emergence of deliberate consumers, whose geographic presence and intensity diminishes as incomes rise.

Tony also pointed out that the situation for retail chains in downtown Englewood was probably worsened by the strengthening of the nearby malls. They not only may have taken away customers, but they also could take away retailers. For example, Gymboree closed in Englewood and opened in a nearby mall. While many malls are failing, and more are struggling, others in the best locations are adapting to the new conditions and doing quite well. The malls that these three downtowns compete with fall into that category.

Also, a few years ago, a top level executive managing the retail related business of a major national real estate brokerage firm, told me that the sales of the national retail chains in downtown Westfield were not as high as their stores in successful retail malls and that this was also true of most other suburban downtowns where they are located. This, unfortunately, means that these downtown chain stores are liable to be on the chopping block should their corporate masters face very rough waters.

A few downtown managers I’ve communicated with recently tried to explain away the closing of a retail chain in their district by stating it was a corporate problem. In my opinion, that avoids some important truths. As can be seen in the above table, few of the store closings were the result of a corporate bankruptcy. What usually has happened is that the parent corporation finds itself in serious trouble and, in trying to right itself, decides to close its poorest performing stores. The performance of that store may have something to do with the chain’s corporate strategy – e.g., its products are targeted for a market segment that is aging out, becoming fewer in number and buying less. It also could be that the demographics of the store’s trade area or its daytime popualtion have changed and have fewer of the kind of customers that a retailer is focused on. It’s essential that downtown leaders know what’s what on this score and not flippantly ascribe retail chain closures to just corporate problems.

According to Tony, many of the retail chains in downtown Westfield report that they and local independents are being badly hurt by the growth of e-commerce. Some of these chains, e.g., Chico’s, are trying to create a stronger online presence. If that is their strategy for the future, then their return to downtown locations is not likely to any significant extent. Such a return would also probably be based on significant use of a “click to brick” strategy where shoppers order online and pickup their purchase in a downtown store. In turn, that probably would reduce the retailers space requirement. Theoretically, if their sales transactions are so online driven, it could also reduce their need for prime geographic locations.

Some Important Fallouts of These Closures. Obviously, when retail chains close, vacancies are created. If a good number of these closings cluster in time and geography, the problem can be very serious indeed. Another problematic aspect of such a situation is that, unless another chain with a large space requirement can be found, it probably will be too large and its rent will be too high for most independents to lease.

Moreover, according to Tony Schilling, the retail chains that are now looking for new downtown locations want much smaller spaces than years ago: 1,800 SF to 2,500 SF instead of 5,000 SF to 7,500 SF. This creates a serious problem for landlords of the larger spaces that will need to be divided, with the smaller spaces being leased separately. This all jives with reports on the national level that retail chains are looking for smaller spaces, and I find it enlightening to see what that means on a local level. For downtown Westfield, and its landlords it also may mean that a significant amount of today’s retail space will have to be converted to other uses.

Because the major retail chains are such important traffic generators, when their numbers are greatly reduced that makes the downtown a less viable location for the remaining chains as well as for small merchants. That appears to have happened in Englewood according to the owner of a small retail chain with a store in that downtown, and Tony Schilling says it also has happened in Westfield. I think downtown Wellesley has been better able to absorb its closures shock, with the least reduction in daytime customer visits, because it had fewer closures and the district has so many other assets going for it.

The entry of major retail chains into a downtown usually is associated with a significant rise in retail rents. Tony Schilling reports that, at least in downtown Westfield, the reverse can also occur. According to him, retail rents there are now about 20% lower than they were before the Great Recession and the ensuing flight of many retail chains.

For small merchants, the situation is a two edged sword: they may find they are paying lower rents, but the major retail chains are pulling fewer shoppers into the downtown.

How Can Such Downtowns Successfully Adapt to the New Retail Conditions?

In my opinion, this is now a key question for downtown Englewood and downtown Westfield. The following are some broad strategic options they might consider.

  1. Keep going after traditional chains. If downtown leaders do nothing, this is their default strategy, which now is metaphorically akin to continually butting their heads against a stone wall.
  2. Go after emerging and growing chains or those that like smaller cities. One of the most interesting things I have recently observed in my research and travels through NY, NJ, MA, VT and CT is the number of small chains that have recently opened downtown stores. Some of them that opened in Westfield and Englewood are listed in the above table at the very bottom. Additionally, there are many retail chains that feel quite comfortable in cities with populations of 15,000 to 35,000, such as Maurice’s and Francesca’s, though they often tend to prefer shopping center locations over those in downtowns.
  3. Develop strong retail niches. Back in the early 1990s, downtown Englewood had a very strong niche of women’s apparel boutiques clustered closely together on North Dean Street and West Palisade Avenue. Its success helped convince the national chains about the viability of locations in downtown Englewood. Today, after many of its national apparel chains have closed, a rejuvenated women’s apparel niche has emerged, primarily in the same Dean Street and West Palisade area. It now has 24 boutiques, five of which belong to small chains. Savvy local commercial brokers are recruiting to this niche. A niche marketing program run by the Englewood EDC would probably have a high ROI. Other downtowns should consciously try to develop such niches. They can attract considerable customer traffic that helps keep the downtown active, retail sales flowing, property values strong and town tax revenues from declining.
  4. Economic gardening to seed and nurture high quality small independent retailers. This is an approach that the vast majority of downtown EDOs run quickly away from, because it is very tough to execute and hard to get a meaningful ROI. However, over the recent years, as I’ve tried to wrestle with how downtowns in rural and suburban areas can leverage growing contingent worker workforces, I’ve become convinced that they need to tap some meaningful economic gardening capability, whether it is in-house or in another organization. Perhaps a very focused problem-solving approach would make them more effective and easier to operate. For example, of the 24 boutiques in Englewood’s women’s apparel niche, less than one-third had any meaningful internet presence. In general, many non-Millennial retailers still need to become more agile on the Internet and able to use the social media effectively. A program to help them could have considerable impact.
  5. Develop a “quality of life” retail recruitment program. I hope to write an article about this soon. On my recent trip to VT, I found two retailers who had moved to the Rutland area because they liked its quality of life and then opened women’s apparel stores in its downtown. Years back, I met the former road manager of Pink Floyd, who had opened a housewares store in downtown Woodstock and then a restaurant in downtown Rutland. Around then, I also met in Rutland three people born and raised in the NYC metro area, but now lived in Vermont, while having successful telecommunications enabled careers managing an investment fund, being a computer graphics specialist and being a business consultant. I’ve read about a chef who went to meet his new in-laws to be, then living in a retirement community west of Phoenix, and he liked the area so much that he then decided to stay and open a restaurant there. I’ve also read about creatives living in Brooklyn, NY, who started to summer in the Catskill Mountains and then opened hotels, restaurants and shops up there. As Phil Burgess, president of the Annapolis Institute, has noted, lots of folks once they pass 50 years of age “reboot” their lives and careers. I am confident that rebooters are also moving to our suburbs that offer a high quality of life. Some may also want to open a shop or a restaurant.
  6. Accept the potential economic value of “pamper niches” and leverage them.  DANTH,Inc has found that pamper niches composed of hair and nail salons, spas, martial arts studios, yoga and Pilates studios, and gyms were important components of the street level business mixes in such diverse places as downtown Beverly Hills, CA and Bayonne, NJ. They attracted lot of patrons with money to spend and their shops do not create pedestrian discontinuities. Too many downtown leaders still have rather snobbish attitudes towards operations in this niche. The reality is that, in many downtowns, pamper niche operations are filling storefronts vacated by retailers. Sometimes, it’s better to try to leverage them than opposing them.
  7. Go after the value retailers as downtown Rutland did, but be sure to take care of key urban design issues. Some retailers are doing quite well these days. They are the “off-pricers” such as TJ Maxx and its sister brands, Ross Dresses, Stein Mart and Century 21 department stores. Downtown Rutland showed that having them and big box retailers can produce significant positive benefits for small merchants. However, that positive impact could have been far greater, if the Rutland Plaza project has been designed to be better integrated into the downtown core. That would have allowed local merchants to win a lot more cross-shopping from the Plaza’s patrons, while maintaining the downtown’s walkability.
  8. Reduce the strategic emphasis on retail. Instead develop and strengthen central social district (CSD) entities. In my 40 years of trying to help downtowns revitalize, I cannot count how often local political and community leaders wanted, more than anything else, strong retail to appear in the form of new department stores and/or a cluster of national chain stores. However, the truth of the matter was that few of these downtowns ever before had the type of retail they were aspiring to. Perhaps, in their “Golden Age,” they had had a small local department store and some well-known and well-regarded independent operators, that socio-economic forces had recently weakened, but very, very few had a branch of a major national department store chain or scads of national specialty retail chain stores. The latter did not even exist to any large degree during those hallowed golden years. This suggests that a vibrant, popular and economically healthy downtown does not equate with just an overwhelmingly strong retail base, but that a number of other factors may be as or even more important to a downtown’s success. Indeed, it even can be argued that, especially today, the health of a downtown’s retailing is more and more dependent on the strength of these other factors. Today, in downtowns across the nation and in communities of all sizes, CSD functions are increasingly important to their sense of vibrancy, economic well-being and municipal tax revenues. CSD functions facilitate people coming downtown to have enjoyable experiences with their friends and relatives or with new people that they meet there. Entities that perform CSD functions are wide ranging: e.g., vibrant and popular public spaces, libraries, churches, senior centers, community centers, restaurants, watering holes, hotels, entertainment and cultural venues, downtown residential units, etc. See: https://www.ndavidmilder.com/2016/02/central-social-districts

Downtown Morristown.  This district is a great example of a strong CSD and its importance. Although the town has annual retail sales around $520 million, it has not attracted anywhere near the number of prestigious national retail chains that have located in Englewood, Wellesley and Westfield. For years a former department store stood vacant. In the early 1990s, there was a strong feeling among community leaders that the downtown was in decline. Making matters worse was the fact that this downtown was surrounded by a very large amount of competing retail. The very powerful Short Hills Mall is close enough that any chain located there cannot be located in Morristown. Back in 2010, I came up with a very long list of specialty retail chains and noted their presence and distance from downtown Morristown. Everyone one of them was within a distance that would mean a new Morristown location would cannibalize sales from their nearby existing store.

Today, this downtown is vibrant, attractive and often cited as a model for suburban downtown revitalization. Morristown does not have a large population, about 18,500, and its median household income, around $76,000,is only slightly above that of the state. However, its primary trade area had a population in 2010 of roughly 99,000 and a median household income near $122,000. Its total trade area’s population was over 220,000, with income levels similar to that of the primary trade area. About 61% of the primary trade area’s households have incomes of $100,000+. Almost 60% of the trade area’s residents have a B.A, degree or higher. An even stronger retail development asset is downtown Morristown’s daytime population. There are about 23,000 fulltime jobs in Morristown. Most impressively, the downtown has attracted 1,500+ new market rate residential units It also has 77 eateries and watering holes with combined  sales of $79 million+/yr. Its Community Theater has about 230 performances annually with a reported attendance of 200,000. Its 10 screen cinema has an attendance estimated at 360,000/yr. The district’s three major hotels have an estimated 196,000 hotel guest days/yr. The Morristown Green is the venue for many major events that attract crowds of people downtown. DANTH’s estimates that the downtown spending potential of nearby office workers, new residents and high school students totals over $132.9 million/yr and that the hotel guests probably add another $9 million just for their restaurant expenditures.

Since so many of the specialty retail chains in Englewood, Wellesley and Westfield sold apparel, it’s interesting to look at the size and composition of downtown Morristown’s apparel niche. It has 23 stores in a broadly defined apparel niche that includes women’s clothing, but also menswear, 2 bridal shops, uniform and tuxedo shops, three national chains and three small regional chains. This diversity makes it less vulnerable to industry and national economic vicissitudes. Two of the national retailers, Athleta and Jos. A. Bank, are also found in one or more of the three other downtowns under discussion. However, the Century 21 department store in downtown Morristown is of special interest because it is a high end “off-price” operation. This is one of the kinds of retailing that is now doing well nationally. Century 21 also shows that such a large store can be inserted into a downtown without disrupting its walkability or attractiveness, if the appropriately sized space already exists – or can be developed.

© Unauthorized use is prohibited. Excerpts may be used, but only if expressed permission has been obtained from the author, N. David Milder.

Posted in Business Recruitment, Captive Markets, Central Social Districts, Deliberate Consumer, Downtown Merchants, Downtown Niches, downtown retailing, E commerce, Economci Development, EDOs, Entertainment niche, Formal entertainment venues, Informal entertainment venues, movie theaters, multichannel retailing, New Normal, Pedestrian traffic, Planning and Strategies, Public Spaces, retail chains, Small Merchants |

Downtown Retailing in Smaller Rural Regional Centers Under the New Normal

Posted on October 18, 2016 by DANTH

By N. David Milder

Introduction    

This article is a follow up to: “The Changes in the Retail Industry That Are Impacting Our Downtowns” which can be found at:  https://www.ndavidmilder.com/2016/09/the-changes-in-the-retail-industry-that-are-impacting-our-downtowns  and “How Smaller Rural Downtowns Are Faring Under the New Normal’s New Retailing“ which can be found at: https://www.ndavidmilder.com/2016/10/how-smaller-rural-downtowns-are-faring-under-the-new-normals-new-retailing

Following the path of the last article, it also will explore how the changes in the nation’s retailing are manifesting themselves in different types of downtowns. The changes this article will look at are:

  • The emergence of the deliberate consumer
  • Reduced demand for retail spaces
  • The growing strength of e-commerce
  • The continued growth of a broadly defined “value” category of retailers
  • The decline of traditional department stores and traditional specialty retailers
  • The uneven opportunities for small merchants

This time the focus will be on downtowns in Smaller Rural Regional Commercial Centers. Again, I will focus attention on a few that I know well, because I have visited them and previously done research about them. These downtowns or the communities they are embedded in have seen the substantial decline of traditional department stores and/or traditional specialty retailers and/or the retail malls that depend on such tenants.

I suggest that many of the conclusions and observations I make below should be treated as hypotheses, since I cannot claim that they are based on a rigorous, wide reaching, systematic research effort. However, I hope that the discussion below convinces readers that I have done enough number crunching, field visits, personal interviews and analytical thinking to warrant my observations and conclusions being deemed worthy of serious attention and consideration.

Many of the old rules of the retail game are still in effect. Bad urban design and the lack of appropriate spaces can still thwart downtown retail health and growth. Also, the dynamics of constructive economic destruction can still mean that when some retailers falter in a market, others have the opportunity to enter and compete for that lost market share. If retailers are not open when people want to shop, then sales will be lost.

Downtowns in Smaller Rural Regional Commercial Centers

These small cities are among the most interesting for seeing how the effects of the new retailing are playing out. Rural cities, they usually have populations in the 12,000 to 30,000 range, but have addressable trade area populations of roughly 70,000 to 120,000. Their trade areas can extend to between 30 and 120 minute drive sheds. Their combined financial, government, health care, cultural, entertainment and retail assets give them sufficient magnetism to penetrate such large geographic areas. Sometimes they also benefit from strong tourist traffic. To penetrate these geographically large trade areas, they attract the kinds of retail entities that cannot be easily incorporated into a downtown – malls, big box stores and power centers. The size, magnetism and proximity of such strong retail entities in the community usually places their downtown’s GAFO merchants under substantial competitive pressure. However, substantial opportunities for successful downtown retail niche development can remain. To realize those opportunities, the downtowns in these small rural regional commercial centers will need to strongly develop their central social district functions, especially by developing a significant amount of nearby housing and creating strong entertainment niches, especially ones containing vibrant, well-activated public spaces.

I have researched two of these rural regional commercial centers, Rutland, VT, and Scottsbluff, NE. Their retail development has followed fairly similar courses over recent decades. More attention will be paid to Rutland, because I know it better, having done two major projects in the 1990s for the Downtown Rutland Partnership. I have followed events since then and recently visited Rutland.

Over the years, I have concluded that these small rural regional centers do not get the attention and respect they deserve as economic entities. As can be seen in the above table, although the populations and household incomes of Rutland and Scottsbluff are dwarfed by those of three eastern suburbs known for their large numbers of trophy retail chains, the annual retail sales of the small rural cities compares quite favorably with those of the more prestigious eastern suburbs. They certainly are not retail weaklings.

These two rural cities have similar income and education levels (see the table below). Their populations are similar, too, though Scottsbluff has an adjacent twin city, Gering, and they have a combined population that is 46% larger than Rutland’s. Their trade area populations and household incomes are also basically similar. However, they differ quite a bit on tourism. Except for “mud season” in early spring, Rutland has a variety of tourist streams year round, e.g., three major ski resorts are within a 30-minute drive, and loads of “leaf peepers” pass through in the Fall. About 2 million tourists come through the city annually. Scottsbluff has a far more modest tourist flow.

Both have relatively old and small (under 400,000 SF) enclosed retail malls that today have significant vacancies and lost most of their anchor department stores. Both malls also have had ownership problems and changes. In smaller cities during the 1970s to early 1990s, Sears, JCPenney and Kmart often were the retail mall anchors, as they were for the Monument Mall in Scottsbluff and Diamond Run Mall in Rutland. Sears, at one time, was the largest retailer in the USA. Monument lost Walmart back in 2000 and more recently lost Sears and Kmart; Diamond Run has lost Sears and JCPenney. These older department store chains were in decline before the Great Recession and were further weakened by it. Many retail experts are expecting Sears – it also owns Kmart – to disappear any day now.

retail-chains-scotts-and-rut

While Monument Mall has the stronger remaining anchor, a Hersberger’s department store (a subsidiary of Bon Ton, itself a financially troubled department store chain), Diamond Run has the better known specialty retail chains, e.g., Old Navy, Victoria’s Secret and Eastern Mountain Sports.

Overall, Rutland has more retail chains that are also to be found in larger cities and metropolitan areas, while Scottsbluff has more chains that feel comfortable in smaller cities, e.g., Maurice’s, Murdoch’s, Rue21, Buckle, Hibbett Sports, Dunham’s Sports etc.

Both cities have loads of value-oriented big box retailers. They both have a Walmart — though Rutland’s is not a super store –- and a Home Depot. Scottsbluff also has a Target and a Menard’s, while Rutland has a Dick’s Sporting Goods, Michael’s and Bed, Bath & Beyond. Rutland has two 60,000 SF+ supermarkets – Price Chopper and Hannaford – as well as an Aldi. Rutland also has an off-price TJ Maxx that has been going strong for over 20 years.

In Rutland, the years between 1998 and 2007 saw the opening of many of its strongest retailers, e.g., Home Depot, Dick’s Sporting Goods, Michael’s, etc. They greatly strengthened the retail power of the Routes 4/7 corridor that is well outside the downtown’s retail core. When the recession hit in 2008, many downtown independent merchants were hurt and closed. As the recession ebbed, the downtown’s Rutland Plaza Shopping Center saw its movie theater change operating companies, and it attracted Dollar General, Sleepy’s and Payless as replacements for struggling tenants. (This is what good ownership does.) The attraction of national chains to other parts of the city basically stopped until 2013 when the Aldi opened. Since then a few chains have come in, such as Ashley Furniture. A BJ’s entered in negotiations for a site in 2016, but the deal fell through – because of permitting issues, not because BJ’s doubted the strength of the Rutland retail market. The interest of national retail chains has definitely ebbed. Those interested tend to offer low prices and/or value pricing.

Scottsbluff, its county and its state were among those least impacted nationally by the Great Recession. Nonetheless, Monument Mall continued to weaken and the recruitment of major retail chains ebbed. One sign of its current plight: it recently recruited a business from Scottsbluff’s downtown.

Scottsbluff’s downtown is basically about a half-mile portion of the Broadway corridor. With state money, the city has made a number of physical improvements to the area. Its strengths are its historical features, including the Midwest Theater, nearby office buildings, and a number of independent retail operators who have been around for some time and are effective destination stores. Eateries are another of its strengths as is its seasonal Farmers Market. It does not have any major retail chains. Its sidewalks usually appear to have little to no pedestrian traffic. It has not recently attracted any significant amount of residential development. It also lacks a well-activated and frequently used public space.

the-pit-39-wales-st-google-maps-copy

“The Pit” parking lot in downtown Rutland, sometimes used as an event venue. It is said to have very good acoustics.

Downtown Rutland is larger and not linear. It, too, has a major restored theater, the Paramount Theater, that is financially successful and draws 50,000+ patrons annually. Many other elements of a downtown entertainment niche are also present: numerous eateries and bars with live music; a children’s museum; art galleries and a movie theater. The Farmer Market is the biggest in VT and runs year round. It attracts many hundreds of shoppers on Saturdays. Additionally, downtown Rutland has a major transportation center and an Amtrak station. It also has seven banks and four financial services companies, City Hall and state offices and courts. A community college is also located in this downtown and Castleton University has established a major presence in the district. As in downtown Scottsbluff, its sidewalks usually appear to have little to no pedestrian traffic and it, too, has not attracted any significant amount of residential development, though Castleton University has turned two floors of a major building into student housing. It also lacks a well-activated and frequently used public space where people can simply sit and enjoy being outdoors as well as gather for events. For example, the Downtown Rutland Partnership currently uses, according to its website, the Rutland Theater, Depot Park, “The Pit” parking lot and the top level of a downtown garage to hold its events.

Rutland differs from Scottsbluff in a very important way – back in the mid 1990s, the downtown’s Rutland Plaza shopping center was intentionally revitalized by bringing in Walmart, Price Chopper, TJ Maxx and a multi-screen cinema. The Downtown Rutland Partnership, under the leadership of Dick Courcelle, strongly backed this approach. Its strategic reasoning was that it was better for these two superstores (Price Chopper and Walmart) to be located downtown, where local merchants could have a chance of attracting their shoppers, than to have the superstores situated farther away where local merchants would have no such opportunity. It was also thought that the Plaza, thus strengthened, would help other downtown merchants compete with the then new Diamond Run Mall.

In 1997 – 1998, DANTH, Inc. conducted an intensive study of how the Plaza’s superstores impacted the downtown merchants located outside of that shopping center. I published an article about our findings in Urban Land (see https://www.ndavidmilder.com/wp-content/uploads/2012/05/superstore.pdf ) . Our research accessed a downtown shoppers intercept survey that had over 1,300 respondents, a trade area telephone survey that had 465 completed interviews, and a survey of downtown merchants supplemented by numerous in-depth, face-to-face interviews with local merchants.

Our major findings were:

  • Most downtown merchants located outside of the Plaza felt that their sales had increased since the Plaza had been revamped and that many more shoppers were to be seen walking along downtown streets. Also, about 90% felt they offered unique products and services that did not compete with those offered by the Plaza’s new stores. However, among those feeling most threatened by the new Plaza shops were the operators of the apparel shops. Worrisome was the finding that over half of the downtown merchants felt that they were not getting as many of the Plaza’s new shoppers into their stores as they wanted
  • The intercept survey showed that there was considerable cross- shopping among the Plaza’s stores – e.g., over 62% of Walmart and Price Chopper shoppers shopped in other Plaza stores on the same shopping trips.
  • However, only about 21% of the Plaza’s shoppers also shopped in downtown stores located outside of the Plaza.

xwalk01

The Walmart is at least 430 feet away from other shops in Rutland’s downtown retail core

  • Our analysis indicated that the primary reason for the lower cross shopping rate with shops located in the downtown’s old retail core was that the Plaza’s in front parking lot constituted a huge pedestrian moat. “The distances between the shops in Rutland Plaza and those just across the street vary between 430 and 848 feet; Plaza shoppers therefore must be strongly motivated to walk such distances. (See photo above). Walking is difficult because it is not easy to quickly traverse the intervening Plaza parking lot—and it is made even more difficult by Rutland’s long winters.”
  • The single most important factor that influenced Plaza shoppers’ decisions about visiting other downtown shops outside the Plaza was whether they planned on eating downtown while on their shopping trip. This factor was at least twice as strong as their knowledge of downtown stores or if they liked the merchandise, customer service or uniqueness of those stores (see table below). Ever since, this finding has strongly shaped my approach to downtown retail revitalization, because it indicated how important restaurants and opportunities for social interaction are to retail success. This is a view increasingly held by major developers and retail chains. For instance, Apple’s Angela Ahrendts has recently said that Apple’s stores should become more like town squares (https://in/d88XcR9 ) .

rut-t-2

  • The trade area telephone survey found that the strongest factor for explaining how often respondents visited downtown shops located outside of the Rutland Plaza was how often they visited the Plaza. This means that without the Plaza or with a diminished Rutland Plaza, the shops in the traditional downtown core would have many fewer shoppers, especially those with longer driving times.
  • The telephone survey also showed, quite surprisingly, that even after the Rutland Plaza brought in TJ Maxx, Fashion Bug and Poore Simon’s and Diamond Run Mall brought in department stores and specialty shops, trade area residents were more dissatisfied with the trade area’s apparel shops than any other types of retailers. Our analysis also showed that those with more comfortable incomes were prone to be most dissatisfied.Looking at more recent times, those findings suggest that the stressors causing small downtown merchants to close during and after the Great Recession probably were not either the retail chains located in the Rutland Plaza or the new big boxes that opened on the Routes 4/7 corridor. Most of the latter also sell merchandise that does not strongly compete with the offerings of downtown merchants. The more likely causes of those closings were the significantly decreased demand generated by the emerging mass of deliberate consumers and the already weak competitive capabilities of these failing merchants that resulted from a weak financial condition, an inability to adapt to new conditions and/or a poor set of merchant skills.

    I would argue that today, even with the growth of e-commerce, in both Rutland and Scottsbluff, there are substantial opportunities for savvy independent downtown retailers to find the parts of the retail bed the 800 pound value-oriented/low price retail gorillas are not occupying and to consequently have considerable success. Additional market opportunities are being provided by the weakness of their malls, department stores and traditional specialty retail chains. Also, independent small merchants typically can survive on a lot fewer annual sales dollars than is needed by a major retail chain store. But, and this is an important but, the independent merchants must be competent to benefit from such opportunities.

    The apparel shops I saw in downtown Rutland on my recent visit indicate that to some extent these opportunities now are being realized. One operator has opened two women’s apparel shops on Merchants Row since about 2011. A small chain selling outdoor clothing and equipment opened – even in face of competition from the local Dick’s Sporting Goods and Eastern Mountain Sports. It has two other locations in VT and NH. They show that smaller retailers are seeing significant opportunities. The closing of Sears and JCPenny lso has opened opportunities in the men’s clothing market. However, given the current track record of small men’s apparel shops, an existing men’s store that has survived the Great Recession is probably better positioned to capture some of the surrendered market share than a new entrant.

    These apparel merchants are also using the Internet, though some have much more sophisticated uses than others. Of the eight apparel shops located outside of Rutland Plaza, seven have websites and seven have Facebook pages. All are somehow present on the Internet. Notably, only one has an e-store where purchases can be made online. Two use their websites to really push their customer services by offering personal shopper assistance and home visits.

    Also worthy of note is that two of downtown Rutland’s eight apparel merchants are parts of small regional chains that have three to nine locations. These shops are not under “newbie” operators and have a greater likelihood of success. Downtown Rutland’s core lacks the available 3,500+ SF retail spaces that might enable it to recruit the types of retail chains that feel at home in smaller cities. Scottsbluff’ has attracted many of them them, but not to its downtown.

    One major reason that small merchants in both of these downtowns have not had still greater success is that by themselves they lack sufficient magnetism for drawing a lot more people. If these two downtowns could attract more people, they would have more potential shoppers, have more successful retailers and attract better retailers.

    Over the past two decades, downtowns of all sizes across the nation have come up with two successful tactics to attract more people downtown. More downtown housing has proved to be very helpful because it creates a captive market of people who want a wide range of activities to engage in – shopping, dining, being entertained, recreating, etc. — within easy walking distance of their residences and their impacts are amplified by their friends and relatives who visit them. In my opinion, both downtown Scottsbluff and downtown Rutland would benefit greatly from a significant amount of housing being located in or near (e.g., within a 10-minute walk) their districts. In my discussions in various rural cities over the past decade, I have heard the following reasons cited to explain why downtown housing was impractical in their communities:

    • The unavailability of appropriate sites
    • The general low level of housing demand
    • The lack of specific demand for condo apartments and townhouses because they are somewhat alien to residents of rural areas.

    It can be argued that if local leaders are aware of the potential benefits of such housing and prepared to act, the above concerns most probably can be successfully addressed with arguments along these lines:

    • Sites on the fringes of the district, within a 5-minute walk, are probably easier to find and cheaper to build than those within the district, but they still make it easy for residents to walk downtown
    • The growing senior popualtion is increasingly active and many are looking to downsize to easier to maintain smaller residences. Scottsbluff already has been attracting many retiring ranchers and farmers. Many of the seniors would enjoy the close proximity of restaurants, shops, cultural and entertainment venues and professional offices.
    • The young people who are leaving these communities are often going to other cities that have a lively downtown with lots of nearby apartments and townhouses.

    Many downtowns have also found that strong, broadly defined entertainment niches can bring many new visitors downtown on a sustained, long-term basis. Both downtown Scottsbluff and especially downtown Rutland have elements of such a niche. However, my sense is that the impact of their entertainment niches on downtown retailers has not been as strong as it could be. In Rutland, that certainly has not been for the lack of trying or even for a lack of important successes. The Downtown Rutland Partnership along with the Rutland Development Authority and other civic groups worked long and hard to successfully redevelop the Paramount Theater and to encourage the attraction and development of the art galleries and children’s museum. The owners of the Rutland Plaza succeeded in getting a new operator for its movie theater at a time when quality operators had become much harder to find. The Famers Market has developed into a strong regional draw, though it only operates on one weekend day.

    There are definitely things to do in downtown Rutland after dark – and that may be part of the problem. Most of the customer traffic to two of its strongest entertainment niche elements, the Paramount Theater and Flagship Cinemas probably comes when most small independent retailers are closed, i.e., in the evenings and on Sunday afternoons. The children’s museum, art galleries and Farmers Market are certainly assets, but they target rather specialized interests or have limited operating hours. What seems to be missing is a well activated public space, something akin to Mitchell Park in Greenport, NY, or The Division Street Plaza in Somerville, NJ, or Grand Central Plaza Park in Valparaiso, IN, that can attract people during the daytime, providing both a pleasant respite and entertainment.

    Such public spaces not only can provide venues for a wide variety of events and activities, but they can also provide visitors with opportunities to find a safe and comfortable retreat or to simply be entertained by watching what other users of the space are doing. Importantly, such spaces also can provide opportunities for visitors to engage in a broad range of activities such as playing chess, riding a carrousel, ice skating, running through a splash pad, reading a book or magazine, playing miniature golf, etc.

    Over the past two decades, I have engaged in a number if informal discussions with downtown leaders in cities with populations under 35,000 about creating strong downtown public spaces. In too many instances I have heard that such projects were not feasible in their downtowns because:

    • They would be too expensive to build and operate
    • Their winters are too long and too cold
    • A lack of appropriate sites
    • Such spaces would be dominated by drug users and dealers, the homeless and/or unruly and intimidating teenagers.

    Public spaces definitely require funding, but DANTH’s research has shown that attractive and successful downtown public spaces can be created and maintained at significantly lower costs than PACs, theaters, arenas, ballparks and museums. Moreover, their operating cost per visitor are also far lower. For any downtown that wants to strengthen their entertainment niche, creating an attractive public space will most likely produce the biggest bang for their bucks. See: https://www.ndavidmilder.com/2014/11/bryant-park-part-3-a-comparison-to-other-entertainment-venues-on-annual-expenditures-and-annual-expenditures-per-visitor. The downtown leaders who create these spaces often use numerous funding sources, e.g., city, state, federal and foundation grants and private donations, as well as several financial tools, e.g., tax increment financing, to pay for their construction. All are well known, not protected secrets.

    Many downtowns are located in cold climes and a lot of them have found ways to make their public spaces active during the winter months. A favorite tactic is to turn them into ice skating rinks. For example, Grand Central Plaza Park in downtown Valparaiso, IN, just added a new pavilion that covers an open air ice rink in the winter and provides a shaded venue for events during hot summers. The park also has a splash pad for children on hot days and an amphitheater for outdoor concerts and other events.


seh-valpo-spray-pad


Central Park Plaza’s Splash Pad in Valparaiso, IN. Photo by SEH

 valpo-new-pavillion

 Central Park Plaza’s new pavilion during the summer

great-places-2016-spaces-central-park-plaza-ice-skating-rink

Central Park Plaza’s new pavilion during the colder months – an ice skating rink


I have been amazed by how appropriate sites for such public spaces have been found. Division Street Plaza was a decaying side street. Mitchell Park was a burned out hotel and marina on badly contaminated land. The 4,000 SF pocket park in Washington Borough, NJ, was a decayed old building. It’s surprising what a little ingenuity can come up with and how that ingenuity appears when downtown leaders really want a vibrant public space.

Effective and humane programs for dealing with the homeless in public areas are to found in many places across the nation. That wheel does not need reinvention, though some tailoring to local conditions may be required. Other bad behaviors can be kept out by bringing in a lot of well-behaved users and nipping some behavioral problems when they are still in the bud.

As I researched for this article, I was most happily surprised to find that serious steps are now being taken in both downtown Scottsbluff and downtown Rutland to meet their needs for new vibrant public spaces. In Scottsbluff, buildings are now being cleared to provide the land needed for the Downtown Plaza. Eventually it will have a stage, space for vendors, a venue for their Farmers Market, an artificial ice rink in the winter (like Bryant Park in NYC) and space for other events, such as outdoor movies. Very importantly, it also will provide public restrooms. (See the graphic below.) It will be completed in three phases.

plaza-layout-phasing

Basic design of downtown Scottsbluff’s new Downtown Plaza

Given its size, visibility, uses and proximity to downtown retailers, one might anticipate that the Downtown Plaza will have positive benefits for nearby merchants and restaurateurs. One concern is that while care is being taken to have adequate shading, I have not found in my brief search any mention of how seating will be provided. Seating can be a critical issue. Another concern is how long it will take for the Plaza project to be completed or to reach a critical mass.

In Rutland, for about a decade now, local leaders have been trying to redo an existing public space, the Center Street Alley, that had been used in the early 1980s as a venue for downtown events. It later fell into disrepair and encountered user avoidance. Public use was halted. With federal funding, plans for this space reportedly again on the table and call for it to be reopened to the public after the installation of “new brickwork, lighting, benches and trees.”

The Center Street Alley space, to my ken, is rather strange. Its main part has little visibility from any of the surrounding streets, as can be seen from the map below. It occupies the center of a city block and seems to have been created from the backyards of the surrounding buildings that face Strongs Avenue, Washington Street, Center Street and Wales Street.

center-st-alley-map

Look for the Center Street Alley in the center of this map — Map from Downtown Rutland Partnership, cropped by NDM

One can easily visualize how such a space might provide both a nice refuge for visitors to sit quietly and a venue for public events. But, its ability to make the downtown appear more active and exciting seems hampered by its lack of visibility to passing pedestrians and autos. I plan on following what happens to this space. My concern is that its “hiddenness” may impede daily use levels and limit its favorable impacts on nearby merchants. On the other hand, its hiddenness may give the space a kind of quirky, being in the know appeal.

Some Takeaways

  • The weakening of retail malls and traditional specialty retail chains in our smaller rural regional commercial centers is giving savvy downtown merchants serious market opportunities. The apparel shops in downtown Rutland show that savvy, small downtown merchants can indeed take advantage of these market opportunities. Their presence on the Internet is helping them do that, at least with shoppers within their trade area. They are not using the Internet to generate online sales from national markets.
  • The growth of big box and value oriented retailers probably is not what mainly forced many small downtown retailers out of business during and after the Great Recession. More important was the reduced demand created by the emergence of deliberate consumers and the merchants’ inability to respond appropriately to the new and highly stressful situation.
  • Downtown Rutland shows that attracting some of the big retail chains, e.g., Walmart and TJ Maxx,  can be good for downtown merchants because of the strong customer traffic they bring in.
  • However, good urban design has to be used to assure that these big retailers will be physically integrated into the downtown. That enables small downtown merchants to share in the big retailers’ customer traffic.
  • Downtown restaurants, public spaces and other central social district entities can help bring people downtown who then become potential shoppers for local merchants.
  • There is a tendency in these rural commercial centers for multi-unit housing not to be developed in or near their downtowns, probably due to cultural preferences and poor market research. The downtowns would greatly benefit from such development, especially their restaurateurs and retailers.
  • A challenge for the merchants in these downtowns is to get the shoppers who are going to other shopping centers and malls in the city to visit their district. Developing the downtown’s central social district functions, which includes housing, restaurants, bars, entertainment and cultural venues is a sound strategy for attracting those shoppers. For small downtown retailers, restaurants and public spaces are especially helpful because they are active when the merchants’ shops are open. Of course, if downtown merchants would change their hours to coincide more with those of downtown entertainment assets, they probably would get significantly more sales. We can dream, can’t we!
  • Having a public space does not mean it necessarily will have the desired level of positive benefits for local merchants. The space must work, it must be vibrant and attract people and events. Simple things like adequate seating and shade can be critical to their success. The space also probably needs to be fairly visible to pedestrians and cars passing by.


Up Next : Affluent suburbs with lots of trophy retailers


Posted in Business Recruitment, Central Social Districts, Deliberate Consumer, Downtown Merchants, Downtown Niches, Downtown Redevelopment, downtown retailing, E commerce, Economci Development, EDOs, Entertainment niche, movie theaters, multichannel retailing, New Normal, Planning and Strategies, Public Spaces, retail chains, Small Merchants, Small Towns, The Arts |

Post navigation

← Older posts
Newer posts →

Recent Posts

  • Now is the Time for Many Downtowns to Grow Older Adult Member Communities
  • How downtown multifunctionality is packaged is a key to its success
  • “How Our Downtowns’ Three Most Important User Groups Can Help Their Sustained Recoveries”
  • The Cockamamie Conclusions andAssumptions of the Downtown Doom Loop Analysis
  • More Visitors, Not the 100% Return of Office Workers, Are the Key to the Full Recovery of Our Downtowns

Labels

  • 15 minute neighborhoods (2)
  • automated cars (4)
  • backdoor retailing (5)
  • BIDs (27)
  • Business Recruitment (29)
  • Captive Markets (10)
  • Central Social Districts (38)
  • Central Social Functions (6)
  • Change Agents (24)
  • clean sidewalks (2)
  • clean streets (2)
  • commercial nodes (11)
  • Contingent workers (4)
  • convenience (6)
  • Creative Class (31)
  • Crime (8)
  • CSDs (7)
  • DANTH (13)
  • Deliberate Consumer (13)
  • Downtown Garages (4)
  • Downtown Merchants (30)
  • Downtown Niches (64)
  • Downtown Redevelopment (70)
  • downtown retailing (66)
  • Downtown Visitors (5)
  • driverless cars (4)
  • E commerce (27)
  • Economci Development (54)
  • Economic Development (8)
  • EDOs (27)
  • Entertainment (44)
  • Entertainment niche (35)
  • Entrepreneurship (14)
  • fear of crime (9)
  • Financial tools (5)
  • Formal entertainment venues (28)
  • Formats Facades Signs (6)
  • Functional Diversity (2)
  • Housing (11)
  • Informal entertainment venues (26)
  • Innovations (33)
  • Jamaica Center (3)
  • Jobs (7)
  • Leakages/gaps (7)
  • Live-Work (6)
  • Living donor (1)
  • Luxury retail (7)
  • Market research (7)
  • movie theaters (23)
  • Moving People (3)
  • multichannel retailing (20)
  • Multifunctionality (2)
  • New Normal (50)
  • Office Development (11)
  • Older Adults (1)
  • Pamper Niche (9)
  • Parking (5)
  • Parks (3)
  • Parksmand public spaces (6)
  • Pedestrian traffic (19)
  • Planning and Strategies (52)
  • Public Spaces (25)
  • Remote work (4)
  • Remote working (2)
  • retail chains (30)
  • self-driving cars (4)
  • Seniors (1)
  • Small Merchants (36)
  • Small Town Entrepreneurial Environments (8)
  • Small Towns (36)
  • Social Media (3)
  • Sprawl (3)
  • Suburban Downtowns (21)
  • Superstar downtown (2)
  • technology (11)
  • teenagers (4)
  • The Arts (28)
  • time pressure (5)
  • Tourism (10)
  • Trends (50)
  • Uncategorized (34)
  • Up for Grabs shoppers (2)

Links

  • CCED
  • Planetizen

BACK TO TOP

83-85 116th Street, Ste 3D
Kew Gardens, NY  11418
Phone: (718) 805-9507
[email protected]

Copyright © ndavidmilder.com