Retail Leakage Analyses Should Be Treated With Great Caution by Analysts and End Users: 2 Some Serious Data Issues

By N. David Milder

Introduction

This is the second of a two-part article on the need to be very cautious when doing or using a leakage analysis. Part 1 focused on the analytical issues associated with this economic development research tool. It can be found at

https://www.ndavidmilder.com/2016/09/retail-leakageleakage-analyses-should-be-treated-with-great-caution-by-analysts-and-end-users-analytical-issues.

This article will focus on the problematical data too often used in leakage analyses.

GIGO is an acronym well-worth knowing. It stands for Garbage In, Garbage Out. Too many leakage studies are very problematic because the data they use are very questionable. This is often not the result of data suppliers being slovenly in their data gathering or analysis – although sometimes, it is – but because getting information about small and medium sized firms’ sales, workforces and finances can be very difficult. To counter this problem, the leakage market data firms sometimes will try to use business census and related data to estimate the sales of the firms in the major NAICS codes that have been identified in a study area. Their resulting estimates are not based on primary research and have a number of degrees of separation from the original firm level data that is usually unknown to the data purchasers. Different research firms will have different methodologies for making these estimates. Which, if any of them, produce accurate estimates about NAICS retail categories’ sales is a key question. Unfortunately, I have not seen any studies that validate the accuracy of these estimates. This suggests caution and prudence in their use.

A Good Starting Point for the Discussion

esri-vs-sales-tax-retail-sales-estimates-xlsx

The table above is a good starting point for this discussion. It shows the results of the leakage analyses generated by Nielsen and Esri for a city in the West that has a population of about 30,000. These two respected private firms provide a lot of the demographic and business data used in the economic development field and the table is representative of the leakage analysis data they produce. They certainly are not the only ones that generate the data used in a leakage analysis, but because of their affordable prices and easy online access, they are used by many EDOs (mostly by their consultants) looking for such information.

The table’s first column shows the NAICS retail categories being analyzed. Leakage analyses subtract retail sales in the study area from consumer expenditures. If the expenditures exceed sales, there is a leakage. Conversely, if sales are larger than consumer expenditures, there is a surplus. Columns three-five provide the data on consumer expenditures, store sales and leakages/surpluses for each category. The data in columns three and four are estimates – these firms have not directly surveyed the residents of City XYZ about their expenditures or the retail stores about their sales. That’s one reason why their leakage analysis reports can cost $50 and not $25,000. The data in column five are simply the results of subtracting the data in column four from those in column three.

Given that the numbers in column five are supposed to facilitate an understanding of economic growth potentials and possibly an assessment of the market viability of substantial private investments, looking at the table probably leaves the reader disturbingly confused. While there is agreement in direction (i.e., leakage or surplus) and quantitative closeness in some categories, e.g., gasoline stations, furniture and home furnishings, on many others the size of the leakage/surplus differs substantially, e.g., food and beverage stores, or conflicts on direction, e.g., health and personal care stores and eating & drinking places.

Looking at the estimated data in columns three and four, there is an even more divergent pattern. The estimates of both consumer spending and stores sales are in most cases substantially different. These two market data-producing firms are obviously using very different methodologies and/or formulas to generate these estimates.

How, then, do we know which, if any, of these leakage estimates can be trusted?

An Example of the Explanations They Provide

If you call these firms or look online for explanations of how they generate their estimates, they may use quite a few words, but seem nonetheless not very transparent. Here, for example, is how ESRI in “2014 Methodology Statement: Esri Data—Retail MarketPlace,” a 2014 white paper,” described how they estimated retail sales:

“Estimates of retail sales begin with the benchmark, the 2002 and 2007 CRT (Census of Retail Trade) from the US Census Bureau. Trends from the economic censuses are used to update the base along with Esri’s extensive portfolio of demographic and business databases. These include commercial and government sources such as the Dun & Bradstreet business database and economic statistics from the Bureau of Labor Statistics. Supply estimates also incorporate data from the Census Bureau’s Non-employer Statistics (NES) division. Smaller establishments without payrolls, such as self-employed individuals and unincorporated businesses, account for a small portion of overall sales. However, these businesses represent more than half of all retailers in the United States. Their inclusion completes the report of industry sales.

Esri’s model captures economic change by first differentiating employer and non-employer sales growth. Multivariate statistical techniques are used to model data that is subject to disclosure issues in CRT and NES. Sales estimates have been recalibrated against the Monthly Retail Trade (MRT) survey and independent sources to address the disparities that can exist between independent input data sources. This methodological improvement yields a more precise estimate of the retail sales attributable only to domestic households.

Esri licenses Dun & Bradstreet’s business database, which also provides sales for the retail market. Although Esri utilizes this database in the derivation of small-area estimates, the methods differ. Esri estimates retail sales only to households for implementation within the Retail MarketPlace data. Additionally, Esri relies heavily on data from both the CRT and MRT to improve estimation. Furthermore, the Dun & Bradstreet business data file is reviewed and cleaned to improve data content. All estimates of market supply are in nominal terms and are derived from receipts (net of sales taxes, refunds, and returns) of businesses that are primarily engaged in the retailing of merchandise. Excise taxes paid by the retailer or the remuneration of services are also included, for example, installation and delivery charges that are incidental to the transaction.”

This explanation shows that Esri s methodology is a rather complicated, multi-step process, which involves quite a few data sources and data manipulations. Part of those complications is the result if its recognition that the estimates based on one data source or another are in need of improvement.

Dun & Bradstreet (D&B) and MRT data are needed because:

  • The business census data are aggregated to such geographic units as states and counties that are not congruent with the non-legally defined boundaries of many study areas. Addressed based D&B data can be aggregated to the needed geographic boundaries.
  • The business census is done only every seven years and the actual data are only released two to three years after it is taken. Depending when they are used by outside analysts, the business census data can be three to six years old. The census data cannot be depended on to detail what businesses are there and what they are like. The D&B data are supposedly more recent and able to establish who is there now. ESRI’s methodology recognizes the importance of knowing how many firms by size there currently are in each retail NAICS code in a leakage analysis study area. The NES data are used to address the presence of small firms.

On a key question, whether and how Esri uses D&B’s data on firm sales, Esri’s white paper is unclear.

My take aways from Esri’s explanation of how estimates of retail sales are made are that it

  • Reveals the sources of some of the data they use, e.g., the Census Bureau, BLS, Dun & Bradstreet. However, they do not detail the data obtained for each retail firm (e.g., name, NAICS code, sales, number of employees) or, very importantly, how these data may have been statistically manipulated to produce their estimates. This is understandable to the degree that their methodology provides a competitive advantage over their rivals and therefore needs to be kept confidential. Nevertheless, it makes assessing their estimates more difficult.
  • Additionally, and perhaps even more importantly, Esri provides no indication that they have validated their estimates, i.e., shown that their estimates are accurately measuring what they are supposed to be measuring, or that they even made an attempt to do so. How, then, can we know that their methodology is sound? How can we have confidence in them?
  • Is a complicated methodology with many steps. I was taught that every time basic data are manipulated or added to there is a potential for a new error factor to be brought in. Esri has added steps to its methodology to overcome some known errors. Whether they are successful or simply add new errors is unknown.

I have not found any better explanation from Nielsen or its corporate predecessor Claritas about how they estimate retail sales.

A Closer Look at Basic Supply Side Information: Retailers –Their Number, NAICS Codes, Sizes and Sales

Accurate basic firm level data are absolutely essential to an accurate and useful to a traditional leakage analysis. Having directed numerous surveys of business firms, especially retailers and those prone to renting office spaces, and conducting countless personal interviews with business owners and managers in the USA and France, I am well aware of the difficulties involved in getting reliable data from business firms. This is especially true for the sales and finances of small and medium-sized operators.

As the following quote from Mike Stumpf indicates, I’m not the only one that questions the verisimilitude of the firm-level data that is often the foundation of a leakage analysis. From a recent email, here is Mike’s description of how ESRI looked at one area’s business mix:

“ESRI looked at the area’s business mix, then talked about the very large number of establishments in the financial sector. ESRI’s database lists every ATM as a business establishment! A grocery store with a deli, pharmacy, and liquor store can be listed as four different businesses, each with its own estimated sales, but then they do not pick up the restaurant in the Mexican grocery. Their sales estimates for one Mexican bakery were under $100,000, but they actually do more than that in a single month.”

Both Nielsen, ESRI and other leakage analysts obtain basic data about the stores in a study area from other market research firms, such as InfoUSA, Dun & Bradstreet or, its subsidiary, Hoovers, etc. that focus on firm-level data gathering. Nielsen and ESRI combine that info with data from the economic census and other sources to produce their estimates. In a sense they are heaping estimates upon estimates, with each potentially having unknown error factors that may combine through addition or multiplication.

Over the past three decades my company, for our client’s downtowns, has purchased establishment level data from some of the same business market researchers that have supplied firm level data to ESRI and Nielsen. On occasion, we obtained such data from local economic development agencies. Our experience with those data made a deep impression because:

  • There were usually error factors of 20% to 40% in the listings of firms. The errors, as might be expected, were most frequent among the really small firms that have a high probability of failure and turnover, but some of a downtown’s larger retailers were too often also omitted or listed after they had closed. We have seen annual retail churn rates in our clients’ downtowns (they include newcomers as well as closures) that can range between 5% and 30%. Unless these gatherers of firm-level data research businesses annually, which is very expensive, there is a high probability that their collected facts will be out of date. The year-to-year errors can really add up.
  • The Retail NAICS codes often may be wrong. Our discussion with one of the businesses that gathers firm-level data revealed that the downtown firms themselves were surveyed and provided their NAICS code(s). They were aware that errors were frequent. They attributed this to a difficulty in getting knowledgeable executives to respond to their survey. My review of the NAICS codes listed for retailers in the downtowns we bought data for frequently found numerous questionable codes.
  • I have supplied the NAICS code for my firm in the business census and to insurance companies and found out what many of the not large downtown business owners have told me over the years: selecting the right NAICS code isn’t easy, its takes too much time, and consequently, they just put down whatever is easiest to get the task done. Some reported giving the job of responding to the business census and enquires from firms like InfoUSA to their secretary or assistant or salesperson. I suspect that there are even substantial NAICS code errors in the US Business Census returns — especially from respondents who are the types of independent retailers found in our small and medium-sized downtowns and urban ethnic neighborhood commercial centers. DANTH, Inc. has conducted many surveys of businesses over the years, including the largest corporations headquartered in Manhattan, those in the healthcare industry, manufacturers in Nassau County, NY, etc. We quickly found there was a tendency for high-level executives to avoid responding to our survey. They felt it was a waste of their time.
  • Getting accurate firm-level retail sales data is really, really difficult. In addition to the surveys mentioned above, DANTH has also done numerous surveys of downtown merchants. Unsurprisingly, we found that there is strong resistance among most independent downtown merchants to providing such information. Interestingly, they sometimes reported that, off hand, they don’t know that information. The managers of the national chain stores also are loath to reveal their sales statistics. Many downtown managers – probably most – can attest to the difficulty of obtaining such information.
  • One of the business market researchers reported to me a few years ago that they have similar challenges getting information about a firm’s sales, workforce and finances. For the national chains, they use the chain’s average store’s sales. For the independent merchants they ask for the number of employees – which they said small retailers are more willing to provide – and multiply that by the average sales per employee for that NAICS code in the state. D&B is in the credit rating business, so small and medium-sized retailers who are concerned about their credit rating have an incentive to respond to D&B inquiries.

Getting basic information about small and medium sized business is a tough job, fraught with potential errors. Given that this type of information is such a basic building block in the often-complicated process of estimating the retail sales of a study area, it seems wise to treat such estimates with caution and prudence.

DANTH, Inc. has used leakage analyses generated by Claritas Esri and UWEX. In each instance, I created small tests of the data. Sometimes running a leakage analysis on a small of part of the study area enabled a comparison of the number of firms with my visual counts. If a NAICS category was identified as being very strong, I tried to verify that by visual inspection and interviews with local business operators. In a project in Sherwood, WI, a fast growing community, I thought that both the demographic data and the leakage analysis of one provider were badly out of date. Instead, I used the UWEX Gap Calculator and data from the Census Bureau’s American Community Survey. On another project, one of my little tests was to see if the leakage analysis had captured the sales of a food operation inside of a convention center. Finally, there is the “making sense test.” Sometimes I’ve looked at one of these leakage analysis reports and felt it just does not make sense. It just may be that the numbers do not jive in my mind with what I saw touring the study area and what I heard from local business people and economic development officials. Reports that fail the making sense test cause me to take a much closer look at the situation.

Sales Tax Data. In a number of states, retail sales tax information sorted by NAICS codes are gathered and published for the state, counties and sometimes the cities. These data are potential analytical gold for those researchers who find those geographic units congruent with their study area. Even when they are not, the validity of such data may provide a strong foundation for making needed extrapolations for the non-legally defined study areas.

Most of my project experience has been in states that do not provide such information. On the two occasions when I did projects in such states, I encountered some problems that impeded my use of the sales tax data. In one state, the sales tax is applied to only a portion of the merchandise in various NAICS categories and we could not determine what those percentages were. In the other state, the data for the counties were only provided at the two-digit NAICS code level, e.g., that of the entire Retail Trade category.

However, I have been told by some economic development consultants in California whom I respect that the state’s sales tax by NAICS code data enables them to produce more reliable leakage analyses.

Avoiding the Need for Retail Sales Estimates

In the 1990s and early 2000s, instead of the usual leakage analysis, DANTH, Inc. used an approach based on the consumers’ satisfaction with the retail services in their market area. We thereby solved the unreliable retail sales estimates issue by avoiding the subject. Our analysis focused solely on the consumer. Back then, response rates to our telephone surveys were far more acceptable than today’s 30% or so and we asked respondents if they were satisfied with the stores within a 15 minute drive in each of the higher level retail SIC or NAICS codes. Those that were dissatisfied we deemed as probable out-shoppers and open to being attracted by new retailers within the trade area. We also knew from the survey about these dissatisfied shoppers’ incomes, education levels, age cohorts, etc.

Using consumer expenditures potentials generated by ScanUS, Esri or Claritas we also provided estimates of the consumer expenditures for some of the products associated with each retail SIC/NAICS code. The expenditures of the “underserved” shoppers were, in a sense, up for grabs and prone to being spent out of the trade area. Back then we were not able to match completely BLS product categories to NAICS codes as can now be done. Our retail growth strategies were based on capturing these up for grabs shoppers and a sample of their retail expenditures.

This approach is sort of like a leakage analysis, though not the same. However, it enables an analyst to answer the same important retail growth questions, with far fewer questions about the validity and reliability of the data used.

DANTH has not used this approach recently because the cost of a really good telephone survey has become unaffordable and their findings less reliable, while the use of lower cost non-panel online surveys have serious sample issues.

Of course, others have used local surveys to ask respondents about whether they mostly buy various products in town, out-of-town or online. That, too, tells you about the leakage of shoppers and avoids the need for data about retail sales. Here, again, being able to do an affordable survey with a representative sample is a critical question.

My guess is that within the next 10 years online survey techniques will solve the sampling issue and affordable surveys will be possible. Then researchers will be able to answer the questions that leakage analyses are intended to address without needing to know about local retail sales or complicated methodologies for estimating them.

The Demand Side – Consumer Expenditures by NAICS Category

BLS Based Approaches. As I have written elsewhere, the best way of obtaining reliable, acceptably accurate data on how consumers spend their money is to survey them. However, such surveys require substantially more methodological skills and resources than most other kinds of surveys. For many consumer items, the relevant information must be obtained close to the points in time when the expenditures are made, lest memories of them quickly fade. For example, the Bureau of Labor Statistics (BLS) probably sets the gold standard for this type of research and it has half of its 14,000 survey respondents keep diaries of their expenditures and interviews the other half 5 times over 15 months. In contrast, I’ve seen many inept downtown and Main Street surveys that ask about shopper expenditures that are oblivious of the challenges involved, have no where near the rigor of the BLS surveys, have relatively few respondents and their results aren’t worth the paper they are printed on.

While the BLS expenditure data are solid and a good starting point, using them to inform estimates of consumer expenditures in a leakage analysis study area presents a number of barriers that must be overcome:

  1. The BLS uses categories to order its data that are product oriented, about the things people buy not the kinds of stores consumers buy in. The demand side retail sales data are ordered by the NAICS codes that are about the characteristics of aggregations of retail stores. To be useful in a leakage analysis, the BLS data have to be “crosswalked” into the NAICS categories. Such data crosswalks are enabled by a list of the products that are typically sold in the different retail NAICS codes that was produced by the Census Bureau. Using the list can take a lot of effort. Computerizing the list makes things easier, but also takes resources. Both Nielsen and Esri do these data coding crosswalks. This data crosswalking is a possible opportunity for errors to enter the analysis, but I think the probability of that happening are relatively low.
  2. The geographies used by the BLS are far, far larger than the size of any retail leakage study area. The 14,000 respondent BLS sample is still too small to provide enough respondents to be directly used even at the state level of analysis; the sample would average only about 280 respondents per state. Consequently, some methodology is needed to make estimates of consumer spending within retail leakage study areas that is based firmly on the BLS data. Both Nielsen and Esri have developed methodologies to make such estimates based on the BLS data. My research experience says these research tasks have significant opportunities for errors to enter into the analysis.
  3. Different types of people have different spending levels and patterns and different retail leakage study areas will vary in the kinds of people that live in them, e, g., by income, education, race, lifestyle group. The BLS data based estimation process needs to be able to adjust expenditure estimates by taking these population differences into consideration. Both Nielsen and Esri use their demographic and lifestyle segmentation databases, Prism and Tapestry, to make these adjustments. My research experience again says these research tasks have significant opportunities for errors to enter into the analysis.

The data presented in the table earlier in this article about City XYZ shows big differences in Esri’s and Nielsen’s estimates of consumer expenditures. This suggests that while they both are trying to address the problems just enumerated above, their methodologies vary significantly. Again we are posed with the problem of whose estimates, if any, should we trust?

The BLS data covers household expenditures. Used in a leakage analysis they inform only about the expenditures of study area residents. They do not appear to inform about the expenditures of day and overnight tourists and non-residents who work in the area. Yet, accurate estimates of retail sales should include the sales dollars from those types of customers. For many downtowns, the non-resident customer base can be extremely important. There consequently seems to be an imbalance between the customers included in the analysis on the demand and supply sides. Bill Ryan has recently upgraded UWEX’s Gap Calculator to incorporate data on the expenditures of tourists and people working downtown. Others should follow suit.

ecommerce-retail-2013-and-projections-xls

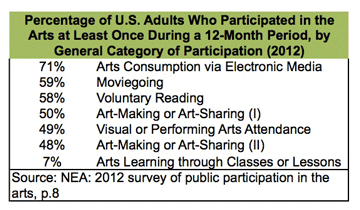
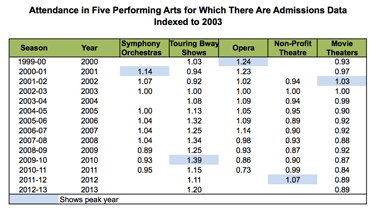
Also, of increasing importance, the BLS data does not tell us whether consumer expenditures are being made in brick and mortar shops or online. The total of online retail sales now only accounts for about 6.5% of all retail sales nationally. However, as can be seen in the above table,

  • By 2017 it is anticipated, if trends continue, that e-commerce will account for 50%+ of the sales for music, videos, books, magazines, computer hardware and software, toys and games, electronics and appliances,
  • By 2017 e-commerce is projected to account for 25%+ of the national sales of furniture, sporting goods, office equipment and supplies, clothing, accessories and footwear.

 The vast majority of online purchases will be going to retailers based geographically outside of the retail leakage study area, perhaps across the country or even on another continent, yet they are very close because they can be reached from a living room chair almost instantaneously via a smartphone, tablet or computer. The online purchases are, of course, leaked purchases. The important question then becomes do local merchants have a real chance to recapture these dollars? The strong trend now is for online sales to grow at a rapid pace. Younger Americans, especially the Millennials feel very much at ease with making online purchases and they will be growing in number. Older folks are getting more accustomed to buying online, but not like the younger age cohorts, and many of them will soon fade away. Consequently, a strong argument can be made that, for the foreseeable future, it will be much harder for local brick and mortar merchants to win back dollars spent on the internet than for dollars spent in other brick and mortar shops located beyond their trade area’s boundaries.

If this is the case, then knowing about how many consumer dollars in a study area are going online is, in effect, identifying “dead dollars” that now are well beyond the reach of local retailers who really have little hope of recapturing them – unless they, too, are able to become strong competitors on the internet. Unfortunately, this is the type of information that many downtown leaders need to know, but don’t want to hear.

None BLS Approaches. Leaders of EDOs in many small and medium sized communities may want a leakage analyses done for their downtown, but the don’t have a lot of money to pay for a consultant. Some consultants and economic development organizations have constructed leakage calculators that can be used by EDO leaders or their staffs either for free or for little cost. These builders of these calculators do not have the funds that take the BLS data and crosswalk then into NAICS codes, or to generate expenditure estimates at the study area level, or to adjust such estimates through the use of a lifestyle database. Instead, they take a simpler and less expensive approach:

  • They take the retail sales by NAICS code at the state level and adjust them for inflation
  • Then they divide those sales numbers by e the population of the state to get per capita sales per NAICS code at the state level.
  • Then they treat these per capita sales estimates as measures of per capita spending. They identify the population of the study area in question and then multiply the NAICS per capita sales estimates by that population number to estimate total consumer expenditures by NAICS codes for the study area.
  • They then identify the median household income in the trade area and adjust the consumer expenditure estimates accordingly.

In a lot of ways this is a simpler and easier way of estimating consumer expenditures in a study area than how Nielsen and Esrsi do it. I’ve used the UWEX Gap Calculator and can attest that its easy to use. It’s intended users are small and medium-sized downtowns, where local leaders can input their own data about the retailers in their trade areas.

The use of sales data at the state level to estimate consumer expenditures at a study area level may raise a few eyebrows. It did mine. Since the state retail sales data includes tourist sales, those dollars are also finding their way into estimates of resident retail expenditures and inflates them inversely to the actual flow of tourists through the study area. The theoretical explanation for it escapes my understanding. But, can Nielsen and Esri prove that their estimates are any better?

Given that there is no evidence that the gap calculators do any worse than the leakage reports the big private market data firms put out, who’s to say they are not worth considering. The price is right. Moreover, they are methodologically rather transparent: it’s easy to understand how all the estimates are being made.

Some Final Comments.

To properly do our research we need to live in the real world and in that real world we most relay on doing secondary or tertiary levels of analysis on primary data collected by someone else. Professionally, we should have been trained to understand that we must be very cautious about how we do our secondary analyses and transparent about our methodology when we present our findings to others. We need to be even more cautious about how we accept the secondary analyses done by others – especially when their methodology is not transparent and their findings have a significant number of apparent errors and conflict with the findings of other analysts.

That is why I argue that the estimates of retail sales and consumer expenditures generated by most leakage analyses should be treated with caution and used with prudence.

The New Normal’s Challenges to Developing a Downtown Entertainment Niche Based on Formal Entertainments: Part 2 the audiences; revised 041214

Posted by N. David Milder

Introduction

This is the second part of the third in a series of articles about the “new normal” for our nation’s downtowns. It focuses on the challenges many downtowns — especially those that are not very large — now face when they decide to bolster their central social district functions by creating and/or strengthening their venues for the performing and visual arts, e.g., performing arts centers (PACs), theaters, cinemas, concert halls, museums, art galleries, etc. Part 1 dealt with a general introduction of the challenges, a discussion of who can afford formal entertainments and changes in the ways governments, corporations and foundations are funding arts projects. Part 3 will discuss a number of formal entertainment venues as examples and then dive into an update of DANTH’s analysis of what’s happening with movie theaters.

Here, in part 2, the discussion will turn to changes in the ways Americans attend performing arts events and visit visual arts venues. Secondary analyses of two kinds of data will be employed: representative sample surveys done for the National Endowment of the Arts (NEA) and other arts related organizations and reports of admissions to various types of arts venues/performances that were obtained from a number of arts sector organizations.

While both types of data can potentially shed light on consumer demand for attending various performing and visual arts events, they are quite different in nature, much as beans differ from broccoli, though both are vegetables. For example:

  • While the surveys ask individuals whether they attended various arts events over the prior year, the admissions data report the number of people who attended events put on by arts organizations or visited their venues. The surveys report on characteristics of individuals; the admissions data are characteristics of the organizations or venues
  • Translating directly between the two usually is difficult because of a number of issues. For example, the NEA survey may ask about attending classical music concerts, but the best relevant  admissions data are only about attendance at concerts done by our largest symphony orchestras. The NEA survey data reports do not detail how often an individual may attend a particular type of arts event, e.g., once to a museum, three times to an opera, six times to a ballet, etc., while the Culture Track report does. The admissions data reports do not detail how many admissions were accounted for by people who had attended multiple times, e.g., subscription ticket holders
  • The survey data also tell us, at least by implication and sometimes overtly, about the percentages of people who did not attend each of the arts events/venues asked about. However, memories about attendance over a prior year can lead to an unknown degree of erroneous reporting. The admissions data are not informative about those who do not attend. They simply indicate an important fact for those operating arts organizations and venues: whether admissions have gone up or down – and usually with a good deal of reliability
  • Population growth is also an important factor. It is entirely possible that the number of people who are buying tickets for a type of arts events, e.g., chamber music, stays the same over 10 years, but, because of population growth, their proportion of the population would decline.

In this article the survey data will be treated as providing evidence about the proclivities of individuals in the USA to attend various arts events/venues and for explaining why they do so. Though their availability are quite limited, the admissions data will be treated as the best data about actual attendance and ticket sales and as the best indicators of how arts organizations and venues are doing. Obviously, the former should have some impact on the latter, but the paths of that influence are often difficult to accurately identify and detail. However, when both show a similar pattern, e.g., declining attendance and admissions, they can help validate each other’s findings.

The Surveys

The potential audiences for formal entertainment venues are composed of people who “consume” art by attending performing arts events (plays, operas, concerts) or visiting visual arts venues ,e.g., museums, art galleries, etc. The 2012 NEA survey shows that only 49% of its respondents reported engaging in such attendance behavior in the prior year (see the table immediately below). Movie-going, in comparison, had a 59% attendance rate.

NEA-arts-partcipation-at-least-once-2012

Looking more closely at specific arts, the NEA survey showed that in 2012 only relatively small proportions of respondents attended them: classical music 8.8%; jazz 8.1%; dance other than ballet 5.6%; ballet 2.7% and opera 2.1% (see table immediately below). This suggests that the potential audiences for such arts events are comparatively small, though they will be higher where they are geographically clustered, e.g. affluent neighborhoods.

Moreover, when compared to the findings of a 2002 NEA survey, it appears that there has been a general decline in attendance: classical music -24%; jazz -25%; dance other than ballet -11%; ballet -31% and opera -34%. This would indicate that the audiences for these performing arts are not just relatively small, but they are also dwindling when looked at on a percentage basis.  

NEA arts partipcation table 031514

The National Arts Index Report 2013 (NAI) uses survey data gathered from 210,000 individuals by Scarborough Research to demonstrate that attendance at art museums between 2006 and 2011 was below 2003 levels, down by about 8% in 2011 (1). Moreover during the 2003-2011 period, museum attendance never regained their 2003 level.

Some have argued that the decline in arts attendance revealed in the NEA’s 2008 survey was a result of the Great Recession. However, 2012 is three years after the recession’s official termination, yet the decline continued. The economy is undoubtedly a factor, but probably through economic forces that were in play prior to the recession’s onset and continue to have impacts today. This view will be supported below when the admissions data of arts venues are discussed.

arts-consumed-thru-electronic-media

One reason for this decline may be the growing consumption of performing and visual arts through electronic media. For example, the 2012 NEA survey found that 61% of the respondents used TV, radio or the Internet to access art or arts programming (see table above).  A closer look shows that 57% consumed music of any kind via the electronic media;  14% accessed ballet, modern or contemporary dance or dance programs or shows; 7% theater productions and 4% opera. The numbers for dance and opera rival those who attended such performances in person in theaters or other physical venues.

In the near future, technological innovations may increase this diversion to e-attendance. For example, Mark Zuckerberg posted the following comment to explain Facebook’s purchase of the maker of the Oculus virtual reality headset: “When you put  (the headset) on, you enter a completely immersive computer-generated environment, like a game or a movie scene or a place far away. The incredible thing about the technology is that you feel like you’re actually present in another place with other people” (2). The potential for using a virtual reality headset to attend sports events, plays, concerts, operas, etc. appears real; the degree to which it will be realized remains unknown. If not Oculus or some other virtual reality device, then some other technology may emerge to drive more e-attendance. This Pandora’s box has been opened. Also, it should  be remembered that technological impacts on arts attendance are not a new phenomena: back in the 1950s TV viewing drastically decreased movie attendance and changed the way that industry works, but we still keep going to movie theaters.

Other factors are also very important in determining attendance at arts performances. As the Culture Track 2011 report noted: “Decisions about whether to participate in the arts are driven primarily by cost, programming, and convenience. This is true at all ages and income brackets” (3). This report was also based on a large national survey with 4,000+ respondents. The NEA surveys also show that age, education  and ethnicity can be factors, but it notably neglects to discuss the impacts of income. Education is probably acting somewhat as a surrogate variable for income in the NEA analyses because of their high correlation. In today’s economy, one might reasonably argue that admission cost is a major determining factor for persons who are not wealthy and who do not have heaps of discretionary dollars to spend.

Arts-8-distinct-mkt-segments

The Culture Track 2011 study did identify a number of high arts consumers: the young cultural omnivores — likely the young hipsters with lots of discretionary dollars to spend — and the older seasoned cultural omnivores, who  appear to be older and affluent. As the word “omnivore” implies, both like to attend a variety of arts/cultural events. However, together, they represent only about 10% of  the Culture Track survey’s respondents. Then there are three segments that specialize in the type of cultural events they prefer to attend: the museum mavens just like to visit museums, the devoted theater goers just like to go to the theater and the family centrics prefer to attend mostly child friendly events. The specialist consumers’ attendance rate is about half of that of the omnivores. The specialists account for 30% of the Culture Track survey’s respondents. Forty-eight percent of the survey’s respondents are non-attendees and infrequent attendees, and 12% are in the rural history segment that basically is lives in very rural areas, far from major cultural venues. 

The Culture Track survey also found that decreasing attendance was being influenced by the general economy and manifested in the reduced number of events culture consumers went to,  not in a reduction of the number of people who are culture consumers.

These findings suggest that besides about half of all adults being hard or impossible to attract to cultural events, substantial portions of those who are culture consumers will opt out if a venue does not put on the particular type of cultural event/performance they prefer. They also show that the economy is having a negative impact on how often American cultural consumers attend cultural events.  

It should be noted that the NEA’s 2012 survey did find art events that were attracting more people, e.g., 5.1% reported going to events where Latin, Spanish salsa music was played compared to 4.9% reported in its 2008 survey. The NAI report, again based on Scarborough Research survey data, shows that attendance at “live popular music,”– which includes country, R&B, rap, hip-hop and rock music performances — equaled or exceeded the 2003 level every year but one between 2004 and 2011. Indeed in 2011,  attendance at live popular music events was 14% above the 2003 level (4).   This reflects another pattern the surveys agree on: some arts forms are attracting stronger audiences. However, the “high brow” culture/arts forms, e.g., opera, ballet and classical music are not among them.

For those believing that the performing arts can be a silver bullet solution for downtown revival, the NEA and similar surveys indicate a changing and too often dwindling potential audience. They also suggest that the demographic characteristics of a market area and its prevailing lifestyle segments can have a big impact on potential attendance for each of the various types of performing and visual arts events. Formal entertainment venues are likely to be intensely challenged when they try to find and capture  audiences for their programs and events. Consequently, the critical ticket and admissions sales portion of their revenues seem to have become more uncertain, just as have their government funding and grants from corporations and foundations.

REVISION 041214: Since the initial posting of this article DANTH has come across survey information released by the Broadway League, “The Audience for Touring Broadway: A Demographic Study 2011­ -2012,” which had the following findings:

  • “Seventy percent of attendees were female.
  • The average age of the Touring Broadway theatregoer was 50.5 years.
  • Eighty ­nine percent of Touring Broadway theatre goers were Caucasian.
  • Seventy-­eight percent of the audience held a college degree and 30% held a graduate degree.
  • Forty­ six percent of national theatre goers reported an annual household income of more than $100,000, compared to only 21% of Americans overall.
  • Thirty ­one percent of respondents were subscribers to the “Broadway Series” at their local venue.
  • On average, Touring Broadway attendees saw 4 shows per year.
  • Women continued to be more likely than men to make the decision to purchase tickets to the show.”

Performing and Visual Arts Admissions

To research annual levels of admissions at various types of performing and visual arts venues, DANTH reviewed relevant data posted online by such organizations as the League of American Orchestras, the Theatre Communications Group, the National Association of Theatre Owners (movie houses), The Broadway League, the American Alliance of Museums, Opera America, et al. Some of the reported data are not specific enough for the needs of the analysis in this article. For example, the Alliance of Museums surveys its museum members asking if attendance went up or down in the reporting year within specific percentage ranges. It does not collect anything like “counts.” Most of the other organizations survey their membership about admission counts and then on the basis of the reported data extrapolate out to the total number of organizations in their field. For example, the Theatre Communications Group, for its 2012 report, collected data from 178 theaters and then used those results to make an estimate of the annual admissions of 1,782 nonprofit theaters. Some of these organizations appear to have ceased publishing data about admissions.

The analysis below only covers five of the six types of performing arts for which we could find count-based admissions data: movie theaters; symphony orchestras; touring Broadway shows; opera, and nonprofit theaters . Although the desired data are available for Broadway shows staged in Manhattan’s theater district, they were not included because of their geographically confined relevancy.

Five-arts-counts-raw2

One of the things to take away from the above table is the relative sizes of the absolute admissions numbers for each of the arts categories. Attendance at movie theaters, which is in the billion+/yr range, simply dwarfs the combined attendance of the other four arts categories. The opera admissions are far, far smaller than those for the symphony orchestras and nonprofit theaters. For downtown leaders who want performing arts to drive more traffic downtown, the implications seem obvious.

Attendance for symphony orchestras, opera and movies began their declines well before the onset of the Great Recession. This strongly suggests that other factors were influential. On the other hand, attendance for touring Broadway shows has certainly varied over the years, but usually has been strong. The non-profits theaters’ admissions did hit bottom during the recession, but they have since recovered and actually peaked in the most recent year for which there is data, 2012.

Five-arts-indexed

The above table helps to see historic trends more easily by indexing the attendance statistics for each category to the 2003 attendance:

  • Movies. Movie attendance had an average index score of .923 between 2000 and 2013. It topped out historically in 2002 at 1.03 and then followed a bumpy downward path to .84 in 2011. That is a percentage decline of about -18.4%. However, attendance bounced back with about a 6% increase in 2012 over 2011 and then ebbed slightly, 0.40%, in 2013 (5).  That still left movie attendance about -14% below its 2002 high. As movie attendance has declined, research by Pew found that Americans watch five times as many movies at home than they do in movie theaters — and that study predated  Netflix’s entry into the movie and TV show streaming business (6). To help stem the decline, Hollywood has increased  its annual movie production by about 39%, from 478 in 2000 to 665 in 2012. Over this same period, the number of indoor movie theaters declined by 18.8%, the number of indoor movie screens increased by 9.4% and all distribution and projection functions went digital. Since movie house ticket sales only account for a fraction of movie studio revenues — under 15% — a growing number of movie moguls are pressing for new films to be released digitally at about the same dates as they are screened in traditional theaters
  • Touring Broadway Shows Although this category shows about a -13% decline in 2013 from its peak year in terms of absolute attendance, the 2013 attendance is still 20% above the 2003 benchmark year, and it has the highest average indexed attendance score presented in the above table, 1.14.  Its index scores exceeded the benchmark 1.0 in 12 of the 14 years for which we have data, peaking in 2010 at 1.39. The index scores were relatively high  in the preceding 2006 and 2009  period, with scores of at 1.34 and 1.25 during the two recession years. Its index score has not been below 1.10 since 2004. Attendance is significantly impacted by the number of plays on the road and the lengths of their runs. For example, for Broadway shows there is a .69 correlation between the number of playing weeks in a year and attendance. That can statistically explain about 47% of the annual variation in attendance. From the data the Broadway League publishes about gross revenues of the touring shows, it appears that in 2013 the average revenue per admission was $64.01 (up 22% since 2003). If the average ticket price was around that figure, then a lot of folks probably cannot afford to attend touring Broadway shows.  Not all downtown theaters can attract a touring Broadway play; they must have an ability to generate ticket revenues that are commensurate with the size of the production’s cast and costs.  
  • NonProfit Professional Theaters. There were an estimated 1,782 of these theaters in the USA in 2012, and most were not very large– they averaged just 174 admissions per performance.  For the 11 years that there is available data, the attendance index scores for this arts category are below 1.0 in nine of them. But, the most recent score was its highest, 1.07 for 2012, and it followed a 0.99 score in in 2011 that was a .09 improvement over 2010. These theaters get about 52% of their revenues from earned sources and 48% from contributions.  Using the published expense data and dividing it by attendance indicates that there is about $54.11 in expenses associated with the average admission. The earned income, probably from ticket sales, would cover about $28.26 of the average admission cost, with contributions covering the remaining $25.85. Theater tickets in the $30 range are likely to be affordable to many more people than tickets costing $60+. But, needing this audience subvention certainly contributes to pushing about 50% of these  theaters to operate in the red (7). 
  • Opera. Between 2000 and 2011, opera attendance dropped off dramatically by about 40%. The decline has not been linear. Between 2000 and 2003, well before the recession’s onset, attendance fell by about 24%. It’s attendance index score then increases to 1.09 in 2004 and wobbles up to 1.14 in 2007. It then continues to decline down to 0.73 in 2011, the final year for which we could find data. The difference between the 2000  and 2011 index scores is a stunning 0.51. However, this decline was not linear: an important attendance decline occurred well before the recession, and another and stronger decline started when the pre-recession financial crisis began to emerge. 
  • Symphony Orchestras. For the years the DANTH team was able to find relevant data, attendance at concerts of  187 symphony  orchestras peaked in 2001 and 2002, with index scores of 1.14 and 1.07. It then dropped to 1.0 in 2003 and 2005, well before the Great Recession.  Attendance actually rose to 1.04 in 2006 to 2008 as the financial crisis and the the recession set in, but then incurred a substantial drop in 2009 to its lowest index score, 0.89. Attendance recovered somewhat in 2010 and 2011 with index scores of 0.93 and 0.95, showing something of a recovery trend. But attendance in 2011 still was about 7% off the 2003 benchmark and about 17% below the 2001 peak. While the Great Recession probably had a significant impact on attendance, the drop in 2003 and 2005 suggest that other factors also might be at work. Within the field, there has been much heated debate about whether attendance has ebbed because  the classical repertoire has become too limited, boring or inaccessible and whether substantial efforts are needed to expand its audience by attracting more people from a wider range of ethnic, income and age groups. However, a number of observers have argued that even if attendance may have fallen, the quality of the players and orchestral performances has been very high, and the popularity of classical music has grown in such places as college campuses (8). This raises the question: what, then, are the factors that have been pushing admissions at symphony orchestra concerts down, if it is not the quality of the performances and other than recessionary impacts?

Five-arts-per-capita-redo

The table immediately above takes the absolute admissions data from the table “Attendance in Five Performing Arts for Which There Are Admissions Data” and indexes/standardizes it to the national population in each of the years covered. It is, mathematically, something akin to turning them into percentages.  The results are per capita admissions by year of each of the arts categories in the table. Some things to note:

  • Opera and a classical music subset, symphony orchestras, display strong reductions in attendance in the most recent years for which there is data from their peak years, -46.3% and  -24.3 % respectively
  • These are significantly higher declines than those revealed by the analysis of the absolute attendance data, -40.7% and -17.2%
  • While the touring Broadway shows also show from this perspective a stronger decline, the per capita attendance is still well above the benchmark year
  • Movie attendance also shows a greater decline than the absolute attendance numbers, -21.7& compared to -13.9%; its most recent per capita attendance is well below that of the benchmark year
  • Non-profit theaters had their highest admissions ever in 2012, but the per capita admissions in 2003 were just barely higher, 0.1182 to 0.1169.

Take Aways

  1. This analysis has looked from several perspectives at the issue of what has been happening to the attendance levels for various types of performing and visual arts venues over the past decade or so.
  2. The contention that attendance patterns are changing significantly seems hard to refute.
  3. The contention that forms of “high brow” culture such as opera, classical music and ballet have suffered attendance declines also appears to be supported by the numbers
  4. Art forms associated more with popular culture, e.g., live popular music performances, are those that seem to be doing best. However, movie attendance is not what it has been,  despite huge efforts to buttress attendance by by providing more movies per year on more movie screens and using 3-D and IMAX projection systems to substantially enhance the viewing experience
  5. The impact of technology to provide new ways of e-attending performing arts events or visiting museum art collections (MoMA, the Met, the Louvre, the Smithsonian, the Whitney, etc. all have them) is undeniable, but the extent and pattern of that impact is still uncharted. However, what the movie attendance shows — remember we watch 5 times as many movies at home or on our e-devices than in cinemas — is that to a substantial degree we  still want to  watch/see arts events in person with other people. That does not mean that there will not be adverse impacts — just think of all the closed movie theaters, about 10% of them, some say, due just to the conversion to digital projection and distribution
  6. Whether or not these audience churns and declines reflect a cultural dumbing down of our population or whether performing arts repertoires have become stale or their  performance levels waned are irrelevant issues for downtown leaders who want to enhance their central social district functions by building a stronger entertainment niche
  7. What is important are the changes in arts audience behaviors. They increase the uncertainty of existing arts organizations’ earned incomes and definitely will be affecting the economic feasibility of projects  to create new formal entertainment venues. Creating such formal arts venues is seldom associated with cheap capital costs
  8. Regarding the new projects, given the probable capital expense, the uncertainties associated with earned income and the inherent tendency to best serve an audience that has a significant amount of discretionary dollars to spend, some downtown leaders might do well by considering other types of projects to enhance their entertainment niches. These projects might take the form of new vibrant public spaces that are: open to all;  where plays and movies can be shown, but focused mainly on maximizing informal entertainment opportunities; either free or low-cost; designed  to capitalize on people watching; where participants are both the performers and the audience.

Endnotes

1. Americans for the Arts. National Arts Index: 2013 Report, pp.149,  p.67

2. Ibid., p.64

3  See: http://www.businessinsider.com/zuckerberg-why-facebook-bought-oculus-2014-3#ixzz2x1lgtLVO

4.LaPlaca Cohen/AMS Planning & Research Corp, Culture Track 2011 Market Research Report, pp.87, p.7

5. http://www.boxofficemojo.com/yearly/

6. Pew study cited in:https://www.ndavidmilder.com/wp-content/uploads/2012/05/trends_p1_films_08.pdf

7. The data in this section are drawn from  Theatre Facts. It has been published annually by The Theatre Communications Group since 2000. See the 2012issue at:http://www.tcg.org/pdfs/tools/TCG_TheatreFacts_2012.pdf

8. See for example: http://classicalvoiceamerica.org/2014/03/07/campus-concerts-rebuff-notion-of-classical-decline/  and http://www.city-journal.org/2010/20_3_urb-classical-music.html . Thanks to Andy Menshel for bringing them to my attention.

© Unauthorized use is prohibited. Excerpts may be used, but only if expressed permission has been obtained from DANTH, Inc.

Small Downtowns Succeed Not By Growing A Lot Bigger, But By Becoming A Lot Better

Posted by N. David Milder

Introduction

My work, a few years ago, on two small towns with populations under 2,800 has reinforced my feeling that our understanding of what makes a downtown successful is dominated by a paradigm that, while suitable for large districts, just does not seem to be as applicable to small or medium-sized downtowns. I fear that attempts to impose that paradigm on smaller downtowns have led to many dreadful revitalization strategies and plans. In this article I will work toward formulating my view of what the paradigm for a successful small downtown might be, hoping this exercise will stimulate other economic and community development professionals to follow suit.

The Successful Large Downtown Paradigm

Successful large downtowns, according to my understanding of the dominant paradigm, which I described in my 1987 article on downtown crime, have the following characteristics (1):

  • High Multi-functionality. They are multi-functional with a mix of attractive retail shops, restaurants, bars, coffee houses, professional offices, corporate offices, government offices, hospitals, courts, rail and bus stations, hair and nail salons, gyms and spas, museums, cinemas, concert halls, theaters, public spaces, residences, hotels, residential buildings, etc.
  • High Density. These functions are clustered in a dense, compact area and a lot of the development is vertical
  • High Pedestrian Traffic. The multi-functionality sparks a lot of multi-purpose visits and pedestrian trips. The district’s density and compactness help make them comparatively short and easy
  • High Energy and Fast Pace. The density and wide choice of activity venues combined with the strong pedestrian flows, stimulates a sense of high activity and fast pace that at times is even deemed electric or exciting.

Trying to Apply It to a Small Downtown

Size is the defining difference between large and small downtowns. Since multi-functionality and density have almost definitional associations with size, they may be expected to be lower in smaller downtowns. Similarly, pedestrian traffic may be expected to be much lower in smaller downtowns because of reduced multi-functionality and density as well as probably smaller trade area populations. Levels of energy and pace can also be expected to be low in small downtown since they are dependent on multi-functionality, density and pedestrian traffic. However, saying all that leaves little or no basis for explaining why a small downtown is successful and not just small: it has, almost by definition, far less density, multi-functionality, pedestrian traffic, far less energy and a much slower pace that the largest downtowns. What is it then that makes a small downtown successful?  Applying or trying to tailor the large downtown paradigm to the small certainly does not seem to get anywhere meaningful.

The Importance of an Attractive Downtown Setting with Fewer People

Searching for a better approach to understanding the major characteristics of a successful small downtown, I happened upon the results of a large national survey done for the National Association of Realtors that showed 18% of the respondents preferred living in small towns and 22% preferred living in rural areas (2). That means that very significant portions of our population prefer living in towns and areas that are not densely populated or developed. They do not like crowds or living close to other people. To me, these facts suggest that whatever the economic needs of a small downtown, if they are met with too much population growth and increased development density, then the downtown probably will not be considered a success in the eyes of its local user population. Of course, too much density and growth can also be of great concern to large downtown user populations. Where they are very likely to differ is in the definitions of how much is “too much.”

The Importance of an Attractive Downtown Setting with Low Energy and Slow Pace

Why else do people prefer the less populated towns and areas?

The streets of the smaller downtowns I like and want to return to have a charm and slower pace of activity than the large downtowns I enjoy. Visiting them I do not see the high volumes of pedestrian traffic or feel the frenetic pace and electric energy that I often get on streets of Manhattan, Chicago, Boston, Philadelphia, London or Paris.

Instead –leaving festivals and special events aside– the setting is more languid, devoid of passing platoons of pedestrians, while filled with charmingly attractive buildings, shops, landscapes and public spaces. It is easy to walk on uncrowded sidewalks and safe to cross the streets/roads. There is always at least one good and popular place to eat and drink. Finally, the people we encounter in the shops, restaurants and public spaces are friendly – and often interesting characters. In these likeable small downtowns we feel comfortable and relaxed, yet entertained and/or amused.

Moreover, my experience suggests I am far from alone in having this viewpoint. Most of the reasons I’ve heard people give for visiting a small town or a rural area are on the order of “getting away from it all,” or enjoying a slower and more relaxed pace in a scenic setting. I do not think many people go to a small downtown in search of a lot of “action!”

Furthermore, my numerous, if admittedly non-systematic conversations over the years with residents in the small towns I have either visited or lived in, suggests that they highly value the low energy and slow pace of the communities in which they reside.

Energy and pace can be thought of as continuums with strong and weak manifestations that are displayed in inverse patterns in large and small downtowns.  Though larger downtowns are better known for their fast pace and the sense of excitement that their users enjoy, they also often have charming public retreats where people can go to engage in a more comfortable, languid and relaxed pace. For example, in New York City are the famous and adored Central Park and 250 much smaller “pocket parks,” among which Paley Park is perhaps the best known. Conversely, we sometimes find an air of excitement and a faster pace in these small downtowns, not on the sidewalks, but in a public space and/or inside a bar or restaurant that functions as the community’s “village well,” its gathering spot.

Walkability

My field visits across the country, conducted over many years, suggest that:

  • In many small and medium-sized downtowns, pedestrian counts may be just a few hundred, or even far less, per day. Without doubt, even if these downtowns are completely revitalized, they can never potentially reach the pedestrian counts or waves of walking platoons that can be attained in denser urban downtowns. (Tourist downtowns might be exceptions.) Density provides an upper bound on a district’s potential pedestrian traffic, but does not in and of itself guarantee the achievement of those levels. This was amply demonstrated by the barren sidewalks of too many downtowns in the 1980s and 1990s that used office development as their engine of economic revitalization
  • In many small and medium -sized communities, even if all the shops were attractive and interesting, there still would not be enough of them to generate lengthy pedestrian trips or a lot of strolling and window-shopping. As Bill Ryan, a well-know downtown analyst at UWEX’s Center for Community and Economic Development, has noted:  ”Most rural small downtowns are anchored by a c-store, a couple of bars and a couple of restaurants, beauty salon, accounting/tax/insurance, and other services.  Not much to stroll through” (3)
  • Many of the successful stores I have observed in these small downtowns, even though they may be relatively small, function as retail destinations – they are not “found” by shoppers strolling through town. Instead, shoppers know them and go directly to them, usually with a specific type of purchase in mind. The pedestrian parts of their shopping trips are often largely confined to walks from and back to their automobiles. This importance of the automobile should not be surprising in rural environments where 50-minute auto trips to jobs and regional shopping centers are normal and where getting to local schools, churches, friends and neighbors usually require the use of a car.

Kaid Benfield’s makes an important distinction between walkability and density. (4) Following that line of thought, it seems to me that density can facilitate and stimulate pedestrian traffic, but walkability plainly entails other people friendly dimensions such as the ease, pleasantness and safety of walking. Walkability is required by downtowns large and small, dense or less dense, whether the pedestrian flow is large or small.

Economic Viability: The Need for a “Right Fit” Strategy and Its Challenges

Any successful downtown will need to be economically healthy. Economic strength generally does correlate with variables connected to size. Consequently, small downtowns are caught in a conundrum: they need enough economic strength to be attractive, viable and successful, but not so much that it threatens the small town and small downtown characteristics that attract its user population. This requires a kind of careful calibration that meshes easily into a “right fit” type of growth strategy.

This means that there is probably some opportunity for growth, but it will be limited in terms of the new buildings and their associated roads, employees and residents.

Of probable greater importance is the improvement of the attractiveness and functionality of existing downtown spaces, making current merchants better business operators and recruiting new capable business operators. This will probably entail:

  • Stronger brick and mortar convenience operations
  • Local merchants learning to be more e-commerce capable
  • Looking for and realizing opportunities to recruit or grow local e-merchants who can sell in a national or international e-marketplace. 

Here are two firms that sell to historical reenactors, movie companies, etc., that are good examples of firms located in small towns that have Internet and catalog sales that are far above what their trade areas could support:

  • Jas. Townsend and Son is located in Pierceton, Indiana, a town with a population in 2010 of 1,095.  They help “historical reenactors, movie makers, theatrical companies, pirates, and regular people find items including clothing, tents, books, knives, tomahawks, oak barrels and lots of other goods appropriate for 1750 to 1840 – especially the American Revolutionary War and War of 1812.”
  • Schipperfabrik is located in Columbus, WI, population 4,991. It “is the world’s largest and most diverse manufacturer and supplier of WW1 Uniforms, equipment and insignia. We pride ourselves on our world class, museum grade reproductions, all made based on original specifications and original pieces.”

Of note is the fact that both firms manufacture much of the merchandise they sell online. While retail and restaurants often take center stage in small downtown revitalization efforts, firms providing blue collar jobs have usually been the economic cogs of small towns. It’s time for more attention to be paid to them.

Creating and implementing an effective right fit economic development strategy will probably be very challenging tasks for small downtowns. These tasks will require an array of sophisticated skills in both planning and execution as well as a level of financial resources that are well beyond what most small towns can afford. This is further evidence that, as Andrew Dane and I argued in a previous article, revitalizing small town downtowns can be very difficult because the challenges they face are often surprisingly complex, while they have meager financial and personnel resources to spend on their resolution or amelioration. (5)

My Take Aways

Based on the above analysis, I’ve come to the following take aways from my reflections about successful small downtowns:

  • There are no linear relationships between greater density, more multi-functionality and higher pedestrian counts and having a successful downtown. Small downtowns succeed not by getting a lot bigger, but by becoming a lot better 
  • Critical to the success of a small downtown is its ability to comply with its user population’s preferences for attractive places with relatively few people, lower energy levels and a relaxed activity pace 
  • Successful revitalizations of small downtowns may strengthen and increase the densities of various economic functions and its consequent foot traffic, but not to anywhere near dense urban levels and, most importantly, not to where the downtown’s relaxed and languid pace of activity is significantly altered or endangered 
  • This is the nub of the challenge in small downtown revitalization efforts: how to right fit increased economic activities and development so that they meaningfully strengthen the downtown, while not violating all the things that its user population values about it, e.g., its charming appearance, slower pace, lower energy, and uncrowded ways of doing things
  • In small communities, strong pedestrian activity is neither to be found nor valued in the local culture, nor easy to generate. A walker friendly downtown is still needed, not  to stimulate highly increased pedestrian flows, but to maintain the downtown’s easy and relaxed pace of activities 
  • Of course, a small downtown might indeed become much stronger economically through a lot of growth, but then the question of whether it is still small is likely to emerge… and generate political conflicts
I do not think I have provided here the full answer to the question of how, besides the dimensions associated with size, successful small downtowns differ from successful large downtowns, but I feel confident that I am on the right road.
Acknowledgements: I would like to thank Mark Waterhouse, Bill Ryan, Andrew Dane  and Laura Krakoff for their helpful comments and edits on an earlier draft of this article.

Endnotes

  1. N. David Milder, “Crime and Downtown Revitalization,” Urban Land, Sept. 1987, pp. 16-19 DT Crime Article
  2. Belden Russonello & Stewart LLC, “The 2011 Community Preference Survey: What Americans are looking for when deciding where to live”, Analysis of a survey of 2,071 American adults nationally conducted for the National Association of Realtors. March 2011, p. 17
  3. In a telephone conversation and comments on an earlier draft of this article. See also: Bill Ryan, Beverly Stencel, and Jangik Jin, “Retail and Service Business Mix Analysis of Wisconsin’s Downtowns,” Center for Community & Economic Development, University of Wisconsin – Extension Staff Paper, Sept. 1, 2010
  4. Kaid Benfield’s Blog, “For walkable cities, it’s not about the density – it’s about finding the right kind of density,” Posted March 4, 2013 on Green Enterprise, Living Sustainably
  5. N. David Milder and Andrew Dane, “Some Thoughts on the Economic Revitalization of Small Town Downtowns,” The Downtown Curmudgeon Blog,   Blog article link

Helping Independent Downtown Merchants Engage Effectively In E-Marketing: Part 2

Introduction

This is the second of a two part article. Part 1 can be found at http://tinyurl.com/bxhdx8a

Over the past year, DANTH Inc. has experimented with such social media as Facebook, LinkedIn, Twitter and Pinterest and revamped our website, blog  and email program. To support this effort we did a lot of research on what the various e-marketing tools do best and the challenges small firms like ours have in using them. In this two-part article I would like to share with the downtown revitalization community what we learned from our e-marketing overhaul, so that more independent downtown merchants (e.g., retailers and restaurateurs) might make an effective transition to e-commerce.

What we learned was the importance of an analytical process able to identify the e-marketing tools that will most effectively use an organization’s scarce resources to achieve critical marketing objectives. This process:

  • Starts off by looking at and prioritizing the organization’s marketing objectives
  • Then matches them with the e-marketing tools (e.g., website, emails, Twitter, Facebook, blog, etc.) that can best achieve each of those objectives. These two topics were covered in Part 1
  • And next selects those objective-matching tools that  can be implemented, because the organization has the required financial resources and either has or can acquire the needed skilled employees. This topic will be covered here in Part 2.

Selecting the objective-matching tools that  can be implemented, because the organization has or can hire the required resources

The types of resources required to use a particular e-marketing tool will vary by the package of objectives it is targeted to achieve and the amount and complexity of the usages that are required to achieve them. In my field observations, this is the second area where small merchants are likely to encounter problems — or have them made by consultants who just focus on the mechanics of using the e-marketing tools with which they are enthralled.

In Part 1, I argued that “being found” online is probably the e-marketing objective most independent downtown merchants should focus on first. The initial inclination of these merchants – or their formal or informal “consultants” – might be to create a complex website with many pages, a full catalog of its merchandise, a matching e-store purchasing capability and to fill the site with lots of short marketing movies. Nonetheless, many small firms plainly lack the resources for such a robust effort and, more importantly, they probably do not need it to accomplish their e-marketing objectives.

Here are three brief case studies DANTH encountered over the past few years to demonstrate this point

The High Effort E-Store For A Fast Food Shop. Last year, in a NYC neighborhood that had sustained impressive economic growth through the Great Recession, I interviewed a fast food operator in the 6-10 employees category, who was very interested in penetrating the rapidly growing nearby office worker and high rise residential markets. Though both market segments were strongly represented within a 5-minute walk of the eatery, neither accounted for many of the pedestrians passing by or entering its doors. The owner was interested in creating a website where office workers and residents could find and learn about the eatery and its menu, order from the menu and daily specials, have their orders charged to their credit cards, and have their food delivered to their workplaces or homes.

This small merchant was unaware of the intricacy and full costs of such an operation. He was expecting to pay consultants to set-up his website, merchandise basket and credit card charging. However, he did not foresee that he would also need:

  • Someone to update the “specials” daily on the website and to periodically keep the overall menu up to date. Updating and maintaining a website can easily eat up far more resources than creating it
  • Additional part-time employees to process the lunchtime orders
  • Additional part-time employees to deliver the ordered food
  • Someone to provide the copy for his website pages
  • Someone to provide the photos and other graphics for the website pages
  • To spend a lot more of his time and money  putting together the needed new team and then managing a complex new operation.

A year later, this small operator has no website, but has affiliated with a telephone-based service that takes orders and delivers food if customers know about the delivery service and call them. The eatery also does have a simple “name, rank and serial number” page on its BID’s website, a Facebook page with one like and no postings and is listed on a few special websites such as Foursquare. Right now, not much info is to be found on the web about this eatery. It still needs a much stronger “being found” on the web capability.

This could be accomplished by a modest website, without the e-store. It would successfully provide name and contact information as well as information about the menu and reasons to patronize this eatery. Such a website would provide an affordable and acceptably better, if not optimal, penetration of the office worker market. Website visitors, for example, could see the full menu and be invited to visit or phone the eatery to learn about and order the daily specials. An even simpler solution would be a substantial improvement of the information provided on the eatery’s BID web site page, combined with a campaign to get it listed on more special web pages.

The prime take aways from this case study are that:

  • Small merchants should be wary of complex uses of e-marketing tools that are beyond their resources
  • More modest deployments of these tools are often more viable and ultimately more effective
  • BID/SID web pages can be very useful for a small merchant if they do more than just provide the store’s name, contact information and business category. They need to also provide space for information about the shop’s merchandise and to tell the merchant’s story. This is the prime way that BIDs can help their merchant members gain a viable e-commerce presence.

The Low Effort Ice Cream Parlor. In Part 1 of this article, I mentioned a very popular ice cream parlor in a New York City neighborhood. It is a unique and highly regarded operation that has been around for over 50 years and, for decades before that, it was an ice cream parlor under a different owner and name. Today, it is “a functioning antique,” with an old soda fountain, tin ceiling and marble small tile floor. It makes its own ice cream and is famous for its fresh home-made whipped cream.

When I spoke to the owner about his e-marketing activities, he smiled, reporting that he knew nothing about such things, but his workers, most of whom are high school or college students, had created a Facebook page that gathered 8,000+ likes. He felt Facebook definitely had helped generate some additional sales. The shop occasionally offers special flavors only to its Facebook page visitors, with the young workers doing the postings, and they are always quickly sold out. The owner said, with another smile and shrug of his shoulders, that he would like to do more with Facebook, but…. My guess is that the shop was doing well enough that there was no great need now to do more online marketing.

Googling the shop’s name showed that this ice cream parlor had a lot more going for it than just its Facebook page.. The search showed that its authentic, old time story and favorable customer reviews and contact information were available on a whole slew of specialty web sites such as: google.com, plus.google.com, www.yelp.com, www.facebook.com, patch.com, newyork.seriouseats.com, www.zagat.com, www.urbanspoon.com, newyork.citysearch.com, untappedcities.com, www.tripadvisor.com, www.delivery.com, www.menupages.com, www.bridgeandtunnelclub.com, events.nydailynews.com, newyork.grubstreet.com, www.scooponcones.com, chowhound.chow.com, www.flickr.com. That these positive reviews were coming from customers and not the parlor’s ownership enhances their credibility and power.  Aside from the Facebook page, all the other listings, came about organically without any effort by the ice cream parlor owners or employees.

The net result is that this ice cream parlor, with little effort on its part, can be very easily found on the Internet and its story is certainly being told. The very nature of its limited menu means that people do not really need to know much about all the flavors to be convinced they should visit the shop. Consequently, it probably can do fairly well without its own website. On the other hand, given its ability to easily attract a significant number of Facebook likes, it also might easily garner many Twitter followers and  also use Tweets to inform followers of special flavors or coupons. It might then also use its Facebook and Twitter capabilities to further cultivate its existing store apostles –frequent customers who advocate a shop within their social networks– and garner new ones.

This ice cream parlor had very substantial name recognition and a bevy of store apostles well before or separate from any of its e-marketing activities. The strength of this non-electronic customer network substantially eased the challenge and costs of collecting 8,000 Facebook likes. A new ice cream parlor would need to expend a lot of resources to get enough Facebook likes to make its use worthwhile. The same is true of using Twitter. Indeed, one might ask if the use of these social media is cost effective for small merchants with say 30 transactions or less a day. Might they achieve the relationship building and customer service functions much more effectively and efficiently by focusing on face-to-face interactions? However, they still would need to be found online.

One thing the ice cream parlor owner probably should do is to have his young, Internet capable,  employees check their listings on the special web pages to make sure they are accurate and up to date. Research has shown that this is where most small businesses are apt to  fall down (1). Another thing he certainly needs to do is to keep hiring young employees who know how to use Facebook.

The prime take aways from this case study are that:

  • Strong small businesses that have been around for a while probably will have strong assets that can make their entry into e-marketing a lot easier than start-ups  or weaker operations
  • A robust easy-to-be –found on the Internet capability does not always require a complex website if the merchant has sufficient positive listings and reviews on the special website pages and a narrow range of products are offered
  • These special website pages are too often overlooked, especially by the food related operations that they so frequently cover and that account for such a high proportion of downtown businesses
  • Young, internet savvy, employees can often be a source of the internet related skills a small merchant lacks, but needs.

A Well-Calibrated Retail Website. A toy retailer has two brick and mortar stores in the Chicago suburbs and a very interesting website. The retailer quickly appears at the top of searches for toy stores in its two towns. Its website does not present a catalog of all of its toys, but has a page that shows all the toymaker brands it sells with their logos. It does not have an e-store that sells scads of different toy products online. Its e-store is limited to selling just one new toy a week. Customers can sign up to get the “new toy” newsletter each week via email. The website has short movies, one to two minutes long, for each of the new toys. The website shows that the “new toys” are sold out every week. That they are sold out so often strongly suggests that the retailer is building up a core of repeat purchasers. Repeat customers are the makings of a band of store apostles, a solid revenue stream and a strong word of mouth network.

The website reportedly was put together and is maintained by a relative of the store’s owner who is skilled in developing websites.

It also has a Facebook page that has garnered 604 likes. People in the 35-44 year old age group are its most frequent visitors and they are most likely parents.

I do not know what this merchant’s e-marketing objectives are, but I hope to connect with him in April, when I am again in the Chicago area. I am particularly eager to find out about their website’s impact on their brick and mortar store’s customer traffic and sales.

The important take aways from this case study are:

  • The one new toy a week strategy is a great example of how calibrating a small firm’s deployment of an e-marketing tool to its level of available resources can help assure its successful use
  • The site appears to be meeting all of the “being found” challenges, while also building a core of store apostles and making significant online sales
  • Family members can often be a source of the internet related skills a small merchant lacks, but needs.

How Can Downtown Organizations Help?

The transition to e-marketing calls upon small merchants to innovate, something most of them feel very uncomfortable doing. DANTH’s experience with trying to get them to improve their facades suggests that many more – but not most – would innovate, if innovating can be made easier for them  to do (4). This means providing them with needed information in easy to digest terminology and helping to bring the costs of their innovation down to affordable levels.

Some questions to which they may need answers are:

  • What can they do and accomplish with e-marketing, what are the benefits and how much will it cost?
  • Are there local merchants who have made this transition who they can talk to?
  • Which types of skilled people will they need help from to get into e-marketing? Where can they find them? Or who can do a whole package for them?
  • How can they afford to create and maintain the e-marketing effort?

Here are some actions downtown organizations and other EDOs might take:

  • Post a 20-minute webinar or podcast on the organization’s website — that the merchants can access at their discretion, when they have sufficient time —  focused on what small merchants can do with e-marketing, its benefits and costs
  • A tie-in to SCORE or other free or low cost consulting assistance to help clarify the connections between the e-marketing tools and the frm’s overall marketing objectives
  • A mentoring program that connects e-marketing “newbies” to local merchants who have successfully made the transition
  • Provide a vetted list of technical assistance providers
  • Most importantly, offer each merchant who lacks a website a web page on the organization’s website that can provide name, contact information, information about products or services sold and the firm’s story.
  • Perhaps the downtown organization can charge a fee for an “enhanced page”, i.e., updating, writing copy, supplying graphics, creating movies, etc., that would be meaningfully lower than what the merchants would have to pay if they did it by themselves
  • Provide website consultants to merchants at a lower than market rate cost, because the downtown organization can aggregate member demand and “buy in in bulk”
  • Provide an expert, on a reduced fee basis, who can help merchants get listed on special web pages. This is something different than search engine optimization
  • Use a downtown organization’s strong Facebook and Twitter presences to help the merchants get sufficient likes and followers to be able to effectively use them. It is getting followers, not setting up and using the Facebook or Twitter page that now impedes most small merchants from effectively using these e-marketing tools
  • Set up an “e-department store” where merchants, like the toy store described above, would only sell a few items. A dedicated and limited e-department store may be a good way to strengthen a downtown niche.

N. David Milder

Acknowledgement: Thanks to Mark Waterhouse of Garnet Consulting Services for his input and editorial assistance.

Endnotes

  1. MarketingCharts staff, “1 in 2 Small Businesses Fail to Update Their Online Listings, Find Inaccuracies”  February 6, 2013,  http://tinyurl.com/atexhky
  2. Mitch Lipka, “These Big Companies Are Abandoning Twitter And Facebook For Customer Service” Business Insider 1/18/13   http://read.bi/11EbziS
  3. Findings of a survey of small businesses conducted for the Center for the New West as summarized in an email by the center’s former CEO, Phil Burgess
  4. N David Milder, “BEING A DOWNTOWN CHANGE AGENT: Facilitating Change for Downtown Business Operators” June 3, 2007, https://www.ndavidmilder.com/category/formats-facades-signs

Invitation: Please join me at Session S681: Integrated Small Town Planning at  APA’s 2013 National Planning Conference in Chicago, April 17, 2013, at 10:30 a.m. I will be presenting along with Andrew Dane of SEH.