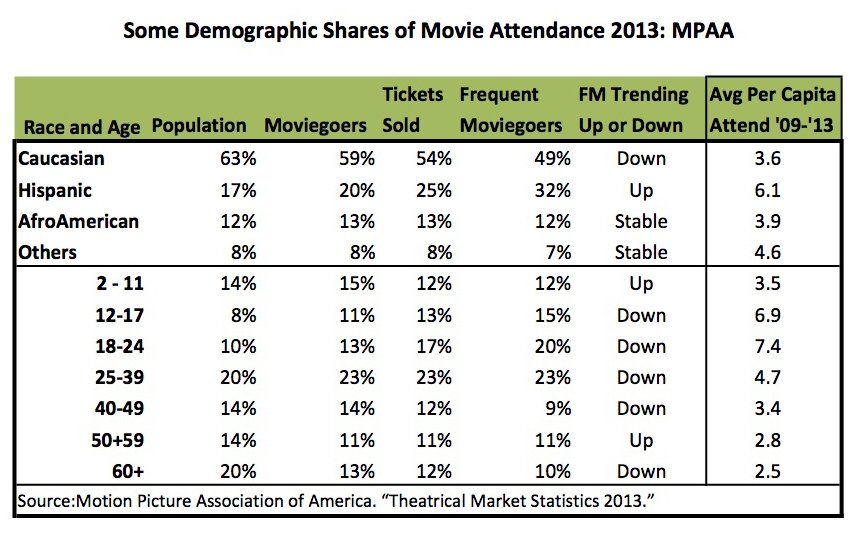
Introduction
Informal Entertainments in Public Spaces. A major goal of this series of articles on downtown entertainment venues is to demonstrate that great public spaces and third places can be very strong components of the entertainment niches that are now critical to the magnetism, health and well-being of our downtowns. Too often, when downtown leaders want to create or strengthen their entertainment niche, they look only at formal entertainment venues such as PACs, museums, concert halls, theaters, arenas, etc. Ignored are the entertainment values of great public spaces that, compared to the formal entertainment venues, often can attract larger audiences, cost less to operate and maintain and have bigger economic impacts on the surrounding downtown areas. These are especially important advantages in small and medium-sized downtowns that typically have weaker customer traffic generators and fewer financial resources.
Great public spaces are being described as informal entertainment venues because:
- They provide opportunities for guests to engage in activities that they enjoy and that also interest and amuse nearby people-watchers. In contrast, formal entertainment venues guests are almost always a passive audience
- Yet, informal venues often also provide a calm refuge from a downtown’s hustle and bustle
- They facilitate conversation and social interaction among attendees. In many types of formal entertainment venues guests must act as a whispering, if not completely quiet audience
- Their events are held in informal settings, usually outdoors or within a temporary structure (e.g., a tent), often using temporary stages and screens. In contrast, formal venues have buildings, often lavish, with a lot of fixed infrastructure such as stages, screens, seating, etc.
- Access to them is usually free and when there are charges for such things as equipment rentals and rides, they are reasonably priced. In contrast, formal venues usually charge admission fees, and frequently they are unaffordable for 60% to 80% of American households
- Guests usually can time their visits to informal venues to suit their own schedules; with formal venues potential guests must adjust their schedules to the timing of the event they want to attend.
The Park. I have been visiting New York City‘s Bryant Park for about 34 years. In my opinion, it is the quintessential informal entertainment venue. A lot can be learned by taking a close look at it. I certainly did.
The park was not always a success. Back in the 1970s and early 1980s, Bryant Park was such a notorious place for drug use and sale, prostitution and associated crimes that the police, at one point, completely closed it down. Landlords and real estate brokers then involved in properties facing the park reported that its problems and ill repute made leasing commercial spaces very difficult and suppressed rents (1). During those troubled days, Bryant Park stood out as the paragon of a failed public space, a stark demonstration of what can happen when a public space, even in a great location, is badly managed, poorly designed and unsuccessfully programed. In contrast, today, Bryant Park is a paragon of a successful public space, deservedly acclaimed, extremely popular and a model from which others can learn.
Many factors were involved in the park’s astonishing turn around, e.g: the involvement of important actors from the private and nonprofit sectors; the creation of a nonprofit organization with a very effective management team, under the leadership of Dan Biederman, to revitalize and manage the park; the use of novel revenue sources of which BID assessments were just one component; effective plans for both physically improving the park and programing it into an extremely attractive and very strong informal entertainment venue.
Its Strong Location
Bryant Park occupies some of Manhattan’s choicest real estate: 9.6 acres in the midtown CBD that are bounded by Fifth Avenue, Avenue of the Americas, 40th and 42nd Streets (2). The main informal entertainment functions of the park, that are the focus of this article, occur in the approximately six acres located behind the large and famous Beaux Arts building of the Main Branch of the New York Public Library. It sits on Fifth Avenue between 40th and 42nd Streets. The library annually draws about 2.3 million visitors (3). Underneath the park, the library has about 40 miles of shelf space for its books.
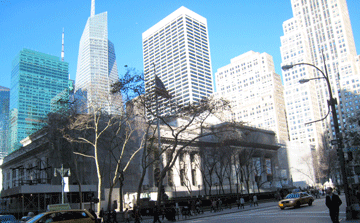
Figure 1. Major buildings near Bryant Park
Three entrances to the subway system abut the park and provide access to five train lines.
The surrounding blocks are densely filled with high rise office buildings — many of architectural merit — and a large number have ground floor storefronts. About 78,000 people are employed within a 5-minute walk just of the park’s 42nd Street and Avenue of the Americas entrance; within a 10-minute walk employment reaches to about 315,000 (4). Also, there are 29 hotels within 0.2 miles of the park (5). Times Square is within a three minute walk, while the Grand Central Terminal, Macy’s and Rockefeller Center are all within roughly six minute walks (6). The park’s management estimates that, on an average weekday, about 250,000 people walk by on the sidewalks of the four streets that surround the park; a significant number are probably tourists.
The park has become so successful that the Bank of America Tower proudly proclaims its address to be One Bryant Park, and a new hotel is named the Bryant Park Hotel. Back in the early 1980s, this simply would have been unthinkable!
A strong location was not enough. Because of the park’s location, it is surrounded by a huge pool of potential visitors who are either within easy walking distances of the park or walking by its perimeter on their trips to other destinations. The flow of pedestrian traffic near the park during its troubled days was probably lower than today, but still relatively strong when compared to downtown locations in other cities. What turned the tide was not the new and renovated office buildings and hotels that have appeared since 1992 — they came after the park became a success– but what was happening in the park, the new “products” it offered and how they were “packaged.” That’s what drew all the visitors into the park and encouraged them to stay. A superb location was not enough. Obviously, few downtowns in America have similarly dense locations, certainly not those in small and medium-sized communities. Yet, the success of Bryant Park demonstrates the critical importance of the variety and quality of the products an informal entertainment venue offers, be it in dense Midtown Manhattan or in a small or medium-sized downtown.
The Park’s Informal Entertainment Venue Features
It’s an attractive and welcoming place to sit, relax and observe. Many New Yorkers and many tourists often appreciate opportunities to have a respite in a green open space from the city’s high energy and rapid pace of activities. Other park visitors may seek a pleasant place to spend their down times between appointments. Small towns, in this respect, are like Bryant Park; they are places where people go to live or vacation in order to find refuge from urban hustle and bustle.
Bryant Park responds strongly to those needs. For example, the park’s management reports that in a “survey conducted in the summer of 2013, visitors to the park consistently noted the park’s beauty, and used words like ‘oasis,’ ‘wonderful,’ and ‘lovely’ to describe the park.” With 4,200 French park chairs, 800 French café tables, and 55 umbrellas Bryant Park offers visitors ample places for them to sit comfortably in a very pleasant green setting. Moreover, they can chose to sit on the open one acre lawn or shaded under one of the 220 London Plane trees. Visitors can also enjoy the park’s carefully designed and maintained greenery that features 75 species of plants. Visitors are also able to easily access the Internet since the park is a WiFi hotspot. Significantly, the park has a far too often undervalued urban feature: clean, safe and easily accessible bathrooms.
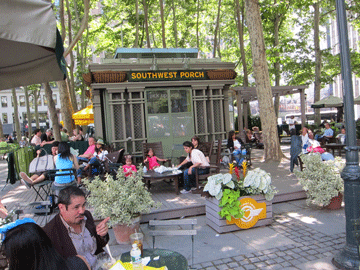
Figure 2. Sitting in the shade with places to buy food nearby

Figure 3. Sitting in the sun on The Lawn
The people sitting will naturally be observing and probably people watching – ready to be entertained by what is happening within their view sheds in the park. This is a critical audience building step for most informal entertainment venues.
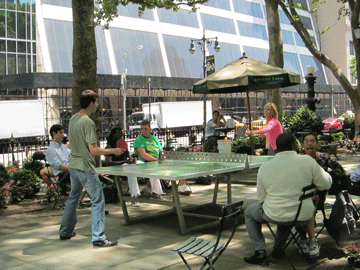
Figure 4. Ping Pong players
A substantial portion of the park’s infrastructure is dedicated to facilitating visitors’ engagement in activities that they can enjoy – while entertaining the people who may be observing them. Bryant Park offers an extraordinary range of activities that visitors can engage in – while others can watch them “performing:”
- There are numerous places where people can get food and drink in the park ranging from the white table cloth Bryant Park Grill to several Witchcraft kiosks specializing in sandwiches and salads, coffee, frozen yogurt or gelato
- Visitors can use, at no cost, 35 strategy, board, word, party and card games to entertain themselves and their friends or relatives. The park also runs “game socials” and mah jongg clinics
- The Chess Area provides visitors with chess and backgammon boards for free
- On The Green, visitors, at no cost, can practice their putting or play kubb, a game from Sweden that resembles lawn bowling
- There is a playing area for pétanque, which is similar to boules and bocce. The park provides lessons and runs pétanque tournaments
- A ping pong table is also available for visitors to use
- The “Winter Village at Bryant Park” features a 170′ x 100′ skating rink (admission free) on its lawn and 125 boutique-style shops in the park’s tree-lined allées. The winter ice rink’s attendance peaks between Thanksgiving and Christmas, and reached over 261,000 total skaters in the 2012-13 season
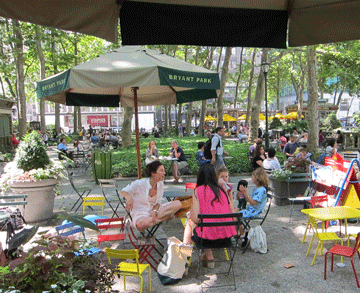
Figure 5. Children’s Reading Room (parents allowed)
- A “Reading Room” provides opportunities for visitors to find and use reading materials. There also is a special Reading Room area near the carrousel for children with appropriate books and child-sized furniture. This attention to detail in meeting potential user needs helps make the park such a standout
- Le Carrousel is a popular ride for children and costs $3.00 per ride
- There are also Tai Chi, Yoga, fly fishing, fencing, juggling, knitting, modern dance and language lessons. The summer yoga series attracts about 800 guests
- NYC Audubon provides birding tours of the park. Having other expert organizations involved in an activity is a smart way to increase a venue’s attractions, while constraining costs. Small venues might want to look into this
- Dancing in Bryant Park – A series of social dance party after work in the late spring and summer
- The complete list of these activities can be found on the Bryant Park website at: http://www.bryantpark.org/things-to-do/grounds.html
The number, diversity and quality of these activity offerings are very impressive. Some have a uniqueness that is prone to arouse visitor curiosity. Several are sponsored, e.g., the Winter Village by Bank of America and the Reading Room by HSBC. The year round food and Winter Village retail operations also are revenue sources for the park.
As any longtime visitor will attest, the park’s management is constantly refreshing these offerings. It does not let the park’s success degenerate into a debilitating same-old, same-old staleness. Many downtown leaders elsewhere would do well to follow suit.
Numerous events are held, mostly after 5:00 pm, in Bryant Park using temporary structural assets and/or repurposing existing fixed structural features. Bryant Park’s management is masterful in the way it uses The Lawn and other parts of the park in many different ways over the course of a calendar year by deploying temporary structural assets. The Winter Village with its temporary ice skating rink and temporary boutique retail kiosk-like structures is the largest and most complex example of this.
Without having any formal permanent stage or any permanent fixed seating or a permanent movie screen, Bryant Park puts on a very diversified and appealing series of events, that includes:
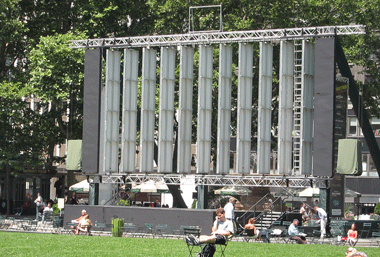
Figure 6. Temporary movie screen and stage
- The HBO Bryant Park Summer Film Festival presents 10 films on the Lawn using a temporary screen. It attracts about 9,000 guests. It is sponsored by Bank of America and three other corporations
- Several concert series over the spring and summer such as Bryant Park After Work. They use the Park’s Upper Terrace
- Plays such as the Bryant Park Shakespeare on the Upper Terrace Steps
- Dance recitals such as Bryant Park Presents Modern Dance on a temporary stage.
In other words, the park stages many events that are very similar in type, if not in scale, to those put on in the formal entertainment venues such as performing arts centers, theaters and concert halls, but in much more informal, lower cost to create and maintain, outdoor and temporary settings. In contrast, Millennium Park in downtown Chicago has the Jay Pritzker Pavilion designed by Frank Gehry that reportedly cost $60 million to build and includes 4,000 fixed seats plus a Great Lawn that can accommodate another 7,000 people (7). Many small and medium-sized downtowns might benefit by taking their cue from Bryant Park: to have a useful and affordable performing arts venue, they may not need to go to the expense of creating a PAC or renovating a theater if they can fully utilize their existing public spaces by multi-tasking them.
Bryant Park’s events help keep it and the surrounding area active after dark. Moreover, their diversity strengthens the park’s drawing power by offering potential visitors greater choice.
Comparing Bryant Park to Some Formal Entertainment Venues from a Downtown Economic Development Perspective
Downtown management organizations likely are interested in entertainment venues because of their abilities to attract and retain customer traffic and their positive economic impacts on their districts. These impacts may be on the demand for residential, office or retail spaces, retail and hospitality establishment sales and/or in the generation of jobs.
Attendance. The abilities of an entertainment venue to bring people into the downtown, keep them there or make them happy to be there are valuable assets for any downtown. Bryant Park is a very powerful attraction for Midtown Manhattan. According to its management, Bryant Park’s attendance now has grown to approximately 6 million users per year. Attendance peaks in the summer months and around lunchtimes. Average 1:00 pm weekday snapshot counts from April to October range from 2,100 to over 3,000 guests per day. One significant shift in attendance is that the percentage of women has come to exceed 50%, a good sign of a healthy park. A 2013 survey of park guests showed that about 30% were tourists. Given that many tourists are foreigners who may be hesitant to participate in a survey because of iffy English language skills, the park’s management prudently suggests this estimate should be treated with great caution. However, allowing for a large 33% margin of error would indicate that tourists probably account for 20% to 40% of the park’s attendance, which supports a less definitive, but still informative conclusion that tourists have a significant presence in the park. Furthermore, the park’s geographic location relative to Grand Central Terminal, the Public Library and Times Square argues strongly for a probable significant tourist presence.
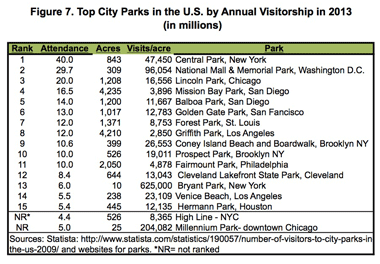
Comparisons with some other attractive and successful urban parks help show the strength and density of Bryant Park’s attendance. Among city parks across the nation, in 2013, Bryant Park was the 13th most visited. However, Bryant Park is, by far, smaller in acreage than any of the other top ranked parks in attendance (see Figure 7). Consequently, on a measure of attendance density Bryant Park far outshines all the rest with 625,000 annual visits per park acre (see Figure 7). Similar findings emerge if Bryant Park is compared to other NYC parks such as Coney Island Beach & Boardwalk, Prospect Park and High Line Park. Millennium Park in Chicago, another downtown park, comes closest, with 204,000 visits per acre, but it is still 67% below Bryant Park (8). NYC’s 843 acre Central Park (which is not in the Midtown CBD, but borders it) has many more visits than any other city park in the nation, but its ratio of 47,000 visitors per acre is 92% lower than Bryant Park’s (9).
Bryant Park’s attendance certainly more than holds its own when compared to the strongest formal entertainment venues in NYC’s outer boroughs. For, example, Yankee Stadium in The Bronx and Citi Field in Queens, homes to the Yankee and Mets baseball teams, had only 3.3 million and 2.1 million tickets sold in 2013, see Figure 8 below (10).
Looking at some of Manhattan’s strongest formal entertainment venues, Bryant Park again more than holds its own when it comes to attendance.

Madison Square Garden (MSG). Creating downtown sports arenas has often been a key objective for many big city downtown revitalization efforts, e.g., Charlotte NC and Newark NJ. Manhattan has one of the oldest, most successful and most famous: MSG. Reports indicate that attendance, after a three year $1 billion renovation, will return to the 4 million customers per year level that was reached as far back as 1995 (11). That means that Bryant Park attracts 50% more guests than the MSG.
Broadway’s Theaters. It also is interesting to compare Bryant Park’s attendance not to just one or two Broadway theaters, but to all of them. According to the Broadway League, the total attendance for all Broadway theaters in the 2013-14 season, which included 44 new productions, was 12.2 million (12). Bryant Park’s attendance equals about 50% of the patrons drawn by all of Broadway’s theaters.
Metropolitan Museum of Art (Met). The most recent attendance estimate we could find for this museum was 6.2 million visitors per year (13). That is the second highest in the world, after The Louvre, for an art museum. An unknown part of the Met’s 6.2 million visitors comes from guests at the off-site Cloisters that is 7.8 miles to the north. The Met’s attendance statistic is just three percent more than Bryant Park’s 6 million. This slight difference might be accounted for by, besides the Cloisters’ attendance, divergent counting and estimation procedures.
The Museum of Modern Art (MoMA). It reported about 3.0 million annual visitors, which is equivalent to about half of Bryant Park’s attendance (14). However, a potentially important new twist just has been added. For decades, MoMA’s Sculpture Garden was a favorite refuge of knowing New Yorkers and tourists to escape the Big Apple’s hustle and bustle. Access was tied to first gaining entry to the museum, which usually involved paying an admission or membership fee. However, in recent weeks, MoMA has made the Sculpture Garden open to the public, free of charge, starting at 9:00 a.m., before the museum’s official 10:30 opening, and closing at about 10:30 p.m., well after its normal closing times. Consequently, the Sculpture Garden has been turned into an informal entertainment venue and it will be interesting to see how this will impact MoMA’s overall attendance in the coming rears.
Lincoln Center for the Performing Arts (LCPA). It claims 5 million guests per year, which is about 20% lower than Bryant Park’s attendance. However, LCPA is not a pure play cluster of formal entertainment venues, especially after its recent $1.2 billion renovation program. LCPA reported selling 3.2 million tickets in 2012 (15). That suggests that the attendance of its formal entertainment venues only equals about 53% of Bryant Park’s annual attendance. Moreover, the formal entertainment venues accounted for about 64% of the LCPA’s claimed total visits. The other 36% might be explained by:
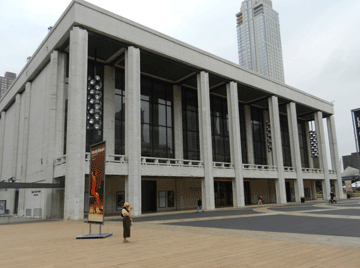
Figure 9. LCPA’s Koch Theater on a Friday afternoon – a lone soul in view
- The LCPA being the venue for New York’s Fashion Week (232,000 visitors), movie premieres and high profile corporate and media events
- The people on the 1,300 tours of the center given each year.
- Perhaps most importantly, the LCPA’s informal entertainment attractions. For example, the David Rubenstein Atrium is an indoor public space where visitors can sit, relax, get something to eat, attend occasional free concerts, have WiFi Internet access, obtain information about the LCPA, buy tickets and get on tours of the LCPA.. It reportedly has attracted well over 1 million visitors since opening in 2009. The LCPA’s recent renovations also produced several new outdoor public space seating areas such as Barclays Capital Grove, Illumination Lawn and the Credit Suisse Information Grandstand as well as several new restaurants. The LCPA also has a summertime series of 150 free outdoor concerts that utilize temporary stages and seating and are attended by about 250,000 people.
- The guests drawn by its educational programs.

Figure 10. LCPA’s “Grove” on that same afternoon – more people in view, others sitting under the trees
The Take Away. Downtowns prosper economically when they can agglomerate relatively large numbers of people. Although downtown parks are often thought of simply as attractive green places for folks to enjoy nature and get some fresh air, they also can be incredibly strong magnets that draw as many as or more guests than any PAC, arena, theater or museum. Bryant Park demonstrates this power more than any other public space I have visited. Its informal, entertainment opportunities, as demonstrated above, enable it to rival the magnetism of any world class formal entertainment venue.
Downtowns of all sizes might learn from this and ask if a public space offering informal entertainment opportunities might be a more powerful and easier to create attraction than a PAC, arena or theater they are considering.
ENDNOTES
1. During 1982-1984 I spent a good deal of time researching Bryant Park for Regional Plan Association’s Downtown Safety, Security and Economic Development Program. This research included frequent park visits, a survey of about 200 park users and interviews with park drug dealers and users, nearby landlords and commercial brokers active in the area
2. I want to thank Dan Biederman and Maureen Devenny of the Bryant Park Corporation for responding so graciously and helpfully to my request for statistical information about the park. Information about its activities and infrastructure also were garnered from its website and countless visits to the park over the past 34 years
3. Reported by library staff in a telephone interview
4. Employment data from the Census Bureau’s OnTheMap reports. The total number of people employed within five and 10 minute walks of the park is even larger because also measuring from the entrances to the east and south would include many more office buildings. Still, the numbers from just that one entrance are sufficient to demonstrate the point that a heck of a lot of people work within an easy walk of the park.
5. Based on a count of hotels reported in that ring by Yelp
6. Distances measured in Google Earth, walking time estimates based on a speed of 3 MPH
7. Wikipedia: http://en.wikipedia.org/wiki/Jay_Pritzker_Pavilion
8. Millennium’s attendance data from: MILLENNIUM PARK QUADRUAPLE NET VALUE REPORT, Texas A&M University and Depaul University, Summer 2011, pp.78, p.16. I want to thank Jamey Lundblad at the Chicago Department of Cultural Affairs and Special Events for sharing it with me.
9. Central Park Conservancy, REPORT ON THE PUBLIC USE OF CENTRAL PARK, New York, NY April 2011 pp.64, p.6
10. Attendance stats from: http://www.baseball-reference.com/
11. Thom Duffy, “Best Seats In the House: Nation’s Largest Markets Lead the Way In Venue Renovation Boom,” Billboard February 14, 2014. DANTH cited the 4 million attendance number in a report we did in 1995 for the 34th Street Partnership
12. The Broadway League, “BROADWAY SEASON STATISTICS AT A GLANCE” http://www.broadwayleague.com/editor_files/broadway_statistics_at_a_glance.pdf
13. The Metropolitan Museum Of Art, Annual Report for the Year 2012–2013, pp.153, p.6. and Hrag Vartanian, “2012 Museum Attendance Numbers Show a Diverse Global Art Scene” http://hyperallergic.com/68051/2012-museum-attendance-numbers-show-a-diverse-global-art-scene/
14. PricewaterhouseCoopers LLP, The Museum of Modern Art Consolidated Financial Statements June 30, 2012 and 2011, October 2012, pp.79 p.13 f
15. LCPA press release October 11, 2012: “Dedication of President’s Bridge on October 1, 2012 Marks Completion of Lincoln Center’s Redevelopment Project.”
© Unauthorized use is prohibited. Excerpts may be used, but only if expressed permission has been obtained from DANTH, Inc.