Posted by N. David Milder
Introduction
Part 1 of this article focused on showing how Bryant Park is a model informal downtown entertainment venue. That entailed describing how it performed three key functions:
- Providing visitors with a pleasant, green refuge from a downtown’s hustle and bustle
- Offering opportunities for visitors to engage in fun activities, with their resulting performances entertaining nearby people watchers
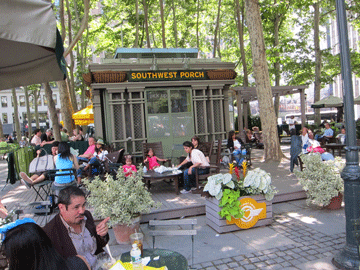
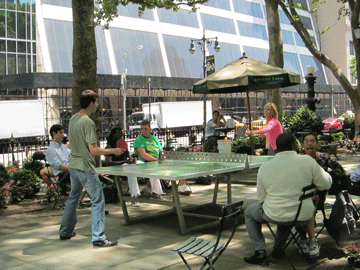
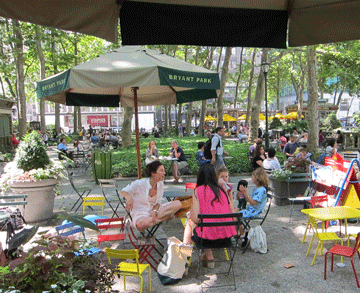
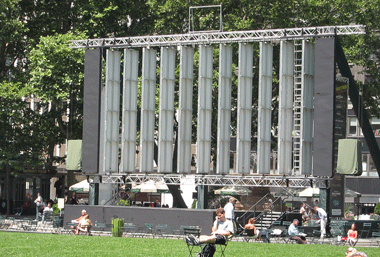
- Holding entertaining events for park visitors that are performed al fresco, often on “flexible use” locations within the park, using impermanent infrastructure, e.g., stages, movie screens, ice rinks, etc. Here the visitors are usually observersrather than participants (1).
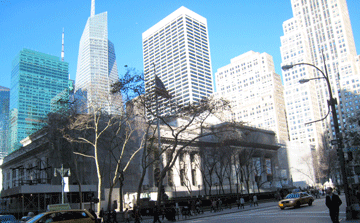
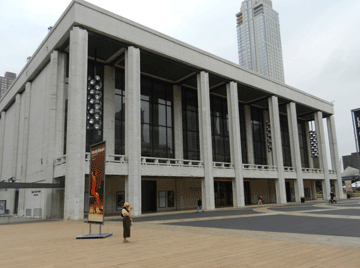
Part 1 also demonstrated that Bryant Park is a very strong entertainment attraction for the Midtown Manhattan CBD. In terms of annual attendance, it either closely rivals or surpasses such world-class formal entertainment venues as the Lincoln Center for the Performing Arts (LCPA), the Metropolitan Museum of Art (Met), the Museum of Modern Art (MoMA), Madison Square Garden (MSG), Yankee Stadium and Citi Field. Bryant Park’s magnetism demonstrates the powerful contribution an informal downtown entertainment venue can provide for a district’s entertainment niche as well as for its economic well-being.
Part 1 can be found at: http://tinyurl.com/kv36u4s
Here, in Part 2, the discussion will continue comparing Bryant Park to some formal entertainment venues from a downtown economic development perspective by focusing on:
- Bryant Park’s comparative strength as a tourist attraction in NYC
- Its user frictions compared to other major NYC entertainment venues
- The cost of its rebirth in 1992 compared to how much it cost to create 18 other significant entertainment venues — or to do a major renovation of them.
Because covering those topics requires about ten pages, I now am planning on writing a Part 3 of this article that will cover:
- A comparison of the total annual operating expenditures of the corporation that operates Bryant Park to those of the organizations that operate 20 other major entertainment venues located across the nation
- A look at Bryant Park’s economic impacts compared to those of other major entertainment venues. This comparison will occur within a discussion I have subtitled: Arts Venues’ Economic Impact Studies – Watch Out for the Horse Puckey.
Comparing Bryant Park to Some Formal Entertainment Venues from a Downtown Economic Development Perspective (continued from Part 1)
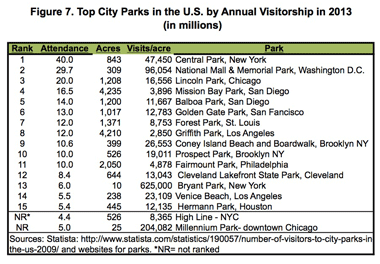
The Tourist and Local Audience Mix. Tourism is a major component of the New York City economy, as it is for many other communities across the USA — be they large or small. In 2013, for example, the direct spending of tourists in NYC was about $39.4 billion, with their overall economic impact valued at $58.7 billion (2). Consequently, Figure 11 takes a closer look at Bryant Park’s ability to attract tourists by comparing it to other major NYC entertainment venues. The selection of these comparable venues was simply a function of finding those for which the needed data were available (3). They were not easy to find. Also, the available data are not uniform: MoMA, the Guggenheim and the Joyce Theater categorize guests who come from beyond the NY Metro area as tourists, while the other venues define guests who come from beyond NYC to be tourists.
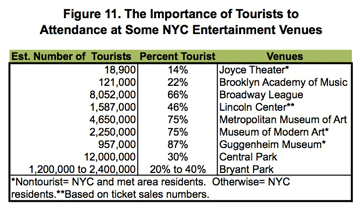 Compared to the Guggenheim’s 87%, the Met’s 75%, MoMA’s 75% and the Broadway League’s 66%, Bryant Park scores much lower on the percentage of its visitors who are tourists, 20% to 40%. In this regard, it stands with the other public park listed in the table, Central Park, which has tourists accounting for 30% of its annual attendance. However, when we look at the absolute numbers of tourists who visit each venue, it is Central Park that is the hands down winner with 12 million tourist guests annually. Bryant Park also shows significant strength: it probably has more tourist guests than the Guggenheim and likely is giving the formal entertainment venues at LCPA and MoMA a run for their money. Bryant Park is not just an “amenity” for people employed in nearby buildings or local residents.
Downtown entertainment niches can be strategically tasked to attract more visits and capture more dollars from tourists as well as from locals (e.g., trade area residents and people who work in the downtown). All too often, in our meetings in smaller downtowns that have had some measurable success with penetrating the tourist market:
- We’ve heard leaders describe the dissatisfaction local residents have with the downtown’s tourist-oriented retail, food and entertainment establishments that are seen as catering to outsiders rather than the local community’s tastes and needs
- There is an unspoken assumption that vibrant public spaces are really for “the locals,” while formal entertainment venues—e.g., PACs, theaters, museums, arenas – are much more capable of attracting tourists and consequently better able to bring in lots of outside money and serve as the cornerstone of a downtown entertainment niche.
The data in Figure 11 support concluding that both Bryant Park and Central Park are able to serve the local community while also attracting significant numbers of tourists. This suggests that informal downtown entertainment venues have the potential for achieving comparatively similar success in other communities, even in smaller ones. This is not to say that such success is assured, but to argue that it is worthwhile to seriously consider an informal downtown entertainment venue as a tool to bring both more tourists and more local folks downtown.
The Brooklyn Academy of Music and the Joyce Theater are well-known and very highly regarded cultural institutions that have been around for several decades. Their comparatively modest penetrations of the tourist market demonstrate that a formal entertainment venue may not always be an effective strategic vehicle for attracting tourists, but it still can be popular with local residents. It may even be that the managements of these two organizations, and their donors, prefer focusing on their local audiences. One might suspect that, across the nation, a significant number of the managers of downtown PACS, theaters and museums have a similar preference. In our firm’s experience, dreamer arts advocates – not venue managers — are usually the ones who see formal entertainment venues as the path to capturing tons of tourist dollars.
That the Met, MoMA, the Guggenheim and the Broadway League’s theaters have tourists –of which a high percentage likely come from abroad — accounting for the vast majority of their audiences probably contributes to their being considered world class institutions. These museums are also legendary fundraisers, mostly from very wealthy local and regional donors who often have substantial national or international reputations. One might reasonably suppose that these donors strongly support the orientation of these institutions toward a world audience and their having the “products” to win substantial amounts of prestige and market share in it. Relatively few other arts organizations in the USA are in a similar position or can even hope to get there. That also suggests that few of them can realistically hope to bring in comparatively huge numbers of tourists into their downtowns or communities by becoming world-class institutions.
Furthermore, the importance of “location, location, location” frequently comes into play, providing important limits on the size of the potential tourist market. The locations of many communities make it difficult for them to tap the national tourist market because their interstate highway, rail and airline assets are relatively weak. Also, many communities frankly lack other strong assets, such as scenic beauty, places of significant historical import, sports activity opportunities, attractive hotels and restaurants, etc. Few communities can grow into a Las Vegas, Nevada or a Branson, Missouri – and many do not want to. It is much easier for an entertainment venue in a small town or small city to capture tourist patrons when there are lots of tourists already visiting other places in its market area, than for the entertainment venue to become the magnet that will be the area’s primary tourist attraction.
Small town and small city entertainment venues probably can be more successfully positioned within a regional tourist market. However, then regional consumer entertainment preferences also can come into play. For example, a few years ago, we visited a very interesting and attractive downtown museum in a midwestern city with a population of over 100,000 people. Its county’s tourism agency reports servicing about 85,000 sports tourists annually, averaging out at about 282 per day. In our opinion, the museum’s holdings were unique, high quality and impressive; many other museums would probably love to have holdings of comparable quality. Yet, we were surprised to find, on Thursday and Saturday afternoon visits, that we only could count fewer than 20 other guests on each occasion. In this, and many other communities across the nation, high brow arts-based events and venues may be far weaker customer magnets than other entertainment venues.
Frictions on Visitation. Entertainment venues, be they formal or informal, face a varying array of non-physical constraints that help structure when and how often people will visit them. Some of these frictions are:
- Their operating hours – the days and hours they are open to receive guests. If they are not open, guests cannot be received and a substantial part of the venue’s potential impact on local businesses cannot be felt directly
- Their admissions. The higher the fees, the more guests are likely to be people with lots of disposable income. Also, venues in larger cities featuring sports events, concerts and Broadway shows often sell tickets in a way that leads to a large percentage of them being resold at substantially higher prices by brokers or individuals in a secondary market. This can both increase the skew towards those with more discretionary dollars and annoy the hell out of those who are less affluent. If and when admission fees/tickets need to be obtained, the more lines one has to stand on and the longer they are, the more annoyed a potential customer can get
- The need for an “appointment.” Scheduled events like shows, concerts and sports games really require the user to make something analogous to an appointment that, too often, only is available when it is convenient for the other party. The more one likes a performer, the more one is likely to adapt to the performance’s dates by altering one’s own schedule and by paying a premium ticket price
- They require a lot of time. Because of the length and timing of most scheduled events, they cannot capture a very important segment of a downtown’s entertainment demand: the people who, mainly during the daytime hours, are looking, in a spontaneous and unplanned manner, for entertainment opportunities that last 45 minutes or less. Those with a short-time period type of entertainment demand can include nearby residents, people employed in the downtown who are within a 5-minute walk of the venue and tourists. Office workers and adults with children are especially likely to appreciate daytime downtown entertainment opportunities that last less than 45 minutes. Downtown office workers are most likely to visit a nearby informal entertainment venue on their lunch hours. These days, their lunchtime out-of-office trips only last about 45 minutes (4). Also, research has suggested that parents often need to find an entertaining activity for their children that will last for less than about 45 minutes (5).
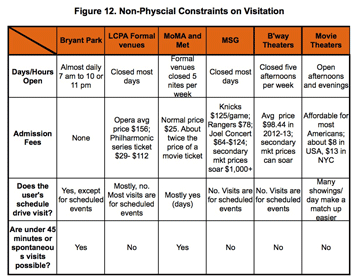
Figure 12 describes where Bryant Park stands on these four factors, while facilitating a comparison to some of Manhattan’s other major formal entertainment venues. Bryant Park – as is the case with other informal downtown entertainment venues – poses potential users with far fewer obstacles to visitation than the formal entertainment venues:
- It is open 15 to 16 hours a day, daytime and evening, daily, almost year round
- There are no admission fees
- Most visits are driven by the users’ schedules. Those wanting to attend the Park’s scheduled events will, of course, have to adapt to their timing. But, there are lots and lots of other things to do in the park for those who spontaneously decide to visit
- The park definitely attracts a lot of users who stay for 45 minutes or less. Visits can be short or long, depending on the individual’s needs and desires. The lunchtime peak in Bryant Park’s visitation suggests that a large proportion of the visitors are employed in nearby buildings and they probably are office workers. My field observations and recent chats with park users support that conclusion. My field observations also suggest that a lot of the mid-morning and mid-afternoon park users stay for less than 45 minutes.
Movie theaters cannot accommodate those with 45 minutes or less to fill, but they are open during both day and evening hours, their admission fees are affordable and their films have frequent showings that facilitate match-ups with a potential guest’s schedule. The formal venues of the Met and MoMA can meet the needs of those with only 45 minutes or less to fill, and guests’ schedules can drive the timing of their visits during the daytime. However, the museum’s admission prices are about twice that of local movie theaters.
The venues that present concerts, shows and sports events are those that have the strongest user frictions. All of these events last longer than 45 minutes, and it is usually difficult to spontaneously gain admission to them — unless one is prepared to pay a high dollar premium. Their events are mostly scheduled for evenings and a few weekend afternoons. Their average ticket costs are magnitudes higher than that of the average nearby cinema that my recent purchases in NYC found to be around $13. For example:
- At Lincoln Center, the average ticket for an evening at the opera costs $156; tickets for the New York Philharmonic, at series subscription prices, range from $29 per concert for a highest tier, nosebleed seat, to $112 for a seat in the more preferable orchestra section (6)
- The average seat for a Broadway show during the 2012-13 season was $98.44. However, a good number of the Broadway tickets are resold in the “secondary market” where prices can soar, with some reaching $1,000+ (7)
- The costs of concert tickets through Madison Square Garden’s box office will vary with the performer, but generally are close to the range of the $64 to $124 charged for a Billy Joel concert. The average box office prices for NY Knicks basketball games and NY Rangers hockey games are $125 and $78 respectively. However, lots of the tickets to these MSG events also end up being resold in the secondary market where prices can exceed $1,000 per ticket. (8)
Obviously, these are New York City prices and the premium dollars extracted in our secondary ticket markets are less likely to occur in much smaller towns and cities. However, the prices for shows and concerts in such locations can still be several times the price of a local movie ticket. For example, in one city with a population of about 17,000 that is located in a state with a population under one million persons, a movie ticket costs about $6.50, while the ticket costs to some concerts in the downtown’s attractively restored theater are:
- Aaron Neville $44.75 to $49.75
- BB King $65.75 to $95.75
- Jazz at Lincoln Center $74.75 to $84.75
- Season pass to Metropolitan Opera HDTV performances $160 to $200.
Bryant Park has many fewer frictions to entry and use than any of the NYC formal entertainment venues it has been compared to in this analysis. It presents nowhere near the economic barriers to entry that the formal venues do, and it most readily accommodates spontaneous visits of fewer than 45 minutes. In these respects, Bryant Park exemplifies some of the important advantages informal downtown entertainment venues have over the formal venues, even in small and medium-sized downtowns.
Comparing the Costs to Create, Expand or Renovate Downtown Entertainment Venues. What has really struck me over the past few years, as I looked into downtown entertainment venues, is how many reports have been done since the early 1990s on the positive economic impacts performing and visual arts venues have on their communities and how much media attention they have attracted. In contrast, there has been relatively little discussion about the comparatively high costs of creating and operating these arts venues. Also, it should be remembered that an organization’s strong economic impacts do not necessarily correlate with its financial viability. For example, in 2008, the Big Three automakers were on the verge of bankruptcy, but they directly and indirectly supported 3 million jobs, many of which were well-paying.
This focus on the robust economic impacts also was surprising since — as I have detailed in prior articles in this series — there now are two disturbing trends in the arts, one for consumer demand to be far more uncertain, changing and often in decline and another for donations and grants from government, foundation and corporate sources to be falling-off and far harder to obtain. These trends support the hypothesis that a downtown organization wanting to create or strengthen an entertainment niche might want to identify the types of venues that require the fewest financial resources to first create and then operate.
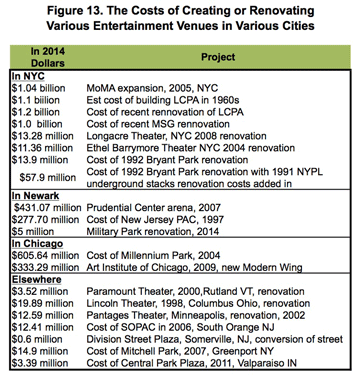
The data presented in Figure 13 are related to the costs of the creation or major expansion/renovation of 20 entertainment venues in towns and cities of all sizes, though the largest number are located in NYC (9). To facilitate comparison, I have presented these capital costs in 2014 dollars. The data are neither exhaustive nor systematically collected. They are presented because a discussion about them can be, though not definitive, nevertheless suggestive and useful.
The cost for the critical renovation of Bryant Park that was completed in 1992 is presented in two ways: the far larger estimate includes the cost of putting book storage space for the NY Public Library under the six acres of Bryant Park that are behind the library’s building. This was included because a pre-publication reader maintained that the work on the library’s book stacks probably reduced, to some unknown degree, the cost of renovating the park, most likely related to demolition work. The $57.9 million number is presented in recognition of that possibility, but the lower number will be used in the analysis since I believe it is much closer to the true renovation cost.
Comparing the cost of renovating Bryant Park in 1992, $13.9 million (without the subterranean library improvements), to the other projects in NYC shows that it was:
- About as much as renovating one of Broadway’s major theaters ($11.3 million – $13.2 million)
- Less than two percent of what it cost to expand MoMA in 2005, $1 billion
- Far less than the $1.2 billion needed for the LCPA renovation completed in 2012
- Also far less than the cost of the 2014 renovation of MSG, $ 1 billion.
If we look at projects listed under “Elsewhere” in Figure 13, the costs to renovate all but one the theaters and to create the PAC in South Orange, NJ are in the same league as the cost to renovate Bryant Park. This suggests that lots of other communities can mobilize the funds to create their own version of a Bryant Park.
If we look at the three Newark projects, again we find that the informal downtown entertainment venue, Military Park, had renovation costs, $5 million, that were a small fraction of the $431 million needed to build the Prudential Center sports arena or the $277 million spent on creating the NJPAC. To some degree, this cost differential may be due to the fact that the city already had possession of the park, so there was no land acquisition cost. However, I doubt that accounts for a significant amount of the differences. The Military Park renovation is very recent and it will be interesting to see how its attendance in five years compares to NJPAC’s and the Prudential Center’s.
Looking at Millennium Park in Chicago, we see an entirely different situation. The full cost of building the park, in 2014 dollars, was over $605 million. That’s about $25 million per park acre. It cost considerably more than the new Modern Wing of The Art Institute of Chicago, $277 million. This, of course, demonstrates that creating an informal downtown entertainment venue will not always cost less than creating a formal entertainment venue. However, taking a closer look at the situation suggests that the high costs are inevitable when two factors are involved:
- There are numerous and very complicated infrastructure improvements that are considered essential to the project. In Millennium Park, for example (in 2006 $s):
- $105 million was spent on an under the park garage that can accommodate over 2,100 vehicles
- $60 million went to improve the under the park superstructure for Metra’s commuter rail system
- $14.5 million went for the BP Pedestrian Bridge—designed by Frank Gehry
- The Nichols Bridgeway, designed by Renzo Piano, that connects the Lawn of the Pritzker Pavilion to the third floor of the Art Institute’s Modern Wing, was built at a significant, but unpublished cost
- $7 million was spent for the Exelon Pavilions’ four solar energy generating structures
- There are a lot of expensive fixed attractions and fixed event venues for visitors. For example, in Millennium Park:
- The Jay Pritzker Pavilion, an outdoor amphitheater with 4,000 fixed seats, cost $60 million and also was designed by Frank Gehry
- The Harris Theater (that is mostly underground because of height restrictions) also cost about $60 million
- The Crown Fountain cost $17 million
- The Cloud Gate sculpture, a.k.a, The Bean, cost $23 million
- Lurie Garden cost $13. 2 million
- Boeing Gardens, outdoor art exhibition spaces, cost $5 million (10).
The significance of these two factors is also attested to by an informal downtown entertainment venue, Mitchell Park, in the small community of Greenport, NY (population 2,200). That four acre waterfront park cost $14.9 million to create (in 2014 $s) largely because of serious brown field issues that had to be resolved, land acquisition costs and a design calling for a 60+ slip marina, a glass building to protect a full sized carrousel, a camera obscura and a building to provide offices for the park and harbor master as well as a viewing point of the harbor.
On the other hand, Division Street Plaza in downtown Somerville NJ (population 12,000) and Central Park Plaza in downtown Valparaiso, IN (population 32,000) show that effective informal entertainment venues can be created at significantly lower costs, $0.6 million and $3.39 million respectively. I will go into greater detail about the Greenport, Somerville and Valparaiso informal downtown entertainment venues in an article scheduled for late October 2014.
The differences between Bryant Park and Millennium Park are probative and go well beyond the vastly different costs of renovating/creating them. For example, Millennium Park has many expensive fixed infrastructure elements that enable visitors to attend events and connect the park to other adjacent attractions. In contrast, Bryant Park’s infrastructure for events is basically temporary and cost far less. It also is firmly embedded in Midtown Manhattan’s street grid and consequently does not require connecting bridges. Much of the seating in Millennium Park is fixed (about 4,000 seats); in Bryant Park it is flexible, with visitors able to move their chairs to wherever they want to put them. Bryant Park provides copious opportunities for visitors to perform by engaging in activities ranging from ping-pong to chess to yoga, while Millennium Park encourages visitors to behave more like observers.
Fundamentally, these differences probably are based on the divergent professional backgrounds of those who had the strongest influences on the designs of these two great parks. Millennium Park’s design was most influenced by famous architects. In contrast, the design and programming of Bryant Park were the products of urbanists who believed that public spaces should be designed to reflect how people are likely to behave in them.
Take Aways
Bryant Park is admittedly not the strongest tourist attraction in NYC, but it certainly holds its own compared to some of the city’s best-known formal entertainment venues, e.g., MoMA, LCPA and the Guggenheim Museum. Its strength with tourists demonstrates that informal entertainment venues can be important magnets for tourists as well as for downtown workers and trade area residents. That ability should be of strategic interest to downtowns that want to create or strengthen their entertainment niche, especially those in small and medium-sized communities.
In many key respects, Bryant Park is far more user friendly than NYC’s major formal entertainment venues. You can pretty much use it when you want or need to. There are no admission fees to pay or lines to stand on. Your visit can last three hours or ten minutes, depending, again, on your wants and needs. Your visit does not require an “appointment.” As a result, Bryant Park can attract the many tourists and other downtown users who have less than 45 minutes to spend in an entertainment venue. Here again, it exemplifies a trait of informal entertainment venues that should be of strategic interest to downtowns that want to create or strengthen their entertainment niche.
The 1992 renovation of Bryant Park was not its creation, but more akin to its recreation. The cost of that recreation, whether you chose the number that includes the cost of the NYPL’s subterranean 40 miles of bookshelves or the smaller and more probable amount, is dwarfed by the costs of renovating NYC’s formal entertainment venues that can compete with it in terms of attendance. While Chicago’s Millennium Park demonstrates that this is not always the case, Bryant Park does demonstrate that informal entertainment venues capable of attracting very strong visitor flows can be created for far less money than formal entertainment venues. For any downtown that wants to create or strengthen its entertainment niche, this should be an important strategic consideration — most especially for those in small and medium-sized communities, where financial resources are likely to be limited.
Endnotes
1. Given some reactions by readers of Part1, I want to clarify that: a) I am a very frequent patron of all of the NYC entertainment venues I discussed, save MSG and the Broadway theaters and b) I think that the venues I do not visit frequently still are strong economic assets for NYC and I am glad that we have them.
2. Michael Howard Saul, “New York City Sees Record High Tourism in 2013: Hotel Room Rates, Bookings Up; Number of International Visitors Doubled in 12 Years,” Wall Street Journal, Dec. 10, 2013 http://online.wsj.com/news/articles/SB10001424052702304744304579250521791383050
3. Most of the data on the tourist component of an entertainment venue’s attendance came from: http://www.thirteen.org/metrofocus/2012/08/tourists-help-the-nyc-arts-economy- thrive/ . However, some tourist data was obtained directly from an organization’s staff or its website
4. ICSC 2003 survey of office workers
5. Randy White, “The shifting nature of leisure time and expenditures”, “Leisure eNewsletter – January/February 2008,”
6Daniel J. Wakin “The Met Will Lower Ticket Prices,” New York Times, February 26, 2013. http://www.nytimes.com/2013/02/27/arts/music/metropolitan-opera-to-reduce-ticket-prices-next-season.html. Info on ticket costs for the New York Philharmonic taken from its website http://nyphil.org/
7. The Broadway League, “Broadway Statistics at a Glance 2013,” http://www.broadwayleague.com/editor_files/broadway_statistics_at_a_glance.pdf
8. Claire Suddath, “Billy Joel Will Play Madison Square Garden for the Rest of His Life,” BloombergBusinessweek, Dec 4, 2013. http://www.businessweek.com/articles/2013-12-04/billy-joel-will-play-madison-square-garden-for-the-rest-of-his-life; Forbes. NBA Team Valuations: New York Knicks. http://www.forbes.com/teams/new-york-knicks/ ;Forbes. NHL Team Valuations: New York Rangers. http://www.forbes.com/teams/new-york-rangers/
9. A wide range of sources, both on the Internet and in personal conversations and communications was used to obtain this data. Paul Goldberger’s May 3, 1992 review of Bryant Park gave me $8.9 million as the cost of its renovation, which I have converted to 2014 $s. Another NYT article around that time gave me the cost of NYPL’s subterranean work, that I turned into 2014$s and added to the updated Goldberger number to get the highest cost estimate. (All of the other cost numbers I found were also updated to 2014 $s.)The cost of the SOPAC project comes from an “Evaluation of SOPAC” done by Harac Consulting in 2011. The cost of Division Street Plaza in Somerville comes from an email from Beth Anne Macdonald, the executive director of the Downtown Somerville Alliance. Mayor David E. Kapell, who spearheaded the development of Greenport’s Mitchell Park, gave me the cost for creating it in a July 2006 telephone conversation. The costs of the remaining projects were obtained from Internet sources, mainly local newspaper articles
10. All of the cost estimates for specific parts of Millennium Park come from an article in Wikipedia: http://en.wikipedia.org/wiki/Millennium_Park . However, I found other sources that confirmed each of them.
© Unauthorized use is prohibited. Excerpts may be used, but only if expressed permission has been obtained from DANTH, Inc.