15- Minute Neighborhoods/Cities are a hot topic these days, with many eyes on Paris and folks wondering if this concept would work here in the US. The leaders at CNU have given it serious and interesting attention and thought. It is a concept worthy of a close look to clarify its meaning and viability. Given that I want to analyze a complex concept in as few words as possible, I will avoid mentioning who said what when and where in previous published discussions about 15-minute neighborhoods/cities (hereafter referred to as 15MNs). As a curmudgeon and a contrarian, I will first present a contrarian view of what 15MNs are, their components, and how they should be defined. Then I will present the thinking that fostered my view of them. This will be followed by a case study of the community I live in, Kew Gardens (KG), NY. It is smaller than the area covered in a 15 minute walk shed, yet it has loads of things to do and buy. It also was built as a planned suburb, and today maintains many of the characteristics of one. NYC has several other neighborhoods that started out as suburbs, such as Forest Hills Gardens.
My intent is not to be definitive, but to spotlight some analytical and factual issues that now surround the concept, to provide some possible solutions, and to spark some additional discussion and amicable debate.
A Contrarian View of 15MNs
The Component Parts. 15MNs are composed of 1) a basic Core Area and 2) many larger Associated Access Areas.
The Core Area. Is fundamentally a residential area defined by a 15 minute walk shed from some central point, with supportive services that meet many human needs and desires, but certainly not all.
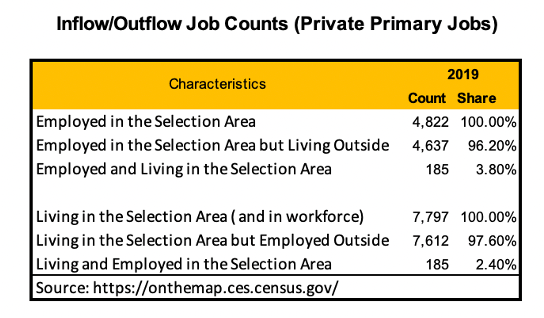
Who lives there will be strongly influenced by where people work. However, the people who will work there and do not live there are also very important because they so strongly impact local shops and businesses. Most people do not work in the community where they live, and that will probably be true of any 15MN. For example, here in Kew Gardens, 7,787 residents had jobs in 2019, but only 185, 2.4%, worked in KG. Most of KG’s residents work in Manhattan, with about 20% working in the Midtown CBD that’s about seven miles away (see map above). However, about 4,600 people come into KG to work there each weekday. Accordingly, meeting the needs and desires of these workers in the core area must also be considered because they account for such a large part of that area’s critical daytime population. These workers also will usually make pedestrian trips while in the area of 10 minutes or less.
The strengths and magnetism of the core areas will vary based on the range of needs and desires addressed and on how well that is done. The core thus serves as a kind of container for the venues and places that meet some, and hopefully many, of the residents’ needs and desires. The number of needs and desires addressed in a core and the number of venues and places addressing each one will vary with the cores population density, and the wealth and tastes of its residents and other frequent users.
The Associated Access Areas. The access areas are places core area residents can go to within a 15 minute trip. Core areas thus also serve as a base for residents to access additional venues and places located well beyond its borders that additionally can meet its residents’ needs and wants. Each of these needs and wants will likely have their own travel sheds that are further fragmented by the transportation modes that are fastest and popular. Jobs are one example. Others are comparison retail – many malls have 15-20 minute drive sheds, a few 40 minutes – hospitals and specialty medical services, major entertainment and cultural venues, colleges and universities, etc. Some may be reached by micro transportation vehicles; others will require the use of cars or mass transit.
Rather than carrying over a specific transportation mode to define these access areas, I am carrying over the 15 minute travel time constraint because of its implicitly strong association with providing the opportunity for enjoying a higher quality of life. A better quality of life is perhaps the most fundamental argument in favor of 15MNs. The pandemic has shown how stressing and destructive of quality of life are long commutes. What is not only in a town but also easily accessed in a short nearby trip is often an important factor in decisions people make about where they want to live.
Where the 15MN is located can make an enormous difference on what it can offer its residents. For example, a 15 minute car ride may theoretically buy 10 miles of distance and make every city a 15-minute city, but in places with very dense and slow moving traffic such as LA, NYC, Chicago, Philadelphia, Atlanta, Dallas and Seattle that will not be the case. This is particularly important regarding the ability of 15MNs to provide 15 minute access to large clusters of office jobs in their downtowns. In less congested cities, this will be less of an issue. Also, some cities, like NYC are polycentered with several downtowns, so this might increase the chances for 15MIN-jobs hook ups. In other words, some 15MNs will have this important jobs access, while others will to a lesser extent, or not at all.
The 15 minute access areas are critical because they can significantly impact the desirability of living in a particular 15MN’s core area.
Some Basic Givens
15MNs should not be viewed as complete or even mostly economically self-sustaining entities, i.e., small autarkies. Even the slightest implication of that will severely weaken the persuasiveness of the concept. Autarky lacks viability at the national level and is even less so at the local level. However, 15MNs should offer a lot of what people need for everyday living like shelter, food, entertainment, safety and especially a sense of community.
Nor should they be seen as isolated geographic units with no really important ties to their cities, regions or states. Even famous island nations have strong ties to other geographic units. Viable 15MNs also will be stronger if they are well connected to their neighboring communities and their regions. This is especially true because of jobs. Since large downtowns are often very large office employment nodes, how 15MNs are connected to them can be an important factor in determining their magnetism.
15MINs CANNOT BE DEFINED BY JUST ONE TRAVEL MODE. Work is an absolutely essential part of people’s lives. Pre pandemic, about 5% of our labor force worked from home (WFH), and recent estimates are that 20% to 30% will do so post pandemic. Also, the average commuter trip in the US is 27.6 minutes, with only about 29% of commutes by all modes lasting 15 minutes or less. One might reasonably argue that unless advocates of 15MNs can provide an adequate way of dealing with the work issue, its chances of success will be diminished. Proximity to large employment nodes may determine if a 15MN can claim to offer 15-minute access to jobs. For example, here in NYC, a 15MN in Long Island City, Astoria or Williamsburg would be more likely to provide such access than those in Forest Hills, Kew Gardens or Prospect Heights when door to door trips are considered, not just the length of a bus or rail trip. Long Island City is of special interest because it is and has long been an important employment node, and has had huge recent residential growth.
Many cities such as NYC and LA are really polycentered, with one very dominant downtown, and others dispersed across the city. In NYC these downtowns include: Midtown and Downtown in Manhattan; LIC, Jamaica Center, Flushing, and Rego Park/Elmhurst in Queens; Downtown Brooklyn, and Fordham Road in The Bronx. 15MNs within 15-minute trips of them may offer stronger job access.
Residential uses are the foundation stones of 15MNs. On them and their supporting functions a community can be built. Since community building is easier and stronger when people meet and interact, the area’s built environment must facilitate and support such interactions. This means walkability, public spaces and third places are important assets. It also means that the 15MN’s core area should be geographically defined by a 15 minute walk shed from its central point.
Given this residential orientation, our national trend of residential tribalism, and their relatively small size, will 15MNs have a propensity to be racial and ethnic enclaves? Are such enclaves always problematical, e.g., our Chinatowns, Koreatowns, Little Indias?
A 15MN’s core cannot possibly meet every need and desire residents might want. Such an outcome has so strong a prima facie improbability that nothing more needs to be said.
When talking about how 15MNs meet resident needs and desires, we should be clear about whether we are talking about what the average or strongest and most magnetic among them might have, or what might be asserted as needed for them to be deemed 15MNs. I think, in this regard, there has been a lot of confusion about what makes a 15MN and what makes a great one.
While not all human needs and desires will be met within a 15MN’core area, many more probably can be accessed from the 15MN core within the 15 minute travel time of some mode of transportation other than walking. Consequently, 15MN cores function as 1) geographic containers for some –and hopefully a lot – of the venues and places that meet the needs and desires of the local residents, businesses and workers, and 2) a as an operational base from which core resident needs and desires can be met more fully in “access areas” defined by 15 minute travel sheds that cover larger areas because the travel modes employed have greater speed than walking. A 15 minute walk shed covers about 1.88 square miles, a 15 minute auto travel shed theoretically can cover 335.1 square miles. Yes, this may mean that traveling by rail, bus, and car are still associated with 15MNs. This is especially likely to be true with regard to comparison retail, jobs, education and health care services, etc.
15MNs will not have just one set of defining functions and activity opportunities. One set would mean just one type of 15MN, when many types are conceivable, and people will probably chose which 15MN to live in based on how the 15MNs functions and opportunities met their specific set of lifestyle needs and wants. Just as there are different types of residences, there can be a wide variety of 15MNs
15MNs cannot be exhaustively defined by the 15-minute travel shed of just one transportation mode, walking. To do so will be counter to the strong probability that the residents of any 15MN will be very multimodal, and not only walking and riding bikes and scooters, but also using buses, subways, commuter rail, and yes, even cars.
However, 15 minutes is an essential part of the concept because of its association with the possibility of having a better quality of life. Its presence acts as a constant, like the speed of light in Einstein’s E=MC2 equation, that serves to focus attention on geographic areas in which travel times are far from burdensome, so movement within these areas can be relatively easy.
A Sample of Urban 15MN Core Venues and Places
Having argued strongly above that 15MNs cannot meet all the needs and wants of its their residents, I want to illustrate that in dense urban areas they nevertheless can meet a wide variety of them. I am not claiming that the situation depicted below should or will be replicated elsewhere, and there are obvious conditions associated with it such as population size and density, household incomes, and infrastructure amenities.
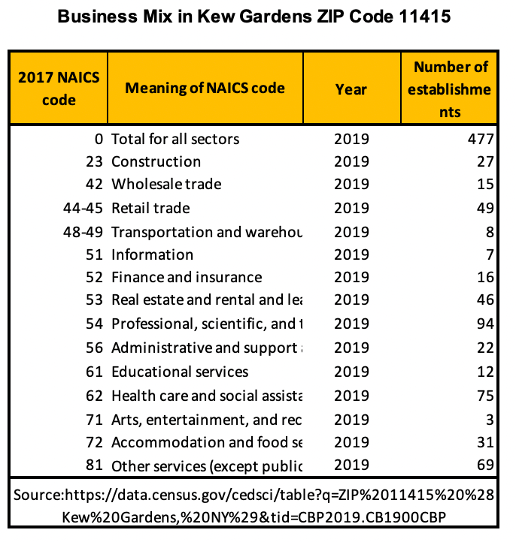
To do so I have selected the Kew Gardens zip code to look at. With an area of about .57 square miles, it is considerably smaller than the 1.88 square miles a full 15 minute walk shed covers. It’s population is comparatively large,19,341, exceeding that of about 85% of the nation’s incorporated places, and dense at 34,042 persons per square mile. There are over 9,000 housing units. The median HH income is about $70,900, with 32% having incomes of $100,000+. Fifty percent of adults have a BA or higher degree. The largest racial/ethnic groups are: White 48.4%; Hispanic 25.1%, Asian 16.2%, and Black 6.2%.
The neighborhood borders a 538 acre park and has a strong cinema that draws from well beyond the community, commuter rail and subway stations, and an exit on a major limited access highway.
In 2019, there were 477 business establishments in the zip code, of which 49 were retail, overwhelmingly independents and small chains. Thirty-one were in accommodations and food services, with a vast proportion restaurants and takeout places. There are a large number of professional services because of important city offices and courts in the area. There are also numerous other Central Social Functions types of venues such as hair and nail salons, martial arts studios, childcare and senior care facilities.
Jobs are where this neighborhood sees the overwhelmingly majority of its residents, 97.6%, leaving the area, and 96.2% of those employed in Kew Gardens are not living there. Pre-crisis 53% used public transit to get to work, 35% autos, 6.1 % biked or walked, and 3.8% worked from their homes.
Having a large number of people living and working in an area is seen as increasing the multifunctional strength of large employment centers, such as our large downtowns with large inventories of office space. However, it is not easily achieved. For example, as can be seen in the nearby table, some of our major employment nodes do indeed have over 40% of their residents also working in the area, but they only account for about 4.2% of all 230 employment nodes studied. In contrast, 60% of the nodes were below 20%.
That suggests that it will not be easy for 15MNs to grow their live-work numbers. The growth in remote work might help some in this regard, but that will happen most easily in suburban locations that are attracting nesting Millennials who also hold jobs attached to offices in large downtowns.
KG is Probably Far From Alone and That Raises the Issue of Making Our Organic 15MNs Better. New York City probably has several hundred neighborhoods. Manhattan alone has 53, according to the city planning department. Many of them have organically developed in a fashion similar to KG, and be de facto 15MNs.
For them the issue is not really one of creating a 15MN, but how they can be made better. In thinking about that, we need to consider not only their core areas, but also how their access areas can be expanded or better penetrated. The latter is essentially a transportation issue. My bet is that the growing use of e-bikes and e-scooters will facilitate that faster in the three to five mile range than any expansion of mass transit.
Some Suggested Take Aways
Our densely populated cities may already have many organically developed 15MNs
A 15-minute walk shed can hold a large number of diverse businesses, residential units, and other assets that impact the local quality of life, but that is not necessarily the case. As with any neighborhood, 15MNs will differ in how many of these assets they have, as well as in their population size and density, household incomes, racial/ethnic mixes, etc.
Their magnetism will depend on their asset mix and how their specific asset mix meshes with the needs and desires of potential residents
Some of the needs and desires of 15MN residents can also be met outside of the core but within 15 minute trips by their favored transportation modes
The needs and desires of residents that are best met in venues and places that are designed to have regional drawing power – workplaces, comparison shopping malls, hospitals, colleges, major museums, etc. – typically will be the hardest to access even within 15 minute trips by the fastest transportation mode, unless the 15MN is geographically located close to them. Where the 15MN is located makes a difference.
Going to work will probably be the primary reason that 15MN residents leave their neighborhoods. 15MNs in polycentered cities that are with a 15 min travel times — door to door – of one of these downtowns will be better able to have easy access to workplaces and benefit from it as a magnetizing asset.
Rob Steuteville, the editor of CNU’s journal Public Square, recently interviewed David Milder about his article in The ADRR, Strong Central Social Districts: The Keys to Vibrant Downtowns. The interview was published on the Public Square website in two parts, on August 17th and 23rd. David thanks Rob for his great questions that helped him explain more fully CSDs and their importance.
Save the date for: Bringing Back Downtown Retail After COVID-19
Across the nation in downtowns large and small, leaders and stakeholders are beginning to ask questions such as:
Where will retail be in downtowns like ours as we recover from this very stressful crisis?
What are the best opportunities for regaining, and possibly increasing, the strength of our downtown’s retailing?
What strategies, projects, and programs can help us achieve those potentials?
To address these critical questions, the American Downtown Revitalization Review- The ADRR – is partnering with the University of Wisconsin Madison – Extension to present an online panel discussion on Bringing Back Downtown Retail After Covid19 on:
Wednesday.
October 6, 2021,
at 12:30 pm CST.
The focus will be on downtowns and Main Street districts in communities under 75,000 in population. The webinar is part of Extension’s Learning from the Experts series. The panel will include three nationally known experts: Michael J. Berne of MJB Consulting, Kristen Fish-Peterson of Redevelopment Resources, and N. David Milder of DANTH, Inc. Bill Ryan of UW Madison-Extension will moderate the session. Stay tuned for details about signing up for the Zoom link needed to attend.
No, We Are Not Facing a Restaurant or Retail Industry Apocalypse
By N. David Milder
An Introductory Overview.
While the economic impacts of Covid19 are culling the weaker firms in the industries that frequently occupy downtown storefronts, and permanent closure rates are probably higher than those during the Great Recession, they are not anywhere near reaching the apocalyptic levels that would involve the effective decimation of these industries and impair their recoveries. Claims of industry apocalypses seem to be the rage in recent years starting with retail before the crisis. Since Covid19’s appearance the restaurant, personal services, and arts industries have also been seen in that light – often by industry leaders who are desperate to gain public attention and win strong government financial support for their member firms.
Many of the reported closures did not reflect economic failure, but legal necessity, and these operations reopen quickly when allowed by local regulations. A more accurate view of the situation should be based on the fact, as established by a research team from the Federal Reserve, that business deaths are a normal occurrence with about 7.5 percent of firms and 8.5 percent of establishments exiting annually in recent years.[1] They also noted that small firms account for most of these closures. The team also found that “temporary business closure is common, affecting about 2 percent of establishments per quarter.” Covid19, as many crises do, has accelerated the processes of creative destruction that were already taking root in these industries prior to this crisis. Even if the permanent closure rates prove to be relatively higher than those produced by the Great Recession, there is no evidence that they will be so strong that they will prevent vibrant recoveries.
[1] Crane, Leland D., Ryan A. Decker, Aaron Flaaen, Adrian Hamins-Puertolas, and Christopher Kurz (2021). “Business Exit During the COVID-19 Pandemic: NonTraditional Measures in Historical Context,” Finance and Economics Discussion Series 2020-089r1. Washington: Board of Governors of the Federal Reserve System, https://doi.org/10.17016/FEDS.2020.089r1.
As the readers of this blog probably know, I have spent a lot of time and effort on identifying the components of our Central Social Districts and analyzing what makes them succeed or fail. I’ve dug deeply into public spaces, movie theaters, housing, and various other components in cities large and small.
Recently, I was asked for one article that put it all together. I realized that I did not have one, so I consequently set out to write it. That article was recently published in The American Downtown Revitalization Review – The ADRR at https://theadrr.com/
Doing the topic justice meant that it would be long, about 30 pages, and more like a monograph than an article. Readers wanting a quicker take can just focus on the first six pages. However, if you are looking for more guidance about what to do and not do, you will need to dig deeper into the article.
Some of the important things I tried to do are to establish that some components are much easier and cheaper to establish than others, and which work better in different types of downtowns. I also tried to strip away a lot of the advocacy hype about some components that too often hides the challenges involved and obscures how progress needs to be evaluated, e.g., the arts venues, while spotlighting venues whose importance still goes widely unrecognized, e.g., libraries.
Here’s the article’s tease and link:
Strong Central Social Districts: The Keys to Vibrant Downtowns
By N. David Milder
DANTH, Inc.
CSDs and Some of Their Frequent Components. Since antiquity, successful communities have had vibrant central meeting places that bring residents together and facilitate their interactions, such as the Greek agoras and the Roman forums. Our downtowns long have had venues that performed these central meeting place functions, e.g., restaurants, bars, churches, parks and public spaces, museums, theaters, arenas, stadiums, multi-unit housing, etc. The public’s reaction to the social distancing sparked by the Covid19 pandemic, and the closure of so many CSD venues, was a natural experiment that demonstrated how much the public needs and wants these venues. They are the types of venues and functions that make our downtowns vibrant, popular and successful. To read more click here : https://theadrr.com/wp-content/uploads/2021/07/Strong-Central-Socia-LDistricts-__-the-Keys-to-Vibrant-Downtowns__-Part-1-FINAL.pdf
Over recent months I’ve been getting a sense that some suburban downtowns may well make relatively strong recoveries from our current virus induced economic crisis, and relatively speaking, stronger even than those of our superstar downtowns. This also prompted me to think that the current and potential strengths of some of these suburban downtowns are too often underestimated and overlooked. I’m venturing to presume that others may also find these thoughts of interest and they are presented below. Please, let me know what you think about them.
Suburban Downtowns Are Different and Often Surprisingly Strong
Last year Bill Ryan and I did some research on dataset covering all of the 259 downtowns in cities in the 25,000 to 75,000 population range in seven Midwestern states. Our findings will appear in an article in the Winter 2020 issue of the Economic Development Journal, titled Living and Working Downtown: Is It a Population Growth Engine for Small Cities? Included in the dataset were 167 suburbs that usually are parts of relatively large metropolitan areas in which much larger cities are the cores, and 92 independent cities that are themselves the cores of a smaller metropolitan or micropolitan area. We were struck by how different these two types of downtowns are in many important respects. For instance:
Though less multi-functional, the suburban downtowns averaged about the same number of residents 3,089, as the independent downtowns, 3,294.
However, suburban downtowns had a higher population growth rate, 5% to 0.23%, and a lot fewer had declining populations, 31% versus 46%
Moreover, the suburban downtowns scored much lower on our two measures of live-workers in their downtowns, between 3.1% and 8.7%, than the independents, 12% to 29%. Additionally, such low levels even were present in the suburbs that had attracted relatively large numbers of office workers to other parts of their city, such as Dublin, OH, with 42,200+ in 2017
One factor that helps explain the greater strength of the suburban downtowns is that they are very probably located in metro areas with significantly stronger economies than the smaller metros the independent cities are anchoring.
A trend that helps to explain the low live-work numbers in suburban downtowns is that most suburban residents are not drawn to the type of dense housing units their downtowns tend to offer. National surveys for many years now have continued to show that about half of the adult population prefers living in the suburbs and that the vast majority of people who live in the suburbs want to be there. (See the table above.) That strongly implies that they prefer the urban lifestyle that includes single family homes, lower population densities, a slower pace of life, significant car use, and an environment that is predominantly “green” rather than concrete and asphalt.
Moreover, when these suburbs do attract offices they tend to be located in office park-like developments, within about a 5-minute drive of, but not in their downtowns.
The Importance of CSD Functions in Suburban Downtowns
Our findings also had some strong potential implications for a far broader range of downtowns:
Suburban downtown residential populations are not driven by the presence of downtown jobs, as some experts believe is the case with our large and superstar downtowns.
Consequently, they must be driven by other factors. Since the downtown populations of the suburbs and independents are so close, these other factors are probably as strong or stronger than downtown employment is in non-suburban downtowns. These other factors certainly are not weak, and they also could be present in non-suburban downtowns, too.
A very probable strong factor are the suburban downtowns’ Central Social District (CSD) assets: its housing, restaurants, bars, parks, athletic fields, public spaces, cinemas and theaters, libraries, art galleries, maker spaces, farmers markets, community centers, houses of worship, childcare and senior centers. Indeed, it can be reasonably argued that the suburban downtowns that have been successful in terms of popularity, use and investment have done so largely because of the strength of their CSD functions.
Housing is a very important CSD function. Two advantages suburban downtown housing may have are the likely greater comparative affordability of its costs and the convenience of it locations. In struggling downtowns units may be affordable because they are in poor condition and can only command cheap rents. In more successful downtowns, it may be that apartment rents/costs are cheaper than renting/owning an apartment in the region’s core city, or living in a suburban single family house (e.g., empty nesters), and/or because the apartment is occupied by several people who share the rent payments (young adults).
Units close to mass transit will probably be convenient for those who commute by rail or bus to large employment centers elsewhere in the region. Indeed, in these suburban districts, the commuters who live in TOD residential developments may be the equivalents, in terms of economic impacts, of the live-workers found in and near the cores of our largest downtowns. However, according to one report, NJ Transit has found that only 12.5% to 25% of the residents in the TOD projects developed around its stations are NJT commuters.1
These downtown residents can bring in substantial purchasing power. For example, it was estimated that, around 2010, the roughly 1,500 new occupied residential units in downtown Morristown, NJ, would bring in about $72 million in potential retail spending power. 2
Undeniably, when the CSD assets of a suburban downtown are strong, the district is highly urban in character, and more analogous to a strong big city neighborhood commercial district, such as Williamsburg in Brooklyn, or Forest Hills in Queens, than to a sizeable rural town. We might characterize these districts as “urbanized suburban downtowns.”
Typically, suburban downtowns have a Greater Downtown area that includes the downtown and nearby areas from which people can conveniently get to and from the downtown core , some on foot, but most by car. Sorry, folks, but we are talking about the suburbs here. That may be changing in the near future as AV vans and greater use of e-scooters and bikes come more into play.
The non-district portion of the Greater Downtown area can have relatively significant population and workforce densities and be the source of a lot of the customer traffic of downtown merchants. These users also can strongly influence the image of the downtown.
Unfortunately, there is no study of urbanized suburban downtowns. Some districts that I would include in that category are in Wellesley, MA; Englewood, NJ; Morristown, NJ; Cranford, NJ; Westfield, NJ; and Cranford, NJ.
Some have had strong GAFO retail, though that has weakened substantially with the upheavals in the retail industry over the past decade and the Covid crisis. Some have a lot of office workers located nearby in their town who are important lunchtime customers. Some have PACs, theaters and/or cinemas. All are walkable and have lots of eateries, coffee shops, and drinking places. All are surrounded by residential populations with high percentages of creatives – some also have large numbers of creatives working within or very near the town.
This suggests that non-suburban downtowns can also flourish by strengthening their CSD assets.
Suburban Creatives
For many creatives, these urbanized suburban downtowns may be extremely attractive, especially if they either: 1) prefer the suburban lifestyle when it comes to single family housing and green spaces, yet still enjoy urban type entertainment venues such as good restaurants and cultural events, or 2) they are nesting and need affordable and relatively spacious residential units, while also appreciating many aspects of urban entertainment and leisure time activities. The fact that these suburbs often have excellent public school systems also makes them attractive to core city nesting creatives who are looking for a more affordable place to live. In NYC, for example, the private elementary school average cost per student is $13,000 per year and for private high schools the average is $25,267 per year. With taxes, parents will probably need double that amount of their income to cover those costs.
My prior research on 14 counties in Northern NJ that are suburbs of NYC or Philadelphia – see the above table — certainly suggests that in 2010 very substantial numbers of creatives lived, worked or even possibly live-worked in these communities. Interestingly, the median of the percentage of their workforces that were creatives was 31%, but the median of the residential adult population in the labor force who were creatives was 40.3%. See above table. In Somerset and Hunterdon Counties over 50% of the residents in the labor force were creatives. So these suburban counties of superstar cities/downtowns probably have been recruiting lots of creative residents for decades. The size and economic power of these suburban creatives often seems to be overlooked because so much attention is focused on the young creatives being attracted to hip urban neighborhoods of the superstar cities.
Some downtowns in these high creatives counties have tried to attract more creatives to spark economic growth, while what they probably needed to do was to better leverage the numerous creatives they already had! Far too little attention has been paid to these suburban creatives.
The downtowns in these counties did not have anywhere near the number of apartments or condo units needed to house all of these creatives, so it seems reasonable to deduce that most were living in the single family type homes the suburbs are famous for. It also seems reasonable to deduce that the vast majority of these creatives probably were living there because they liked the lifestyles these suburbs support. In turn, this seems to counter the blindered visions of where creatives want to live that only focus on hip urban neighborhoods. Furthermore, it also counters visions that just focus on the young creatives who may indeed have a significant tendency to live in the hip urban neighborhoods, by showing lots of probably older creatives, who have probably nested, prefer suburban or rural residential areas.
Some Downtowns Will Be Better Positioned to Recover Economically Than Others
There already is plenty of evidence that points to the imputation that suburban downtowns, especially those that are urbanized, will be much better positioned to have a successful economic recovery than others. There are also a number of steps their leaders can take that will further solidify their strong recovery positions.
Tourists. Most suburban downtowns, especially those that have been urbanized, are unlikely to be heavily dependent on tourist customer traffic/expenditures as are the downtowns in our large cities such NYC, Washington, D.C., San Francisco, etc., or in rural towns where tourism is the main economic engine. In those areas the collapse of their tourist markets have had large negative impacts.
Moreover, the resurgence of tourism will be hampered by other factors besides the pandemic’s impacts. International politics is one. For example, It probably will be very hard for our major downtowns to regain the strong flows of big spending Chinese tourists they once had. Even under an optimistic scenario, it very probably will take a few years for tourism to return to prior levels in these downtowns.
Office Workers. Merchants in our big city downtowns have also been clobbered by the disappearance of their office workers. In many of them only abut 20% to 30% are now showing up. Moreover the growing adoption of remote work probably means that the number of office workers employed in our largest downtowns probably will decrease by 16% to 22% after the crisis. 3 In contrast, in the suburbs – e.g., Morristown, NJ, Dublin OH, Garden City, NY – that have attracted large numbers of jobs, office worker presence has remained substantially higher through the crisis than in central cities, and they are also more likely to fully recover more quickly. The suburban office workers do not have to use public transportation to commute to work. Consequently, these suburban towns are unlikely to be hurt as much by remote working or to experience their office jobs being decanted to less populated, and less public transit dependent areas as may happen in our large cities. To the contrary, some suburbs may be substantial recipients of such workforce decanting and the growth in remote working. Their downtowns will benefit from this.
Foot Traffic. It should not be surprising then to find that while in many large downtowns foot traffic has fallen by roughly 60% – 70% since 2019, it has been substantially less in their suburbs. See chart nearby.4 Foot traffic is critical to the health of any downtown. The suburbs may not need to recover as much as the center cities on this key variable.
Downtown Small Merchants. Truth be told, small merchants have been a disappearing breed in big city downtowns well before Covid19 appeared. At best they have retreated from the major commercial corridors to sidestreets. A number of factors were involved such as: unaffordable rents; associated real estate bubbles and consequent landlord needs for high paying tenants; new landlords who knew nothing about managing retail properties, and redevelopment that forced closures and relocations. In contrast, small merchants remain the primary occupants of the storefronts in most suburban downtowns, though vacancy rates have continued to creep up for many years now, and non-retail uses continue to increase.
While there has not been any rigorous systematic study, a review of many reports on the internet suggests that merchants who are more dependent on residential markets and less on tourists and office workers were doing significantly better than those who were focused on tourists. Many of our largest downtowns have relatively few residential units within their boundaries, but a whole lot within a Greater Downtown area that includes nearby neighborhoods from which residents can easily and quickly get to the downtown core. That would suggest that merchants in suburban downtowns, especially those with substantial new market rate housing, will not be among those hardest hit. Of course, that does not mean that they are not being hurt or stressed, but it may indicate that it will be relatively easier for them to survive and recover.
Downtown Retail Chains.
Superstar Downtowns, In these districts retailers have long paid extremely high rents for premier retail locations. However, in recent years, real estate bubbles and high rents have resulted in high “availability rates, ” with 20% or more not being unusual. The above table details such a situation in Manhattan in Q2 of 2019. Most of those locations have been very dependent on tapping office worker and tourist shoppers and their ability to again earn meaningful profits probably awaits the return of those shoppers at some still unknown time in the future. The prior high availability rate suggests problems that the Covid19 crisis can only have exacerbated.
Many of these retailers are in the luxury market and BCG recently estimated strong declines in luxury retail sales for 2020 and 2021, with a recovery appearing in 2022, BCG also found that many more shoppers are now trading down than trading up.5 Moreover, online sales of luxury merchandise has been growing significantly.
Many observers expect a new equilibrium between retailer and landlord needs will be reached in the coming years. However, until then retail in these big downtowns may be somewhat unstable. While the landlords of the luxury retailers may continue to claim that all is well, 20% availability rates and the disappearance of key market segments are strong visible evidence that those assertions are not true.
Retail Chains Resurging Post Crisis in Suburban Downtowns. The claim has been made that the closure of many malls and chains will set free so much market share that retail chains and small independent retailers located in suburban downtowns will grow and prosper as the current crisis ebbs. There is probably some merit to this claim – but not much.
Most suburban downtowns have not attracted large numbers of GAFO retail chains, though they often do quite well with those selling necessities such as groceries, convenience goods, and medicines. That is not likely to change in the future because these districts lacked and will continue to lack the required locational assets. Few have the auto traffic that passed near the malls. If retail chains do return to the suburbs, standalone locations abutting high traffic roads on the periphery of these towns may very likely be preferred to those in their downtowns. However, some in wealthier market areas – e.g., Westfield and Englewood in NJ, Wellesley in MA — have in the past attracted lots of GAFO chains, and they often were like open air lifestyle mall downtowns. Even then, though, while the number of retail chains present in these districts was often impressive, according to information confidentially provided by one well known national brokerage firm, their profits per store usually ranked relatively low within their chains. They were thus among the most prone to be closed if their chain got into financial trouble. So unsurprisingly their strength and numbers were eroded by the Great Recession, new competitors appearing both online and from strengthened malls, the retail chains’ corporate weaknesses being magnified by the process of creative destruction occurring in the retail industry, and the negative economic impacts of Covid19. For example since 2009, one of these retail chain rich suburban downtowns has lost the following chains: Esprit, Coach, Chico’s, Ann Taylor, Lucky Brand, White House-Black Market, Janis & Jack, Papyrus, Aerosoles, Victoria’s Secret, Eileen Fisher, Coldwater Creek, Kiels, Omaha Steaks, and Game Stop.
For many years the trophy retailers downtown leaders wanted to attract were largely in the apparel sector, e.g., The Gap, Chico’s, Talbert’s, Ann Taylor, Victoria’s Secret. Today, that sector is in disarray – even some off-pricers, like Stein Mart, that had been seen as well positioned, have fallen.
The argument for the supposed market share being yielded by closing malls and retail chains being captured by retailers in suburban downtowns has a number of problems analytically:
The demand for some kinds of merchandise has been in long decline, e.g., for apparel. This has been influenced by the trend toward informal workplace attire that has been strongly reinforced by the current crisis, and the growth in remote working. It also has been impacted by consumers wanting to spend more for interesting and rewarding experiences than for things.
More than ever, retail chains are looking for low risk locations. These locations tend to be in areas where there are significant numbers of fairly affluent shoppers or very large numbers of easily accessible shoppers with more modest incomes. About 20% of our malls were doing well prior to the crisis, and they tend to capture these affluent shoppers. Walmart, Target, Costco, Best Buy, et al are prospering even during the crisis from their growing proficiency with omnichannel marketing strategies. They are attracting the mid-market shoppers. These malls and big boxes are formidable competitors and probably are sopping up lots of any market share the folded malls and retail chains yielded.
E-retail was growing impressively before the Covid19 economic crisis, but its growth has accelerated substantially during the crisis, and strong evidence suggests these high e-sales levels will not diminish all that much as the economy improves. E-commerce definitely has and will capture substantial portions of any market share that folding malls and chains might yield.
There seems to be fundamental weaknesses with the business model used by retail chains, especially when they are taken over by hedge funds and the like. Bean counters seldom are good merchants, much less great ones!
Internet born retailers may look for spaces in suburban downtowns, but their behavior to date indicates they will look for locations in higher income market areas with strong customer flows. For example, Warby Parker now is located in downtown Hoboken and downtown Westfield in NJ. They are unlikely to flood our suburban downtowns.
The failed malls and chains probably will yield a relatively small amount of market share that downtown retailers might capture. Small downtown merchants are much more likely to benefit from that yielded market share simply because they need much lower sales revenues to survive. That said, these small merchants still better have other market segments to tap.
There is little reason to believe that our recovery from this crisis will somehow coincide with the resurging strength of our specialty retail chains. Because of their high rents, landlords in our large downtowns will probability continue to seek retail chain tenants, or shift to other users who can pay those rents. Consequently, the large downtowns will continue to feel the impacts of the process of creative destruction that the retail industry still is in. On the other hand, relatively few suburban downtowns had many GAFO retail chains, and their numbers were substantially reduced even before the Covid19 crisis. Consequently, they neither benefit a lot from the presence of these retail chains, nor are they very vulnerable to the substantial vicissitudes that these chains may continue to face.
The Costs and Availability of Space. The ability of small merchants to recover and for startups to succeed will be significantly influenced by the availability and costs of their storefront spaces. While deflated rents and increased availability can be expected in both suburban and center city districts, the suburban rents long have been significantly lower and probably will remain so in a relative fashion well into the future. This fact, combined with the greater stability of their potential consumer market segments, probably will give the suburban merchants a greater chance of achieving a sound recovery, or a startup succeeding, than their center city peers might have.
Rent costs are particularly important for restaurant operations.
Remote Working.
The suburbs are also likely to benefit significantly from the shift to remote working:
Their numerous creative residents are likely to be in occupations prone to remote working.
Remote workers are likely to favor downtowns with strong CSD assets as they seek relief from the social isolation of their home offices, and they often also require business services and supplies.
Suburban communities are likely to have more relatively affordable housing, with more space per rental dollar than their regions’ center cities. This may attract many remote workers who are residents of the regions core cities. However, the affordability advantage might be blunted by rent deflation in the core city. For example, reports indicate that rents in Manhattan below 96th Street have already fallen by 20% to 30%.
Also recent research has shown that significant economic growth based on quality of life assets and the attraction of remote workers can lead to rising housing costs even in rural areas.
What will not be blunted, however, are the large numbers of people who prefer living in the suburbs, and they often include commensurately significant numbers of creatives, the group most prone to becoming remote workers.
It is fairly probable jobs will be decanted by a significant number of corporations from their prime big city locations to less expensive, auto accessible suburban satellite locations. Such office facilities will have cheaper rents than those in the core city downtowns, and provide corporate tenants places where their remote workers can come to get the social interactions they need to help their productivity, creativity and career advancement.
Recovering CSD Functions.
Many CSD venues have been hit very hard by the pandemic’s economic adversities. Almost all performance and exhibition venues have been closed or their public access severely limited. Many pamper niche operations closed permanently or shifted to operating online. Yet many of these operations, when allowed by local governments, have reopened on a limited basis, and the characteristics of some suggest that they will recover along with the local economy.
Two characteristics will determine those that will recover quicker and stronger and those that will not: if they are for profit operations and if they are large.
Small Arts Organizations. About 40% of the arts nonprofits are usually in the red financially, and mortally threatened by strong economic recessions and economic crises such as the present one. 6 Their business model is so dependent on contributions from numerous sources that their financial recoveries are seldom easy. So downtowns of all sizes are likely to have to wait quite a while for these smaller arts organizations to recover and contribute to their vitality.
Pamper Niches. In contrast, many of the pamper niche operations are for profits and relatively small – hair and nail salons, Pilates and yoga studios, dance schools, martial arts, studios, spas and gyms. They have relatively very low start up and operating costs, and little need to keep large inventories of goods on hand. While many were quick to close during an economic crisis, they are also relatively easy to restart or start anew as the economy improves. They are also the types of operations that often occupy large numbers of downtown storefronts, especially in the suburbs. Indeed, in many of our suburban downtowns there have long been complaints that these pamper niche operations were crowding out retail tenants because they could pay the higher rents landlords were looking for that small retailers found unaffordable.
Restaurants. Some of the most important CSD venues for all downtowns are their restaurants and bars. From early on in the crisis, there have been dire predictions of calamitous levels of restaurant failures – one foresaw the prospect of 85% of our eateries failing.7 These claims seemed to be supported by prior research showing that the average small restaurant only had enough cash on hand to cover their expenses for so few day, 16, that they were unlikely to stay open if they faced a major economic crisis – see table below. Months later, well into the current crisis, the Census Bureau’s Pulse surveys of small businesses have had consistently similar findings.8 One might have thought that by then their numbers would have declined as many went out of business. National survey data seems to indicate that about 20% of our restaurants may have closed do far.
The Center City district in Philadelphia recently published very interesting and well researched counter findings about restaurant closures.9 Well into the crisis, their survey found that only about 5% of their 1,078 restaurants had closed permanently, with another 19% closed temporarily. Just 19% were deemed fully opened and have indoor dining. Perhaps most interesting are the 600 restaurants (about 55%) that are classified as partially opened because they have outdoor dining, or only do take outs and deliveries.
My observations in the solidly middle income neighborhoods close to my home here in Queens, NY, also found a surprisingly low number of permanent restaurant closures. My communications with some suburban downtown managers yielded similar observations. The only reports of numerous closures I’ve found were about the eateries in the Midtown Manhattan CBD that are so dependent on tourist and office worker customers. The City’s Comptroller just issued a report that “found that more than 2,800 small businesses had permanently closed between March 1 and July 10, including at least 1,289 restaurants.” That would mean that about 5% of NYC’s restaurants closed, on par with the Center City findings.10
The fascinating question is: How are so many restaurants surviving so long when they never seem to have enough cash on hand to do so? CARES or other government program dollars? Owners not taking any salary? Dipping into their 401ks? Tapping extended family resources? Landlord forbearance? Public donations via gift cards, crowdfunding, etc.? The Center City research findings suggest a possible viable explanation: many are in some stage of operational hibernation – e.g., the 19% that are temporally closed and the 55% who are partially opened. Their reduced operational metabolism rates translate into a reduced need for cash. In turn, that means that the cash they have on hand can cover more days of operation. It also may mean that financial tools that are well within the restaurant owners control – such as dipping into 401ks, using credit cards, tapping family resources, etc. – can get many through the survival phase of this crisis if they hibernate. That also would mean that they are making substantial personal and family sacrifices in the hope that they again will earn meaningful annual incomes as they emerge from hibernation during the economy recovery.
If recovery means that these restauranteurs have to come out of hibernation and compete to again win adequate annual incomes, then it may prove to be a time period as, or even more, arduous than was the survival phase of the crisis. More restaurants may close because they will need to earn a lot more money to thrive than they did to survive, while they may have depleted the financial resources that helped them to survive thus far. Local market conditions will probably play a very important role in determining those eateries that will survive and those that will fail.
Households in the top income quintile (above $109,743 in 2017) accounted for about 38% of all the consumer spending for food away from home; those in the top two quintiles (above $66,898 in 2017) accounted about 61% of those expenditures. See table above. Moreover, so far into the crisis, employment in households with incomes above $60,000 has been far more secure than for those with lower incomes. Downtown restaurants able to easily tap affluent residential customers are more likely to survive the recovery than those that are not. The urbanized suburban downtowns tend to be in rather affluent market areas: in 2016, I estimated the annual household income at $188,000 for downtown Wellesley, MA; $131,000 for downtown Englewood, NJ; $152,000 for downtown Westfield, NJ, and $165,000 for downtown, Morristown, NJ. That will help their restaurants recover relatively quickly and substantially.
Let’s compare the prospects during the recovery phase of this crisis for restaurants in our superstar downtowns with those in our urbanized suburban downtowns:
Markets: The superstars must wait for the return of two very large market segments, office workers and tourists. Their residential markets may not be all that strong. Financially, that means many may have to wait quite a bit of time for their revenues and profits to return to the levels their owners were sacrificing to stay in business for. Their potential residential customers live mostly in nearby neighborhoods that are likely to have their own restaurants that are much closer to them. In contrast, the suburban downtown eateries rely mainly on the residential market segment that has never gone away and that savvy operators have been serving with takeouts, deliveries, and curbside deliveries during the crisis. These suburban eateries may also have office workers who are still present in the town in significant numbers, and others returning at a rapid rate as the virus’s impacts subside because of their reliance on autos to commute. New remote workers and newly decanted office installations may add significantly to their numbers. The suburbs’ consumer markets will start strong and may get even stronger. The superstars’ markets will start off very uncertain and require an unclear length of time to reach an iffy level of recovery. For example, though their office workerforces eventually may return, they’re very likely to be, at best, about 16% smaller in number.
Most arts tourists (tourists who attend arts events) visiting our large cities are not big spenders. A study of 21 study regions with populations over one million by Americans for the Arts that included the cities of San Jose, Dallas, San Diego, San Antonio, Phoenix, Philadelphia, Miami—Dade and Chicago found that, in 2016, the average arts tourist spent about $51.41 a day. See the table above. About 31% of that went for meals and drinks, averaging $16.05. Another $6.57 went for refreshments and snacks. While there certainly are significant numbers of wealthy arts tourists and they are likely to be among those who resume visiting our superstar downtowns fairly early, they will tend to go to the higher priced eateries. The less expensive eateries in these downtowns are less likely to see their tourist patrons return as quickly or as robustly. Their recovery is likely to be weaker and slower
Rents. During normal times, the lower commercial rents in suburban downtowns may have been equivalent to those in the superstar districts when the number of potential diners and their spending power are considered. Today, with the superstars’ disappeared market segments, increased risk, and uncertain rent deflation, suburban commercial rents look like a much better buy for all businesses, especially restaurants that are so rent sensitive.
Performing Arts Venues, Museums and Galleries. One might assume that the superstars are far richer in major arts, cultural and entertainment venues than the suburban downtowns, and that will help them to be better at attracting people back to their districts. In turn, that would enable them to better support local merchants. A closer look, however, reveals that their advantages may not be as strong as many might assume.
For example, superstar CBDs often have surprisingly few of these venues. In Midtown Manhattan, there are only two important museums, MoMA and the Morgan Library & Museum. The Metropolitan Museum, Whitney, Frick, Guggenheim, Neue Galerie, New Museum, Folk Art Museum, and many others are not. The major area for art galleries was in Soho, but is now in Chelsea and other parts of Manhattan. In Cleveland, the prestigious Cleveland Museum and Severance Hall, home to the Cleveland Symphony, are located about five miles from the heart of the downtown. It’s theater district, Playhouse Square, is about one mile away. Similarly, in Philadelphia, the Museum of Art, the Barnes and the Rodin Museum are outside the downtown district. MOCA and The Broad are In downtown LA, but LACMA. Hammer, Norton Simon, Annenberg, Huntington Library and Getty Center are not. Still, many of these superstar downtown museums are themselves superstars and that means that they are very dependent on tourists for visitation. For example, about 75% of MoMA’s visitors are tourists. See table above. Their full recovery and ability to activate the downtown will probably await the return of the tourists.
Strong art museums are seldom found in suburban downtowns, so how strongly these districts are activated is not dependent upon them, or their recoveries, or the return of lots of tourists.
Theater clusters are certainly to be found In some of these large downtowns such as Manhattan and Houston, as are performing arts venues such as Carnegie Hall and Madison Square Garden in Manhattan, the Kimmel Center for the Performing Arts in Center City Philadelphia, and the Music Center in downtown LA. However, in Manhattan, the Lincoln Center for the Performing Arts is located close to, but beyond the Midtown CBD. These venues are often considered world class, and that usually means that they, too, are heavily dependent on tourist ticket buyers. About 66% of the attendance of Broadway’s theaters are tourists, as is about 46% of Lincoln Center’s. Some observers claim that tourists will return once these venues open. However, getting Broadway shows ready to open will take time as will the scheduling and staging of other performing arts events. The Broadway League, for example, is now talking about reopenings starting around June 2021, but how long it will take to achieve a full recovery is still unknown.
These performing arts venues have another characteristic that poses serious problems for the downtowns and neighborhoods in which they are located. For very substantial parts of many days they are dead and inert, only coming alive outside for relatively brief moments before and after performances that occur usually during the evenings and a few afternoons. When inert, they diminish from, instead of contributing to, the sense of activation and pedestrian friendliness of the sidewalks they abut.
A number of these urbanized suburban downtowns do have sizeable performing arts venues, though most do not. In NJ, for example, The Count Basie Theater in Red Bank was the attendance leader among the state’s theaters in 2016 and 2017 selling 235,000 tickets. It has a budget of around $17,000,000.11 The Mayo Performing Arts Center in Morristown, NJ, has an annual attendance of about 200,000 and an annual budget of about $8, 000,000. It is a major component of the downtown’s strong and broadly defined entertainment niche that also includes a six-screen movie theater and eateries and bars that have annual sales above $100 million. The Bergen County PAC also has attendance in excess of 200,000 and an annual budget of about $10,000,000. These performing arts organizations have significant budget, and their audiences are not heavily dependent on tourists. Similar performing arts venues located in less affluent suburban markets have budgets well under $2,000,000 and lower attendance. The larger the budget, the more likely these performing arts organizations will survive through this crisis and recover. Once social distancing precautions are lifted, their primarily regional audiences, often from affluent households with members in creative occupations, can be expected to quickly return as their productions are presented. However, many of the weaker suburban performing arts organizations may struggle to recover or fall to the wayside—as will be the case pretty much everywhere.
Some Challenges and Opportunities Suburban Downtowns Will Likely Face
Downtown Cinemas Are Again In Danger. DANTH, Inc has been following the plight of downtown movie theaters for about 15 years. During that time streaming via cable or online was a persistent and slow growing threat to our traditional brick and mortar movie theaters. By releasing movies electronically either before or simultaneously with the theater releases the potential audiences of the theaters are substantially diminished. The Covid19 crisis has shut down movie theaters either completely or substantially. Streaming has grown enormously in utility, attraction and supporters among producers, and there is general agreement in the trades that it will be much more important in the future, and there is no going back. It’s a very cheap and efficient distribution channel that is unconstrained by the need for social isolation. Warner Bros. just announced that it will release all of its 2021 films on HBO Max at the same time that they open in theaters. Other studios are expected to soon follow.12
This Problem Is Especially Dire for Many Suburban Downtowns. How many movie theaters and theater chains will survive the crisis is a question of considerable interest to all types of downtowns, but much more important for those in the suburbs. For many, their movie theaters are their strongest arts/entertainment draw, especially after dark. Moreover, they invariably occupy strategically important locations in buildings that often are difficult to convert to other uses. Also, movie houses are among the most reasonably priced of all entertainment venues, and they have rather few user frictions compared to going to a sports event, concert or stage play.
Streaming may mean that it will be much more difficult for operators to make sufficient profits to recover from the crisis and stay in business long term. However, during the digital projection conversion crisis of a few years ago, many towns used community owned businesses to step in and save their cinemas. Suburban downtown leaders soon may find that tool can be used to save theirs’s, too. Moreover, a whole toolbox of tools to capture community value is emerging that also can be used. The leaders of these suburban downtowns should prepare for such a contingency since quick action is often needed to save these cinemas.
Unrealized Potential to Develop Strong and Well – Activated Public Spaces. By and large suburban downtowns lack popular, well-used downtown public spaces. Within their communities, the parks are generally located elsewhere. Additionally, even when they do have a physical public space downtown they are usually badly under-utilized, mainly purposed as adornments, ceremonial venues, and weakly scheduled event spaces. Where the missing vibrant public spaces are most surprising is in the urbanized suburban downtowns that have so many potential eager users and operations such as loads of strong eateries that mesh well with them.
In the past, this was just a missed opportunity, but with the need of these downtowns to have strong attractions that can again draw lots of people downtown, they well may be a savvy strategic move, or even a necessity. This need will also be reinforced if the local cinema weakens or closes.
The crisis induced closed streets and parklets can also provide these suburban downtowns a way of creating quickly and cheaply some needed spaces. Given that the sidewalks in many of these districts are fairly narrow, such projects can have a variety of immediate benefits. Still, the formula behind strong public spaces such Bryant Park can be distilled to scale to the smaller sizes and different characteristics of the urbanized suburban downtowns. A good place to start doing this is Andy Manshel’s new book Learning From Bryant Park.13 Here are a few things that interested downtown leaders might consider:
Location really matters. A public space on the periphery will have far fewer users and far weaker positive impacts on its surrounding properties and their uses.
How the space is programmed will have a far greater impact than how it is physically designed or how pretty it was meant to be. This is a major point that Andy strongly argues for.
Simple things really matter: as Holly White pointed out, if you want people to stay, they will need places to sit. Shade also counts. Andy stresses in his book that you don’t have to spend big bucks to succeed.
With programming, test things out and if they don’t work well, learn what went wrong, then either fix them, or do something better. Also, iterate, keep refreshing an improving the programming you have.
Just don’t think about events. Think also about how people-watching can be facilitated and enhanced. Public spaces can proved opportunities for people to do things, to let them become the space’s performers such as chess tables, boules courts, ping pong tables, reading rooms, ice skating rinks, carousels, swings, climbing rocks, etc.
Bottomlines
Urbanized suburban downtowns, with strong CSD functions, that are able to draw upon large numbers of creative class households, have growing numbers of remote workers, and maintain steady consumer market segments are well positioned to experience relatively strong economic recoveries from the Covid19 induced economic crisis. They can do even better if they take steps to protect their movie theaters and develop vibrant public spaces.
It’s about time that academics and economic development professionals realize that suburban downtowns do not grow or function in the same ways that our urban districts do. The suburban districts depend far, far less on being employment centers and more on being the central place for people to meet, enjoy themselves, help each other, buy necessities, and sometimes to buy non-necessities. Daytime workforces may be very important customers for district merchants, but their workplaces are far more often than not located beyond the district’s borders, and sometimes even in other towns. Their downtown housing is not driven strongly by live-workers, yet it can provide a very important in-close user/shopper base. Most of their shoppers also get to the downtown by car, and will continue to do so until AV shuttles and micro mobility vehicles provide viable alternatives.
ENDNOTES
1) Source: John Shapiro, formerly of Phillips Preiss Shapiro Associates, based on interviews with New Jersey Transit officials while working on multiple TOD projects in northern NJ, including for NJT.
3) N. David Milder. Remote work: An example of how to identify a downtown-related trend breeze that probably will outlast the COVID-19 crisis. Journal of Urban Regeneration and Renewal Vol. 14, 2, 1–20. Forthcoming.
4) The chart is from: Michael Sasso and Andre Tartar. U.S. Downtowns Yearn for Vaccines as Merchant Traffic Off 79%. https://www.bloomberg.com/news/articles/2020-12-03/u-s-downtowns-yearn-for-vaccine-as-merchant-traffic-falls-70?sref=mHw3n8zP
5) Christine Barton. BCG LUXURY PERSPECTIVE. Luxury First Look 2021| Where are we headed? September 2020. Presented at the Future of Luxury Conference, September 23-24, 2020, convened by Luxury Daily.
We Need More Than Pollyannaish or Wishful Thinking for Our Downtowns to Recover and Thrive
We are in the midst of what many observers have called the deepest crisis this nation has faced in many decades. It has been especially injurious to our downtowns because it has necessitated massive social distancing that makes it impossible for so many downtown entities, — e.g., shops, eateries, offices, movie theaters – to function properly or profitably. In this situation, it is understandable if downtown leaders and stakeholders look for signs that their future will be considerably better. Hope is perhaps the most underestimated, yet essential ingredient of any downtown revitalization or recovery. Still, if our downtowns are to recover, we must face realities and overcome some exceptionally strong challenges, while taking advantage of any new opportunities that this terrible crisis either creates or reveals.
In recent weeks a number of articles have appeared that have been quite pollyannaish about the recovery of our downtowns based on either wishful thinking or sloppy analysis. These puff pieces may be good for instilling hope, and perhaps are even needed. However, they are no substitutes for the kind of critical thinking and contingent planning that we need to start doing now if we are to robustly recover as quickly as possible.
Will Entrepreneurial Gold Dust Really Fall to Spark Our Economic Recovery?
The Wishful Trend. One retail expert has recently written:
“When all the dust settles, the post-lockdown era should provide a boost to downtown areas, in part due to newly unemployed but highly skilled restaurant and retail workers opening new businesses in downtowns where rent prices will trend downward.
The pandemic has left millions of highly skilled workers from the retail and food and beverage industries unemployed and eager to work. Many of these people are highly motivated to start their own businesses, creating an unparalleled pool of talent and potential entrepreneurial interest.
In a recent Forbes article, Bernhard Schroeder wrote: ‘27 million working-age Americans, nearly 14 percent, are starting or running new businesses. And Millennials and Gen-Z are driving higher interest in entrepreneurship as 51 percent of the working population now believes that there are actually good opportunities to start companies.’”1
A Reality Check. However, Schroeder was citing data from the “Global Entrepreneurship Monitor United States Report 2017” published by Babson College in 2018. It must be noted that:
The GEM data are from before the swift and powerful economic decline the Covid19 crisis caused. There is no telling yet of precisely how the crisis has diminished the number of nascent firms or killed off the young firms under 42 months old that the GEM studies look at. A reliable picture of the situation may not be possible until the CARES subventions time out.
Although the 2017 Gem study found that the Wholesale/Retail sector accounted for the highest proportion of the nascent and young firms in the United States, 21% , it had not grown from the previous year and was “dramatically lower than the average of the 23 innovation-driven economies, 31%.”2 Just a year later the Gem study found that the finance, real estate and business services accounted for 27% of the new and nascent firms, while retail, at 26%, still considerably trailed the other high income economies at 36% (see chart below from the 2018 Gem study.) 3
Retail has long been a downtown storefront space use, but in pre-crisis years many downtown leaders were worried about their ability to attract and maintain retail tenants. The Gem study showed that we were not generating as many retail startups as other innovation driven economies. And that was in relatively good economic times.
The fastest growing sectors for entrepreneurship were those that involved technology and knowledge – possibly good for generating office demand , but not exactly the types of firms noted for tenanting lots of downtown storefronts.
The Millennials and Gen-Zers are among the two most economically screwed generations in living memory, so while many of them may have had an interest in entrepreneurship in 2017, even then raising capital for such a venture was probably a frequent barrier to actual entry. Many of them are so strapped for income that they are still living with their parents, and Covid19 has increased their numbers. Raising capital was probably less of a challenge for those with gig or freelance sole proprietorship, but those “firms” also don’t fill many downtown storefronts.
Most importantly, and more precisely, we don’t know how startup rates will be impacted in the sectors that are most likely to produce tenant prospects for downtown storefronts – or which sectors they might be. How the continued growth of online retail sales and their integration into omnichannel operations will play out in terms of the amount, kind and location of physical commercial spaces remains to be seen. While most pamper niche operations have low initial capital costs and relatively low operating costs so they can be reconstituted with comparative ease and speed during a recovery, there is a real question about the availability of the types of consumer discretionary spending dollars they depend on.
Nor do we know how the Covid crisis’s economic impacts will influence current and future levels of interest and intent in becoming an entrepreneur. Most importantly, we don’t know how interest and intent will be impacted in the sectors that are most likely to produce tenant prospects for downtown storefronts. The blue line in the above chart from the 2018 GEM study shows the level of people aged 18-64 who intended to become an entrepreneur within a few months. The path is upward, though it shows much fluctuation, a Great Recession climb, and a bumpy 2016-2018 ride. The red line shows the percentage of the 18-64 population who are either a nascent entrepreneur or owner-manager of a new business, e.g., between 3 and 42 months old. It dived through the start of the Great Recession and then had a mostly upward path since. Obviously, these firms benefited from a recovering economy. Unfortunately, GEM does not provide a sector breakdown. Given that the constructive destruction in the retail industry and serious problems in several parts of the restaurant industry had already appeared, there is reason to suspect that nascent and young firms in those industries were not doing as well as those in other industries.
Recent losses of retail jobs have been huge, and industry reports indicate it will continue to grow through this year, as record numbers of retail stores are closed (perhaps over 20,000), and many chains enter bankruptcy. Are more retail workers, past or present, likely to find appealing startup opportunities in this kind of retail industry than in pre-crisis years? Will other entrepreneurs find the opportunities in the retail sector more potentially rewarding and less risky as those to be found in other sectors?
The attempt to see unemployed retail workers as an asset that will convert into an above average level of new retail startups as we recover may carry with it the implication that unemployment creates a high level of job need to which heightened entrepreneurship is a response. The 2018 GEM study presents data on the number of nascent and young firms (the total TEA) that were “necessity driven (see blue line in chart below). The necessity driven firms over all the years studied steadily account for a relatively small portion of all TEA firms. While the Great Recession did increase their number for some years, overall their number did not change all that much, and never reached levels where they might spearhead startup led downtown recoveries.
B&M retail stores are taking on new functions and that may mean the skill sets of former retail employees are increasingly outdated and provide no advantage for starting up new types of retail and restaurant operations. For example, a new type of department store is appearing, — e.g., Neighborhood Goods, Showfields, b8ta – that sells curated collections of merchandise created by online birthed merchants.4 Also, the growing number of “ghost kitchens” can reduce the relevance of kitchen skills in the restaurant industry.
Restaurants, another major source of downtown tenants, also have been clobbered. Prior to the crisis many parts of this sector, e.g. casual dining, were already showing stress. The current need for social distancing and the apparent current danger of indoor dining, makes it very hard for restaurants to make needed profits. Until models for restaurants operating profitably under these conditions emerge, or the crisis significantly abates, will the sector be able to maintain the interest of entrepreneurs and its skilled workforce?
Here again the competitiveness of the opportunities the restaurant industry offers in terms of potential rewards and risks is very relevant. Restaurants have long had a very high failure rate compared to other industries – and Covid19 has certainly not done anything to diminish that fact. Also, external financing for restaurants has long been relatively hard to get, and their startup costs, if a full kitchen is involved, can be high. Self-financing during a recession and in its recovery years is also likely to be difficult.
Much is being made about the costs of store space. They typically amount to about 10% of the total sales of restaurants and various studies over the years have found that they are between 8% to 12% for most downtown merchants.5 Rents may indeed be important, but these firms have many other costs such as labor, inventory, insurance., etc., to factor in and be concerned about.
The Kauffman Foundation’s 2017 State Report on Early-Stage Entrepreneurship found that “the rate of new entrepreneurs ranged from a low of 0.16 percent in Delaware to a high of 0.47 percent in Wyoming, with a median of 0.30 percent. This considerable geographic variation certainly might also characterize the emergence of new entrepreneurs as we recover economically from the Covid crisis. It certainly suggests that entrepreneurship levels are dependent on a set on conditions, not just the cost of space, and will vary geographically with their strengths and weaknesses.
This is not to say that the recovery will not see either new downtown firms appearing or the full reopening of downtown firms that had suspended their operations. The question is how many of these startups and recovering firms can fill downtown storefronts with well activated and magnetic uses? Will they bring downtown vacancies back to acceptable levels? Will they bring customer traffic back to or above prior levels? Or will they just fill a few vacancies with drab uses that attract weak flows of customer traffic? Right now the difficulty of answering those questions is compounded by the fact that we probably won’t know the full extent and dimensions of our downtown vacancy problems until after the CARES subsidies time out, when the downtown operations then have to support themselves from “normal” type operations.
Is There a Real and Strong Startup Trend That Downtowns Can Ride to Recovery? If one goes back to some Kauffman Foundation studies about entrepreneurship in the decade or so prior to Covid19, one sees that there was not any steady trend of growing entrepreneurship. Indeed, there were ups and downs, with some concerns about it stalling or even seriously declining. 6 Covid19 may be sparking a number of startups in industries that help individuals and firms cope with the crisis, but I have not observed, or heard from professional friends, or seen any published reports that claim it is causing lots of new downtown storefront-filling firms to open. There is no data-proven strong startup trend for downtowns, especially in smaller cities, to ride to their economic recovery.
In sharp contrast, there are loads of data to show that remote work increased enormously in response to the crisis and lots of surveys that show that significant numbers of both workers and employers now think their remote work arrangements will continue on into the post crisis era. These are signs that remote work is a trend that has a good chance of lasting. There are no comparable data signals for resurgent entrepreneurship in the sectors that might occupy downtown storefronts, such as retail and restaurants.
Do We Just Sit on Our Hands? The settling of the crisis’s dust may or may not occur anytime soon. Whether it happens quickly or slowly can be pivotal. As John Maynard Keyes famously wrote “In the long run we are all dead.” The full impacts of other trend breezes such as remote work, changes in commuting patterns, and e-shopping may well take a decade or more to play out. They in turn may have big impacts on the demand for downtown storefront spaces, space uses, and occupancy rates.
What will happen to our downtowns during those years? Should downtown stakeholders and management organizations then just wait for the dust to settle and hope that new startup merchants will appear? If not, then what should/can they do?
Contingent Planning
Since it is far from certain that entrepreneurial gold dust will fall from heaven as the Covid crisis ebbs, perhaps it is valuable for downtown leaders to do some contingent development planning about what they can and will do to cultivate the types of small businesses that can tenant their district’s storefronts. Here, again, the variation in local conditions will probably mean a corresponding variation in responses. And prudence suggests anticipating a process of trials, errors, learning and adapting.
Community Supported Enterprises. For many years prior to the Covid crisis, in downtowns and Main Streets that were suffering storefront vacancies, severely weakened retail, and even food deserts, some local leaders created successful solution paths to these challenges. In our Covid economic recovery period, many other downtowns of all sizes may find these solution paths worthy of consideration. These solutions were most apt to succeed in situations where profitable operations were possible, but investors considered the rewards of entering these downtowns or Main Streets lower and riskier than the opportunities they were being offered elsewhere. Some of these solution paths are:
Using crowdfunding to help open and/or maintain businesses strongly wanted by the local community
Using Community Owned Enterprises to save and operate key commercial operations
Using local social assets, such as social clubs, to leverage business development 7
Towns buying and operating failing essential retail operations, such as groceries.
Using such business models, and any riffs upon them, may help many downtowns and Main Streets recover their vibrancy over the next few years. They may be essential components of a New Deal program to revive retail. For more information about many of these business models see The Spotlight group of articles in the forthcoming Fall Issue of the American Downtown Revitalization Review at https://theadrr.com/ that will appear in September 2020.
Creating Supportive Small Town Entrepreneurial Environments.8 While much attention has been given to the creation of Innovation Districts, this concept is so large scale and complicated that it is only really applicable to big city downtowns and neighborhoods that are present in about 349 of our cities. Our remaining approximately 19,000 incorporated places also need a supportive startup culture and environment, but one that is simpler, less expensive to create and operate, and appropriately aspirant in its growth objectives. That is especially true at a time when many, if not most, downtowns will probably be striving to cultivate their own startups to occupy their storefronts. Such a Small Town Entrepreneurial Environment (STEE) might include: social places for new and small business operators to meet and network; access to viable funding sources; effective technical assistance; joint marketing programs, and affordable spaces in reasonable condition. It basically can take many existing downtown assets, such as libraries, bars, coffeeshops, makers places, community colleges, a downtown organization that invests in businesses and has niche marketing programs, etc., to create an informal district-wide business incubator and accelerator, Libraries in particular, are emerging as critically valuable STEE assets. Unfortunately, most downtown organizations do not yet see being actively engaged in small business development and expansion as a proper role for them to play. Nor do they exhibit any comfort or skills in playing that role when they do. A contingent planning effort could focus on how downtown leaders would foster the emergence of STEEs, should the need for it arise. This will likely entail a reappraisal of the roles the downtown organization should and can play.
Small Merchant Training. The Covid crisis has reinforced the growth of two important nascent merchant trends:
Small and micro firms were weaving increased online activities with the operations of their brick and mortar stores. Customers ordering online and then picking their orders at the curb or at the storefront is one example of this.
More small merchants were tapping customers in distant market areas via their online storefronts and attending distant trade shows and fairs.
A contingent planning effort also could focus on how downtown leaders could encourage and train more of our smaller downtown merchants to use an omnichannel marketing operation that would help them to capture more sales dollars from both local and seldom before penetrated distant markets.
However, even prior to the Covid19 crisis, small merchant training has long been a challenge. In my experience, merchant training programs are often advocated, but seldom effectively implemented. The vast majority of them underperform because they ignore basic merchant needs and behavior patterns. Far too often, they want to EDUCATE the small merchants, and make them, for example, marketing savvy or bookkeepers. That can take a lot of merchant time and effort while providing them with more information than they have any need for near-term or even probably well into the future. Instead, what the merchants want is not to be taken to school, but actual solutions to their specific immediate problems. They want action steps that are credibly viable, affordable and easy to do. They don’t really want courses, workshops, or seminars. And they prefer not leaving their places of business.
Also, in my experience, many small merchants are resistant to any suggestion that they are not doing things as well as they could be done, while others find it hard to ask for help even when they badly need it. Small merchants are often small merchants because of their need for independence and a strong sense of their own efficacy.
Merchant training programs would probably be more effective if they:
Consider small merchants behaviors and attitudes as much as they do the information the program’s experts believe the merchants should learn
Give merchants access to training that is closely tied to their immediate needs, and less into making them better, more knowledgeable entrepreneurs. Blasphemously, feed them fish, don’t try to teach them how to fish. Small merchants play too many roles to be experts in all of them, and they lack the dollars to hire others to take on some of them.
When possible, facilitate merchants learning from their peers whom they know, like and respect. In turn, that means it’s very productive to identify in a downtown those merchants who can be models and mentors for other merchants, and then to leverage them.
Start off by identifying the low lying fruit that can produce the quick wins that will enable the training program to swiftly show other nearby merchants what it might do for them.
Perhaps some of national organizations such as IDA, IEDC, and National Main Street can develop such improved small merchant programs that can then be easily tailored to local conditions. Leaving their development solely to organizations such as SCORE or the SBDCs is a massive mistake. A strong need for such programs existed well before the Covid19 crisis, and will very likely far out last it.
ENDNOTES
1) Robert Gibbs. “After Lockdown, New Opportunities for Downtown Shopping Districts” at https://dirt.asla.org/2020/05/13/the-pandemic-will-lead-to-a-revitalization-of-main-street-retail/ Matthew Wagner wrote an interesting article on the Main Street Blog that also extolled our penchant to be entrepreneurs as a path to recovery, but most of the piece usefully went into the need for various things that I would associate with creating what I called above a STEE. See: Matthew Wagner,” Main Street America. Main Spotlight: COVID-19 Likely to Result in Increased Entrepreneurship Rates” June 9, 2020. https://www.mainstreet.org/blogs/national-main-street-center/2020/06/09/covid-19-likely-to-result-in-increased-entrepreneu
2) Julian E. Lange, Abdul Ali, Candida G. Brush, Andrew C. Corbett, Donna J. Kelley, Phillip H. Kim, and Mahdi Majbouri. “Global Entrepreneurship Monitor United States Report 2017” published by Babson College in 2018, p. 27. https://www.gemconsortium.org/economy-profiles/united-states
3) See: Julian E. Lange, Candida G. Brush, Andrew C. Corbett, Donna J. Kelley, Phillip H. Kim, Mahdi Majbouri, and Siddharth Vedula Global Entrepreneurship Monitor United States Report 2018” published by Babson College in 2019 https://www.gemconsortium.org/economy-profiles/united-states
4) I want to thank Mike Berne for bringing these stores to my attention.
5) See for example: Kate Paape and Bill Ryan, University of Wisconsin-Madison/Extension Division, and Errin Welty, Wisconsin Economic Development Corporation. “A Comparison of Rental Rates Charged for Downtown Commercial Space: A Market Snapshot of Wisconsin Communities”. August 2019 https://economicdevelopment.extension.wisc.edu/files/2019/10/Downtown-Rent-Study-100119.pdf
6) See: “Victor Hwang Testimony Before U.S. House Committee on Small Business, Subcommittee on Economic Growth, Tax and Capital Access,” February 15, 2017