The Changes in the Retail Industry That Are Impacting Our Downtowns

By

N. David Milder

Introduction

Since 2009, the Downtown Curmudgeon has been writing about the “new normal” that has emerged for our nation’s downtowns. One of the most important features of this new normal is the great changes occurring nationally in retailing that are having significant impacts on downtown retail growth potentials. While such growth is still possible, for many downtowns, the changing nature of our retail industry has made it much tougher to achieve.

A follow-up article will investigate how these retail changes are impacting different types of downtowns in different ways. The attention here will be on those retail industry changes.

The Reduced Demand for Retail Space

For downtowns, one of the most important changes is that retail chains, especially those in the GAFO category, are looking for far fewer new store locations than a decade ago and the new stores are significantly smaller than those constructed in the years before the Great Recession. In other words, the demand for new retail space by national and regional chains has diminished substantially. Mall construction has fallen to a trickle, while 15% to 20% of the existing malls are in danger of closing. Within the commercial real estate industry there is finally a recognition by many that, nationally, we just have too much retail space – the US has about five times more shopping space per person than any other nation. Significantly, the retail chains now are only looking at proven strong locations that offer minimal risk. In effect, this means that most downtowns – not the wealthiest and most successful — have been demoted by the chains as potential locations for their stores.

The Deliberate Consumer

One prime driver behind this reduction in retail space demand is the emergence of the “deliberate consumer.” Their more prudent spending has impacted retail sales and consequently the demand fro retail space. For over a decade prior, the earnings of middle-income households had been stagnant and the Great Recession brought about a very significant change in their consumer behaviors. These middle-income consumers bought less and became more cautious about what they purchased, giving much higher priority to needs than wants. They also paid down their credit cards and became more circumspect about using them. The strong recession even encouraged members of more affluent households to spend more prudently. In more recent years, employment prospects, incomes and the overall economy have improved and some increased consumer spending has followed. However, cautious purchasing behaviors are still seen, mostly in middle-income households, though also to a lesser extent in households in the $100,000- $250,000 income bracket.

In a large number of metro areas, the middle class is shrinking significantly in numbers, while the numbers of those with higher and lower incomes are growing. This has obvious impacts on retailers – middle market retailers are languishing and disappearing as consumer incomes polarize.

bls-data-cex-quintiles

Those in the top quintile of household incomes account for a disproportionate share of our nation’s consumer expenditures. Although they account for 20% of the households, in 2015 they made 40% of the consumer expenditures for food away from home, 41% of the furniture and home furnishings expenditures, 44% of the apparel expenditures and 42% of the entertainment expenditures (see the above table). The lowest three income quintiles, composing 60% of all households, only accounted for 35% – 37% of the expenditures in those retail product categories.

Another factor threatening to suppress retail demand is the emergence of Millennials as our largest age cohort. Millennials are more interested in experiences than things and they spend much less on retail than the Baby Boomers did at a similar age.

E-Commerce

The other major influence on the reduced demand for retail space has been the growth of e-commerce. According to the Census Bureau, in the second quarter of 2016, e-commerce only accounted for a small portion of the nation’s total retail sales, 7.5%. (It was 3.9% in the 2nd quarter of 2010.) However, as shown in the table below, when we look at sales by retail product category, e-commerce’s market share is often significantly higher. By 2013, 79.5% of the sales for music and videos, 44% of the sales of books and magazines, 32.9% of computer hardware and software sales and 28.8% of toys, hobbies and games were transacted on the Internet. The product categories least impacted by e-commerce are drug, health and beauty products, 4.7% of sales, and food and beverages, 9% of sales.

ecommerce-retail-2013-and-projections-xls
E-commerce is capturing surprising amounts of sales even in categories that have large, hard to ship products such as electronics and appliances and furniture. The research by Hortac?su and Syverson indicate that, if trends continue, these product categories will have 50% of their sales transacted online in 2017 and 2022 respectively. E-commerce also has made surprising inroads in the clothing, accessories and footwear category, where seeing, touching and trying on the products are supposedly so important, 14.9% of sales. Moreover, it is projected to capture 50% of this category’s sales by 2024, if current trends hold!

Significantly, while e-commerce has only captured about 17% of the sales for office equipment and supplies, Staples has been closing many stores and downsizing many others. Similarly, while e-commerce has only captured about 15% of the sales of clothing, accessories and footwear, many apparel firms have been hard hit. Chico’s, for example, closed 120 stores in 2015 and has been busy trying to strengthen its online presence. American Eagle is in a similar position.

That’s a lot of sales potential being taken away from downtown retailers – unless they, too, also can compete on the Internet.

Additionally, research has shown that the Internet is involved in at least 45% of all retail purchases. Many people, for example, now research the products they want and the shops that sell them before they go out shopping.

Some Green Shoots

However, the green shoots of a counter trend have surfaced – e-commerce retailers such as Amazon, Harry’s, Warby Parker, Bonobos, Blue Nile, and Birchbox have opened brick and mortar stores. Warby Parker has 32 locations and Bonobos has 20. Amazon just opened its first, whether there will be more remains to be seen. (It has taken a large space on 34th Street in Manhattan, but it’s not yet clear what it will put in there.) Also, it is de rigueur among today’s retail experts that a multi-channel approach, including both online and brick and mortar stores, is the key to success, so more brick and mortar stores opened by online retailers can be expected. The key question is how strongly will these green shoots grow?

Affordable Rents

Two positive characteristics of the new normal for our downtowns are that a lot of their revitalization efforts are successful and there is now the expectation that most of them can be vibrant and economically healthy places. However, this success has usually led to significantly higher commercial rents. Small retailers, who already have long been plagued by difficulties in raising capital and operating funds as well as burdensome municipal regulations, now often are facing unaffordable rents. In other instances, rents have been declining or holding steady. The critical factors seem to be whether retail chains are entering or leaving the downtown and whether new retail spaces are being constructed.

How Are the Retail Chains Doing?

Among the retail chains, department stores (e.g., Macy’s, Sears-Kmart, Kohl’s, JCPenny, Nordstrom, Bob-Ton) are flailing and have closed many stores. They are not only fighting the ever growing e-retailers, but also the off-price retail such as TJ Maxx. Macy’s is even trying to create in-store off-price operations. All are trying to buttress their own e-commerce operations.

Specialty stores (e.g., American eagle, Chico’s, The Gap, Talbots, Coach, Abercrombie & Fitch, Eileen Fisher, Williams Sonoma, Crate and Barrel) have also been closing locations and/or struggling to develop strategies suited to their new retail environment. They, too, are challenged by the e-retailers. The more traditional specialty chains in the women’s apparel sector have really been struggling as they compete with:

  • Foreign low-price, fast fashion operations such as Zara and H&M.
  • Off price, value –oriented and low prices chains such as TJX, Burlington Coat, Filene’s Basement, Ross, Stein Mart, DSW and the low priced dollar stores/ These have been strong post-recession performers.

Value oriented outlet malls are likewise strong performers. Indeed, some department store chains have developed their own off price/outlet chains, e.g., Nordstrom Rack and Saks Off 5th.

Supermarket anchored shopping centers are showing significant strength.


 New 25,000 SF Target in an Affluent Residential Neighborhood  About a Half Mile From Chicago’s Michigan Avenue’s Magnificent Mile

Large big box chains are plodding along, trying hard to adapt to the Internet competition and doing better where their locations’ grocery offering are robust or if they are in the home improvement sector. Walmart and Target are focusing now on using smaller formats to enter dense urban markets (see above photo), but they have rejected their use in sparsely populated locations. For example, in 2016, Walmart announced closing 154 stores, 125 of which were in the smaller Walmart Express and Neighborhood Market formats; they were disproportionately located in low-income, low-density areas.

With consumers making far fewer “trading up” purchases, mass luxury retailing has weakened, though true luxury brands are still doing better than most other retailers.

How Are the Small Independents Doing?

Systematic research on how these retailers are doing under the new normal for our downtowns is hard to find, so I must rely on my field observations and interviews:

  • Here in Kew Gardens, NY (a village in the big city) lots of the small retailers closed during and soon after the Great Recession. However, the vacancies have slowly been leased and more often than not by far stronger operators. Lots more food and beverage establishments and dollar store type operations.
  • In many parts of Manhattan, rising rents and the great recession have forced small GAFO merchants to completely disappear. Similar patterns were observed in many other large cities we visited.
  • On the other hand, in many smaller downtowns, often those with few or no GAFO retail chains, a surprising number of independent apparel shops are to be found (e.g., Morristown, NJ, Woodstock, VT, Great Barrington, MA). Some of them survived the Great Recession (a few quite surprisingly), while others opened more recently. Before and during the Great Recession, downtown independent apparel merchants appeared to be a dying breed. Why the apparent turn around? One hypothesis: not only the absence of apparel chains in their downtowns, but also their absence and/or weakness in their larger trade areas? To some degree, the growing weakness of national chains’ brick and mortar stores appears to be giving small independent retailers the opportunity to capture more customer expenditures.
  • I am seeing more and more millennial small merchants who from the get-go are adept at using websites and the social media. The problem of Internet inept independent merchants seems to be naturally “aging out.”


Retail Leakage Analyses Should Be Treated With Great Caution by Analysts and End Users: 2 Some Serious Data Issues

By N. David Milder

Introduction

This is the second of a two-part article on the need to be very cautious when doing or using a leakage analysis. Part 1 focused on the analytical issues associated with this economic development research tool. It can be found at

https://www.ndavidmilder.com/2016/09/retail-leakageleakage-analyses-should-be-treated-with-great-caution-by-analysts-and-end-users-analytical-issues.

This article will focus on the problematical data too often used in leakage analyses.

GIGO is an acronym well-worth knowing. It stands for Garbage In, Garbage Out. Too many leakage studies are very problematic because the data they use are very questionable. This is often not the result of data suppliers being slovenly in their data gathering or analysis – although sometimes, it is – but because getting information about small and medium sized firms’ sales, workforces and finances can be very difficult. To counter this problem, the leakage market data firms sometimes will try to use business census and related data to estimate the sales of the firms in the major NAICS codes that have been identified in a study area. Their resulting estimates are not based on primary research and have a number of degrees of separation from the original firm level data that is usually unknown to the data purchasers. Different research firms will have different methodologies for making these estimates. Which, if any of them, produce accurate estimates about NAICS retail categories’ sales is a key question. Unfortunately, I have not seen any studies that validate the accuracy of these estimates. This suggests caution and prudence in their use.

A Good Starting Point for the Discussion

esri-vs-sales-tax-retail-sales-estimates-xlsx

The table above is a good starting point for this discussion. It shows the results of the leakage analyses generated by Nielsen and Esri for a city in the West that has a population of about 30,000. These two respected private firms provide a lot of the demographic and business data used in the economic development field and the table is representative of the leakage analysis data they produce. They certainly are not the only ones that generate the data used in a leakage analysis, but because of their affordable prices and easy online access, they are used by many EDOs (mostly by their consultants) looking for such information.

The table’s first column shows the NAICS retail categories being analyzed. Leakage analyses subtract retail sales in the study area from consumer expenditures. If the expenditures exceed sales, there is a leakage. Conversely, if sales are larger than consumer expenditures, there is a surplus. Columns three-five provide the data on consumer expenditures, store sales and leakages/surpluses for each category. The data in columns three and four are estimates – these firms have not directly surveyed the residents of City XYZ about their expenditures or the retail stores about their sales. That’s one reason why their leakage analysis reports can cost $50 and not $25,000. The data in column five are simply the results of subtracting the data in column four from those in column three.

Given that the numbers in column five are supposed to facilitate an understanding of economic growth potentials and possibly an assessment of the market viability of substantial private investments, looking at the table probably leaves the reader disturbingly confused. While there is agreement in direction (i.e., leakage or surplus) and quantitative closeness in some categories, e.g., gasoline stations, furniture and home furnishings, on many others the size of the leakage/surplus differs substantially, e.g., food and beverage stores, or conflicts on direction, e.g., health and personal care stores and eating & drinking places.

Looking at the estimated data in columns three and four, there is an even more divergent pattern. The estimates of both consumer spending and stores sales are in most cases substantially different. These two market data-producing firms are obviously using very different methodologies and/or formulas to generate these estimates.

How, then, do we know which, if any, of these leakage estimates can be trusted?

An Example of the Explanations They Provide

If you call these firms or look online for explanations of how they generate their estimates, they may use quite a few words, but seem nonetheless not very transparent. Here, for example, is how ESRI in “2014 Methodology Statement: Esri Data—Retail MarketPlace,” a 2014 white paper,” described how they estimated retail sales:

“Estimates of retail sales begin with the benchmark, the 2002 and 2007 CRT (Census of Retail Trade) from the US Census Bureau. Trends from the economic censuses are used to update the base along with Esri’s extensive portfolio of demographic and business databases. These include commercial and government sources such as the Dun & Bradstreet business database and economic statistics from the Bureau of Labor Statistics. Supply estimates also incorporate data from the Census Bureau’s Non-employer Statistics (NES) division. Smaller establishments without payrolls, such as self-employed individuals and unincorporated businesses, account for a small portion of overall sales. However, these businesses represent more than half of all retailers in the United States. Their inclusion completes the report of industry sales.

Esri’s model captures economic change by first differentiating employer and non-employer sales growth. Multivariate statistical techniques are used to model data that is subject to disclosure issues in CRT and NES. Sales estimates have been recalibrated against the Monthly Retail Trade (MRT) survey and independent sources to address the disparities that can exist between independent input data sources. This methodological improvement yields a more precise estimate of the retail sales attributable only to domestic households.

Esri licenses Dun & Bradstreet’s business database, which also provides sales for the retail market. Although Esri utilizes this database in the derivation of small-area estimates, the methods differ. Esri estimates retail sales only to households for implementation within the Retail MarketPlace data. Additionally, Esri relies heavily on data from both the CRT and MRT to improve estimation. Furthermore, the Dun & Bradstreet business data file is reviewed and cleaned to improve data content. All estimates of market supply are in nominal terms and are derived from receipts (net of sales taxes, refunds, and returns) of businesses that are primarily engaged in the retailing of merchandise. Excise taxes paid by the retailer or the remuneration of services are also included, for example, installation and delivery charges that are incidental to the transaction.”

This explanation shows that Esri s methodology is a rather complicated, multi-step process, which involves quite a few data sources and data manipulations. Part of those complications is the result if its recognition that the estimates based on one data source or another are in need of improvement.

Dun & Bradstreet (D&B) and MRT data are needed because:

  • The business census data are aggregated to such geographic units as states and counties that are not congruent with the non-legally defined boundaries of many study areas. Addressed based D&B data can be aggregated to the needed geographic boundaries.
  • The business census is done only every seven years and the actual data are only released two to three years after it is taken. Depending when they are used by outside analysts, the business census data can be three to six years old. The census data cannot be depended on to detail what businesses are there and what they are like. The D&B data are supposedly more recent and able to establish who is there now. ESRI’s methodology recognizes the importance of knowing how many firms by size there currently are in each retail NAICS code in a leakage analysis study area. The NES data are used to address the presence of small firms.

On a key question, whether and how Esri uses D&B’s data on firm sales, Esri’s white paper is unclear.

My take aways from Esri’s explanation of how estimates of retail sales are made are that it

  • Reveals the sources of some of the data they use, e.g., the Census Bureau, BLS, Dun & Bradstreet. However, they do not detail the data obtained for each retail firm (e.g., name, NAICS code, sales, number of employees) or, very importantly, how these data may have been statistically manipulated to produce their estimates. This is understandable to the degree that their methodology provides a competitive advantage over their rivals and therefore needs to be kept confidential. Nevertheless, it makes assessing their estimates more difficult.
  • Additionally, and perhaps even more importantly, Esri provides no indication that they have validated their estimates, i.e., shown that their estimates are accurately measuring what they are supposed to be measuring, or that they even made an attempt to do so. How, then, can we know that their methodology is sound? How can we have confidence in them?
  • Is a complicated methodology with many steps. I was taught that every time basic data are manipulated or added to there is a potential for a new error factor to be brought in. Esri has added steps to its methodology to overcome some known errors. Whether they are successful or simply add new errors is unknown.

I have not found any better explanation from Nielsen or its corporate predecessor Claritas about how they estimate retail sales.

A Closer Look at Basic Supply Side Information: Retailers –Their Number, NAICS Codes, Sizes and Sales

Accurate basic firm level data are absolutely essential to an accurate and useful to a traditional leakage analysis. Having directed numerous surveys of business firms, especially retailers and those prone to renting office spaces, and conducting countless personal interviews with business owners and managers in the USA and France, I am well aware of the difficulties involved in getting reliable data from business firms. This is especially true for the sales and finances of small and medium-sized operators.

As the following quote from Mike Stumpf indicates, I’m not the only one that questions the verisimilitude of the firm-level data that is often the foundation of a leakage analysis. From a recent email, here is Mike’s description of how ESRI looked at one area’s business mix:

“ESRI looked at the area’s business mix, then talked about the very large number of establishments in the financial sector. ESRI’s database lists every ATM as a business establishment! A grocery store with a deli, pharmacy, and liquor store can be listed as four different businesses, each with its own estimated sales, but then they do not pick up the restaurant in the Mexican grocery. Their sales estimates for one Mexican bakery were under $100,000, but they actually do more than that in a single month.”

Both Nielsen, ESRI and other leakage analysts obtain basic data about the stores in a study area from other market research firms, such as InfoUSA, Dun & Bradstreet or, its subsidiary, Hoovers, etc. that focus on firm-level data gathering. Nielsen and ESRI combine that info with data from the economic census and other sources to produce their estimates. In a sense they are heaping estimates upon estimates, with each potentially having unknown error factors that may combine through addition or multiplication.

Over the past three decades my company, for our client’s downtowns, has purchased establishment level data from some of the same business market researchers that have supplied firm level data to ESRI and Nielsen. On occasion, we obtained such data from local economic development agencies. Our experience with those data made a deep impression because:

  • There were usually error factors of 20% to 40% in the listings of firms. The errors, as might be expected, were most frequent among the really small firms that have a high probability of failure and turnover, but some of a downtown’s larger retailers were too often also omitted or listed after they had closed. We have seen annual retail churn rates in our clients’ downtowns (they include newcomers as well as closures) that can range between 5% and 30%. Unless these gatherers of firm-level data research businesses annually, which is very expensive, there is a high probability that their collected facts will be out of date. The year-to-year errors can really add up.
  • The Retail NAICS codes often may be wrong. Our discussion with one of the businesses that gathers firm-level data revealed that the downtown firms themselves were surveyed and provided their NAICS code(s). They were aware that errors were frequent. They attributed this to a difficulty in getting knowledgeable executives to respond to their survey. My review of the NAICS codes listed for retailers in the downtowns we bought data for frequently found numerous questionable codes.
  • I have supplied the NAICS code for my firm in the business census and to insurance companies and found out what many of the not large downtown business owners have told me over the years: selecting the right NAICS code isn’t easy, its takes too much time, and consequently, they just put down whatever is easiest to get the task done. Some reported giving the job of responding to the business census and enquires from firms like InfoUSA to their secretary or assistant or salesperson. I suspect that there are even substantial NAICS code errors in the US Business Census returns — especially from respondents who are the types of independent retailers found in our small and medium-sized downtowns and urban ethnic neighborhood commercial centers. DANTH, Inc. has conducted many surveys of businesses over the years, including the largest corporations headquartered in Manhattan, those in the healthcare industry, manufacturers in Nassau County, NY, etc. We quickly found there was a tendency for high-level executives to avoid responding to our survey. They felt it was a waste of their time.
  • Getting accurate firm-level retail sales data is really, really difficult. In addition to the surveys mentioned above, DANTH has also done numerous surveys of downtown merchants. Unsurprisingly, we found that there is strong resistance among most independent downtown merchants to providing such information. Interestingly, they sometimes reported that, off hand, they don’t know that information. The managers of the national chain stores also are loath to reveal their sales statistics. Many downtown managers – probably most – can attest to the difficulty of obtaining such information.
  • One of the business market researchers reported to me a few years ago that they have similar challenges getting information about a firm’s sales, workforce and finances. For the national chains, they use the chain’s average store’s sales. For the independent merchants they ask for the number of employees – which they said small retailers are more willing to provide – and multiply that by the average sales per employee for that NAICS code in the state. D&B is in the credit rating business, so small and medium-sized retailers who are concerned about their credit rating have an incentive to respond to D&B inquiries.

Getting basic information about small and medium sized business is a tough job, fraught with potential errors. Given that this type of information is such a basic building block in the often-complicated process of estimating the retail sales of a study area, it seems wise to treat such estimates with caution and prudence.

DANTH, Inc. has used leakage analyses generated by Claritas Esri and UWEX. In each instance, I created small tests of the data. Sometimes running a leakage analysis on a small of part of the study area enabled a comparison of the number of firms with my visual counts. If a NAICS category was identified as being very strong, I tried to verify that by visual inspection and interviews with local business operators. In a project in Sherwood, WI, a fast growing community, I thought that both the demographic data and the leakage analysis of one provider were badly out of date. Instead, I used the UWEX Gap Calculator and data from the Census Bureau’s American Community Survey. On another project, one of my little tests was to see if the leakage analysis had captured the sales of a food operation inside of a convention center. Finally, there is the “making sense test.” Sometimes I’ve looked at one of these leakage analysis reports and felt it just does not make sense. It just may be that the numbers do not jive in my mind with what I saw touring the study area and what I heard from local business people and economic development officials. Reports that fail the making sense test cause me to take a much closer look at the situation.

Sales Tax Data. In a number of states, retail sales tax information sorted by NAICS codes are gathered and published for the state, counties and sometimes the cities. These data are potential analytical gold for those researchers who find those geographic units congruent with their study area. Even when they are not, the validity of such data may provide a strong foundation for making needed extrapolations for the non-legally defined study areas.

Most of my project experience has been in states that do not provide such information. On the two occasions when I did projects in such states, I encountered some problems that impeded my use of the sales tax data. In one state, the sales tax is applied to only a portion of the merchandise in various NAICS categories and we could not determine what those percentages were. In the other state, the data for the counties were only provided at the two-digit NAICS code level, e.g., that of the entire Retail Trade category.

However, I have been told by some economic development consultants in California whom I respect that the state’s sales tax by NAICS code data enables them to produce more reliable leakage analyses.

Avoiding the Need for Retail Sales Estimates

In the 1990s and early 2000s, instead of the usual leakage analysis, DANTH, Inc. used an approach based on the consumers’ satisfaction with the retail services in their market area. We thereby solved the unreliable retail sales estimates issue by avoiding the subject. Our analysis focused solely on the consumer. Back then, response rates to our telephone surveys were far more acceptable than today’s 30% or so and we asked respondents if they were satisfied with the stores within a 15 minute drive in each of the higher level retail SIC or NAICS codes. Those that were dissatisfied we deemed as probable out-shoppers and open to being attracted by new retailers within the trade area. We also knew from the survey about these dissatisfied shoppers’ incomes, education levels, age cohorts, etc.

Using consumer expenditures potentials generated by ScanUS, Esri or Claritas we also provided estimates of the consumer expenditures for some of the products associated with each retail SIC/NAICS code. The expenditures of the “underserved” shoppers were, in a sense, up for grabs and prone to being spent out of the trade area. Back then we were not able to match completely BLS product categories to NAICS codes as can now be done. Our retail growth strategies were based on capturing these up for grabs shoppers and a sample of their retail expenditures.

This approach is sort of like a leakage analysis, though not the same. However, it enables an analyst to answer the same important retail growth questions, with far fewer questions about the validity and reliability of the data used.

DANTH has not used this approach recently because the cost of a really good telephone survey has become unaffordable and their findings less reliable, while the use of lower cost non-panel online surveys have serious sample issues.

Of course, others have used local surveys to ask respondents about whether they mostly buy various products in town, out-of-town or online. That, too, tells you about the leakage of shoppers and avoids the need for data about retail sales. Here, again, being able to do an affordable survey with a representative sample is a critical question.

My guess is that within the next 10 years online survey techniques will solve the sampling issue and affordable surveys will be possible. Then researchers will be able to answer the questions that leakage analyses are intended to address without needing to know about local retail sales or complicated methodologies for estimating them.

The Demand Side – Consumer Expenditures by NAICS Category

BLS Based Approaches. As I have written elsewhere, the best way of obtaining reliable, acceptably accurate data on how consumers spend their money is to survey them. However, such surveys require substantially more methodological skills and resources than most other kinds of surveys. For many consumer items, the relevant information must be obtained close to the points in time when the expenditures are made, lest memories of them quickly fade. For example, the Bureau of Labor Statistics (BLS) probably sets the gold standard for this type of research and it has half of its 14,000 survey respondents keep diaries of their expenditures and interviews the other half 5 times over 15 months. In contrast, I’ve seen many inept downtown and Main Street surveys that ask about shopper expenditures that are oblivious of the challenges involved, have no where near the rigor of the BLS surveys, have relatively few respondents and their results aren’t worth the paper they are printed on.

While the BLS expenditure data are solid and a good starting point, using them to inform estimates of consumer expenditures in a leakage analysis study area presents a number of barriers that must be overcome:

  1. The BLS uses categories to order its data that are product oriented, about the things people buy not the kinds of stores consumers buy in. The demand side retail sales data are ordered by the NAICS codes that are about the characteristics of aggregations of retail stores. To be useful in a leakage analysis, the BLS data have to be “crosswalked” into the NAICS categories. Such data crosswalks are enabled by a list of the products that are typically sold in the different retail NAICS codes that was produced by the Census Bureau. Using the list can take a lot of effort. Computerizing the list makes things easier, but also takes resources. Both Nielsen and Esri do these data coding crosswalks. This data crosswalking is a possible opportunity for errors to enter the analysis, but I think the probability of that happening are relatively low.
  2. The geographies used by the BLS are far, far larger than the size of any retail leakage study area. The 14,000 respondent BLS sample is still too small to provide enough respondents to be directly used even at the state level of analysis; the sample would average only about 280 respondents per state. Consequently, some methodology is needed to make estimates of consumer spending within retail leakage study areas that is based firmly on the BLS data. Both Nielsen and Esri have developed methodologies to make such estimates based on the BLS data. My research experience says these research tasks have significant opportunities for errors to enter into the analysis.
  3. Different types of people have different spending levels and patterns and different retail leakage study areas will vary in the kinds of people that live in them, e, g., by income, education, race, lifestyle group. The BLS data based estimation process needs to be able to adjust expenditure estimates by taking these population differences into consideration. Both Nielsen and Esri use their demographic and lifestyle segmentation databases, Prism and Tapestry, to make these adjustments. My research experience again says these research tasks have significant opportunities for errors to enter into the analysis.

The data presented in the table earlier in this article about City XYZ shows big differences in Esri’s and Nielsen’s estimates of consumer expenditures. This suggests that while they both are trying to address the problems just enumerated above, their methodologies vary significantly. Again we are posed with the problem of whose estimates, if any, should we trust?

The BLS data covers household expenditures. Used in a leakage analysis they inform only about the expenditures of study area residents. They do not appear to inform about the expenditures of day and overnight tourists and non-residents who work in the area. Yet, accurate estimates of retail sales should include the sales dollars from those types of customers. For many downtowns, the non-resident customer base can be extremely important. There consequently seems to be an imbalance between the customers included in the analysis on the demand and supply sides. Bill Ryan has recently upgraded UWEX’s Gap Calculator to incorporate data on the expenditures of tourists and people working downtown. Others should follow suit.

ecommerce-retail-2013-and-projections-xls

Also, of increasing importance, the BLS data does not tell us whether consumer expenditures are being made in brick and mortar shops or online. The total of online retail sales now only accounts for about 6.5% of all retail sales nationally. However, as can be seen in the above table,

  • By 2017 it is anticipated, if trends continue, that e-commerce will account for 50%+ of the sales for music, videos, books, magazines, computer hardware and software, toys and games, electronics and appliances,
  • By 2017 e-commerce is projected to account for 25%+ of the national sales of furniture, sporting goods, office equipment and supplies, clothing, accessories and footwear.

 The vast majority of online purchases will be going to retailers based geographically outside of the retail leakage study area, perhaps across the country or even on another continent, yet they are very close because they can be reached from a living room chair almost instantaneously via a smartphone, tablet or computer. The online purchases are, of course, leaked purchases. The important question then becomes do local merchants have a real chance to recapture these dollars? The strong trend now is for online sales to grow at a rapid pace. Younger Americans, especially the Millennials feel very much at ease with making online purchases and they will be growing in number. Older folks are getting more accustomed to buying online, but not like the younger age cohorts, and many of them will soon fade away. Consequently, a strong argument can be made that, for the foreseeable future, it will be much harder for local brick and mortar merchants to win back dollars spent on the internet than for dollars spent in other brick and mortar shops located beyond their trade area’s boundaries.

If this is the case, then knowing about how many consumer dollars in a study area are going online is, in effect, identifying “dead dollars” that now are well beyond the reach of local retailers who really have little hope of recapturing them – unless they, too, are able to become strong competitors on the internet. Unfortunately, this is the type of information that many downtown leaders need to know, but don’t want to hear.

None BLS Approaches. Leaders of EDOs in many small and medium sized communities may want a leakage analyses done for their downtown, but the don’t have a lot of money to pay for a consultant. Some consultants and economic development organizations have constructed leakage calculators that can be used by EDO leaders or their staffs either for free or for little cost. These builders of these calculators do not have the funds that take the BLS data and crosswalk then into NAICS codes, or to generate expenditure estimates at the study area level, or to adjust such estimates through the use of a lifestyle database. Instead, they take a simpler and less expensive approach:

  • They take the retail sales by NAICS code at the state level and adjust them for inflation
  • Then they divide those sales numbers by e the population of the state to get per capita sales per NAICS code at the state level.
  • Then they treat these per capita sales estimates as measures of per capita spending. They identify the population of the study area in question and then multiply the NAICS per capita sales estimates by that population number to estimate total consumer expenditures by NAICS codes for the study area.
  • They then identify the median household income in the trade area and adjust the consumer expenditure estimates accordingly.

In a lot of ways this is a simpler and easier way of estimating consumer expenditures in a study area than how Nielsen and Esrsi do it. I’ve used the UWEX Gap Calculator and can attest that its easy to use. It’s intended users are small and medium-sized downtowns, where local leaders can input their own data about the retailers in their trade areas.

The use of sales data at the state level to estimate consumer expenditures at a study area level may raise a few eyebrows. It did mine. Since the state retail sales data includes tourist sales, those dollars are also finding their way into estimates of resident retail expenditures and inflates them inversely to the actual flow of tourists through the study area. The theoretical explanation for it escapes my understanding. But, can Nielsen and Esri prove that their estimates are any better?

Given that there is no evidence that the gap calculators do any worse than the leakage reports the big private market data firms put out, who’s to say they are not worth considering. The price is right. Moreover, they are methodologically rather transparent: it’s easy to understand how all the estimates are being made.

Some Final Comments.

To properly do our research we need to live in the real world and in that real world we most relay on doing secondary or tertiary levels of analysis on primary data collected by someone else. Professionally, we should have been trained to understand that we must be very cautious about how we do our secondary analyses and transparent about our methodology when we present our findings to others. We need to be even more cautious about how we accept the secondary analyses done by others – especially when their methodology is not transparent and their findings have a significant number of apparent errors and conflict with the findings of other analysts.

That is why I argue that the estimates of retail sales and consumer expenditures generated by most leakage analyses should be treated with caution and used with prudence.

Retail Leakage/Gap Analyses Should Be Treated With Great Caution by Analysts and End Users: 1. Analytical Issues

By

N. David Milder

Introduction

A retail leakage (a.k.a. gap) analysis essentially compares consumer expenditures sorted by NAICS codes in a trade area (demand) with the corresponding retail sales of trade area stores (supply). Sometimes it may be confined to just a few code categories or even just one.. A leakage exists when demand exceeds supply. The demand that is not met locally is seen as leaking out to shops beyond the trade area’s borders. These leakages are usually interpreted as identifying local untapped retail demand that, if recaptured, can not only support growth, but do so without taking market share away from existing retailers. Understandably, such leakage analysis findings have become the foundation stones of many downtown retail revitalization plans and strategies. Unfortunately, too many of these plans and strategies are on very shaky ground because the leakage analyses on which they are based utilized bad or incomplete data and/or the analytical framework through which they were given meaning and significance suffered from fatal conceptual errors. This article will focus on those conceptual errors.

The Appeal

This analytical tool appears to have a heap of usefulness since it seems able to answer two important questions: how much can a downtown’s retail grow and in which sectors. It also appears to have a lot of basic prima facie validity, after all, it does numerically compare retail supply to retail demand. It looks like sound, basic economics. Moreover, it makes retail growth appear safe; the leakage/untapped demand seems to identify retail sectors where growth can occur without hurting existing small merchants. It also can state the growth potential in tangible numerical terms such as retail sales dollars and sometimes, with additional calculations, the number of new stores and the amount of new retail space that would have market support.

Additionally, leakage analyses can be done quickly, easily and cheaply – e.g., an ESRI report costs $50, the calculator on the UWEX website is free to use (1). You can generate a basic leakage/leakage report in under an hour at either source.

An economic analysis tool that can apparently do so much and also be very affordable is very appealing, indeed. What’s not to like? Well, here are some strong cautions.

Problems in the Analytical Framework

These analytical problems are often found in leakage analyses and can sink a retail revitalization plan or strategy.

Retailers That Are Unfazed About Fighting for Market Share. An assumption often attached to a leakage analysis is that retailers will only go into market areas where they do not have to fight for market share. This is demonstrated when the lack of leakages in NAICS categories is interpreted as indicating low growth potential. However, it is a well known fact that many retailers are neither risk averse –- especially those that are the most successful and powerful – nor afraid of fighting for market share. For example, does Walmart really care that small merchants are already capturing most of the retail household expenditures in a market area it wants to enter? Some retailers may not care at all about local competitors, they just want to know how many of their type of customers live in a potential new trade area and how the other retailers in the area (hopefully including some of their frequent co-tenants) are doing. Other retailers may care about having to compete with some specific rivals – information that a leakage analysis itself can not provide. Conversely – and perversely —sometimes it is the presence of the rivals that attracts retailers because they figure that they share a common customer base and that together they will draw more shoppers from a wider geographic area. Years ago, the famous example of this was the proximity of Macy’s and Gimbel’s in New York City. Today, Home Depots and Lowe’s are often found within a few minutes drive of each other. Other examples are successful retail niches and clusters. For these retailers, a leakage analysis might help them define the geographic boundaries of their trade areas, but it is unlikely to have much a determining influence on their locational decisions.

It can be reasonably argued that the retailers many downtown leaders very often want to recruit, the so-called trophy retailers, are not afraid of competing for market share with other chains, if the potential rewards of sales revenues and profits can justify the risks. For these retailers, total consumer incomes and expenditure potentials are a much better indicator of retailer perceived potential rewards than any reports of sales leakages.

Small independent operators may be more concerned about not having to fight for market share, so a good leakage analysis may provide a useful indication about their ability to enter and thrive in a market area. However, given how many of them open their new shops without any detailed knowledge about the retail market area they have entered, there are bound to be some limitations to the value of a leakage analysis that could inform their locational decisions.

The Improbable “Immaculate Retailing” Assumption and the Need to Win Market Share: There is no research showing that retailers entering a market area will only recapture residential expenditures dollars that are now going to retailers located beyond a trade area’s borders, while leaving the local expenditures captured by any similar existing local retailers untouched. This assumption is a bit of fantastical thinking that has not been properly called out. For example, can anyone imagine a new retailer asking shoppers if they otherwise would be patronizing another downtown shop and then refusing to make the sales transaction if the customer said yes?

Expanding on that argument, consider the following scenario:

In Community X, with a downtown filled by small merchants, a leakage analysis shows that there is a $5 million leakage of residential expenditures for apparel. What the leakage analysis does not show is that most of the leakage is being captured by strong and attractive apparel specialty shops and department stores in the powerful 1.5 million SF Shopping Mall Beta located about 2 miles beyond the borders of Community X’s trade area.

The mall’s apparel merchants, with their very large and frequently updated selections will have a great deal of retail gravity and consequent customer drawing power. That means a very substantial portion of their trade area likely overlaps with that of any Community X apparel merchants, even though the mall’s shops are located beyond Community X’s trade area’s borders. Viewed from the perspective of Community X’s trade area, it might be argued that greater proximity could give a new apparel merchant some competitive advantage, but viewed from the perspective of the mall’s far greater strength and far larger trade area, proximity does not offer Community X’s merchants that much potential advantage. Facing that level of external competition, is it likely that a new apparel merchant in Community X could resist knowingly trying to take market share from other nearby apparel merchants?

The bottom lines here are that:

  • Recapturing leaked shopping dollars often means that small downtown merchants must compete with very powerful retailers who are located beyond THEIR trade area’s borders while their supposed competitive advantages are related to their proximity to the targeted shoppers
  • Unstated and unresearched, of course, is the fact that if these small merchants do not provide a sufficient selection of merchandise and at the right price/quality value ratios, they won’t be able to even win back the expenditures of shoppers who live next door or in apartments over their shops
  • There is no free lunch no matter what many leakage analysts may assume. Any merchant – be they large or small – must compete and win market share. There is no way around that fact! The merchants they are competing with may be located in and/or beyond their trade area
  • Of course, competition may be less fierce in some market areas than others. However, a strong argument can be made that the level of competitiveness is determined more by the capabilities of the retailers in and near the market area, than by how many sales dollars are being leaked out of the market area
  • Retail revitalization plans and strategies need to specify a lot more about the needed characteristics of new retailers that could compete successfully. Just identifying and quntifying the presence of a leakage is not enough.

The Existence of a Retail Leakage Does Not Mean All or Even Most of It Can Be Recaptured. A review of numerous reports containing downtown leakage analyses revealed that far too many of them assumed that most of the identified leakages can be recaptured. This is a basic and fatal mistake for any plan or strategy that builds upon leakage analysis findings.

Besides indicating that retail demand exceeds supply within a trade area for a specified type of goods or service, finding a leakage is usually interpreted by analysts as an indication of local unmet demand that is:

  • Legitimate to “recapture” because it is somehow owned by the trade area in which its consumers reside and recapturing these retail sales dollars will not hurt local merchants
  • Easier to reclaim, because these dollars are now being captured by more distant, less conveniently located merchants whose shops are outside the trade area than the sales revenues of local merchants.

However, the advantages of proximity do not mean that the leakage dollars are just lying there to be easily scooped up by some observant businessperson. Also, because these dollars are being captured by shops beyond the downtown’s trade area does not mean that those more distant merchants lack strong competitive advantages of their own. For example, they may be very competent operations offering larger merchandise selections, better merchandise quality, better overall values, better customer service, a more attractive shopping environment, etc. These assets may more than outweigh the proximity advantages of downtown merchants when competing for local residential retail expenditures.

Furthermore, the competency and ability of new small downtown merchants to compete are certainly not assured, as indicated by their high failure rates nationally. Whether the new merchants like it or not or whether the leakage analysts like it or not, new downtown merchants will have to take away the sales revenues from someone else, no matter the size of any leakage. How difficult it will be depends on their abilities, the strength of their proximity and convenience advantages and the strengths and weaknesses of their competitors both inside and outside of their trade area.

Consequently, it is an enormous error to assume that any identified retail sales leakage can be mostly recaptured.

The Critically Important Assessment of How Much of a Retail Leakage Can Be Recaptured Requires Well Reasoned Judgments, Not the Magical Use of a Complex Equation or Simple Arithmetic. Assessing how much of a leakage it is reasonable to expect downtown merchants can recapture is the most important part of any leakage/leakage analysis. It can only be properly done if the leakage findings are viewed from a larger analytical perspective that looks at such things as:

  • A SWOT analysis of the downtown as a retail location, with special attention paid to the magnitude and nature of the strengths of the downtown’s retail competition that may be located beyond the boundaries of the downtown’s trade area.
  • An analysis of the types of retailers who can utilize the downtown’s locational assets to successfully compete with rival retail centers.
  • The capabilities of local merchants to compete.

There is no formula to apply or simple arithmetic manipulations of the leakage data that can inform this assessment. Rather it is a judgment call. Analysts, alone or as a team, may add some quantification to this process by using their Bayesian probability estimates to assign capture rates to the leakage estimates. This assignment hopefully is based on their analysis of the strengths and weakness of the competition, the downtown as a retail location and the abilities of the retailers most likely to be recruited.

Retail Surpluses Are Often a Much Better Indicator of Viable Potential Growth Opportunities Than Leakages/Leakages. A leakage analysis can not only identify leakages, but also the surpluses that exist when a downtown’s retailers are strong and importing sales dollars from customers living beyond the boundaries of the studied trade area. In far too many studies, however, the discovered surpluses are treated as realized growth opportunities that signal no ability to generate any additional growth. They are then largely ignored. The analysts, quite obliviously, only see leakages as indicators of potential growth.

A niche analysis has its own way of viewing leakage/leakage data. It first looks for strong exiting niches that can be grown and leveraged. A NAICS category that has a surplus is probably such a raptor niche or part of one. Its surplus shows it is strong and successful. It’s real trade area is probably much larger than the one that was used to reveal its “surplus sales.” In many instances, such a raptor niche is bringing in strong customer traffic flows that, through effective cross marketing, can facilitate substantial growth among other downtown niches.

A niche analyst looks at leakages in a more ambivalent manner. On one hand, they represent potentials for future growth, but on the other, they also demonstrate weaknesses. Total leakages best demonstrate this point. The fact that there is no retailer in a particular retail sector certainly suggests an opportunity framed by obvious unmet local demand and the lack of obvious local competition. A niche analysis would call the situation a potential niche. However, a good analyst would also ask why no retailer has successfully entered this market space? Very often, there are strong factors that have impeded firms from doing so, such as:

  • The lack of appropriate spaces, a problem that also may be very expensive to remedy
  • Rents that are too high for that particular kind of retail activity
  • The lack of a local workforce having required special skills
  • While the local demand my be unmet, it is still too small to support a successful shop in that retail category
  • The competition sitting outside of the trade area is very, very strong and has a long reach.

With the understanding that it is far easier to organize, grow and leverage an existing strength than to turn a growth potential into a reality, a niche analyst will prefer finding surpluses (strong existing niches) to leakages (potential niches).

Part 2: SOME THOUGHTS ABOUT STUDIES OF THE ECONOMIC IMPACTS OF DOWNTOWN ENTERTAINMENT VENUES

An Assessment, From a Downtown Perspective, of Economic Impact Studies Done on Downtown Arts Venues That Use I-O Economic Models (Multipliers) cont’d.   

The Critical Geographic Problem. Downtowns, even in NYC, Chicago or L.A., are geographically far smaller than counties. Consequently, there is an inherent mismatch between the geographic area the I-O model impact studies utilize and the one downtowners are most concerned about. Furthermore, the nature of the available data needed to construct these models precludes their being built for impact areas smaller than a county. While there are data available for zip code areas — a geographic unit sometimes useful for looking at large downtowns — experts in their use strongly recommend that analyzing a single zip code absolutely should be avoided. Instead, they advise that the zip code data should mainly be used to look at custom defined geographic regions that are not congruent with one or more counties, though sometimes they also can be used to cover part of a county (or counties) if enough zip codes are to be analyzed (7). C3D, for example, has done some studies on arts organizations that use a multiple zip code approach to define their impact areas (8).

According to Ben Davidson, Americans for the Arts’ (AftA) senior director of research services: “Our I-O models are generally constructed at the county level (obviously), and then aggregated for larger regions. But our proprietary model also allows us to customize it to specific local economic characteristics such as a city-based lodging tax“ (9). Each model is the basis of an Excel spreadsheet “calculator” that can estimate the impacts of a specific arts venue or of a community’s entire arts industry on the number of full time jobs, household incomes, local and state tax revenues.

One probably unintended and undesirable consequence of using county-centric I-O models is that the related off-site expenditures of county residents are often basically discarded and the analytical spotlight is focused solely on daytime and overnight tourists. The explanation given for this exclusion in a study done for the Los Angeles County Museum of Art (LACMA), which is similar to what can be found in many other large arts venue impact study reports, is that:

“Ancillary spending of local visitors (i.e., residents of Los Angeles County) is excluded, since these visitors would have spent these same monies elsewhere in the region, making their expenditures related to LACMA a displacement of local spending and not new spending attributable to the Museum.” (10).

For downtowners, a significant percentage of their counties’ residents will be in their trade areas and very important customers. They absolutely cannot be ignored. Another fact that cannot be ignored is that making a downtown again successful means it must recapture the expenditure dollars of its trade area residents. PC puffery may attempt to hide that fact, but its veracity will remain unrefuted. Information about an arts venue’s ability to draw trade area residents downtown and their demographic characteristics, lifestyles and spending patterns (how much and for what) would be very valuable pieces of impact information for downtown EDOs and merchants. There are surveys of arts audiences that provide such information. For example, the audience surveys done by AftA, which are done on site and only ask a limited number of questions, has provided such information about many arts venues and, in many ways are a model of how they should be done.

The heavy emphasis the I-O impact studies place on tourists also can be harmful. It can lead to downtown businesses over targeting tourists in their marketing and merchandise selection to the detriment of local shoppers, with seriously negative consequences in terms of sales and customer relations. It can also help generate bad town-tourist vibes that, in turn, can have undesirable political consequences. Over the past decade, DANTH has visited a number of small and medium-sized communities with penny-wise pound-foolish growth strategies: local merchants and politicians mistakenly placed far more attention and resources on attracting more tourists than on improving their abilities to serve local residents. Of course, merchants that fail to well serve their resident customers are not likely to succeed with tourists.

Arts/culture tourism certainly can be a valuable revitalization asset, but not every town can be an arts tourist mecca. As the growing success of downtown Valparaiso’s entertainment/hospitality niche is demonstrating, a strategy targeting that market segment is probably best used when local residents are also being well served by downtown merchants. Getting a good handle on the proportion of downtown retail, hospitality and entertainment sales that arts tourists are most likely to provide can help determine the level of attention and resources it deserves.

Audience Expenditures: It’s Critical to Get Good Data for This Critical Variable. Besides arts venue expenditures, the other variable that arts venue I-O model impact studies start from is audience expenditures. It also is a variable that, in and of itself, is highly likely to be of considerable interest and value to downtowners — even without the benefit of the information an I-O model can provide about how it is respent. Moreover, in many, perhaps most cases, downtowners will benefit more from audience direct expenditures than from the arts venue’s direct expenditures. Both downtowners and I-O models need or want good data on audience expenditures. The I-O model uses estimates of audience expenditures provided by other sources as an input. For downtowners, audience expenditures represent a very important impact. Downtowners do not need, nor can they use, an I-O model to get reliable and accurate information about audience expenditures.

Nonetheless, it is often a very troublesome one to research. The best way of obtaining reliable, acceptably accurate data on how consumers spend their money is to survey them. However, such surveys require substantially more methodological skills and resources than most other kinds of surveys. For many consumer items, the relevant information must be obtained close to the points in time when the expenditures are made, lest memories of them quickly fade. For example, the Bureau of Labor Statistics (BLS) probably sets the gold standard for this type of research and it has half of its 14,000 survey respondents keep diaries of their expenditures and interviews the other half 5 times over 15 months.

In contrast, too many of the arts impact studies do a secondary analysis of surveys conducted by an organization other than the one doing the impact study. These surveys are seldom done to BLS’s methodological standards and usually have far fewer respondents. Their ability to establish the causal connection between respondents expenditures and their arts venue attendance is usually weak or non-existent. Surveys done in the same community can produce very dissimilar expenditure estimates, leaving their wiser clients to be uncertain about their accuracy and reliability.

Forced to used surveys designed by others for other research objectives, the impact analysts often must make numerous assumptions or stipulations if they are to be able to use the “other research house” surveys for their own arts venue related research purposes (11). For example, the original survey may have been of the expenditures of all tourists visiting the community. The secondary analysts must figure out how to deal with an impact attribution problem: how much of this type of spending can be attributed to the tourists visiting the arts venue whose impacts are being studied, but who have not been surveyed? Of course, there will be other unanswerable issues such as: are the venue’s tourist visitors sufficiently similar to those tourists who do not visit the venue that the secondary use of the data is warranted?

Such impact research thereby becomes more and more of a modeling exercise, with each assumption or stipulation bringing in another unknown error factor and their interaction being potentially exponential rather than additive. For example, in the LACMA study:

“(V)isitors who have traveled from other parts of California, as well as from other states …are assumed to spend at least one additional night in Los Angeles County in order to visit LACMA…..International visitors to Los Angeles …are also assumed to have spent one additional day in the region in order to visit LACMA” (12).

The average expenditures for one day for these two types of tourists, as determined by the “outside” general survey of tourists, were then applied to estimate the economic impacts of the comparable tourists who visit LACMA.

Of course, most researchers and decision-makers live in a world of imperfect data and limited financial resources for obtaining the information they would like to use. Doing the necessary survey work may be beyond their allotted time and financial resources. Very often, they then find that making assumptions enables a kind of modeling exercise that, though admittedly imperfect and capable of only yielding ballpark type findings, still may promise sufficient enlightenment to be worth doing and for its findings to be seriously, if cautiously, considered. Such exercises, however, should come with some standards and responsibilities. For example:

  •  Are the assumptions really reasonable? Re the LACMA study’s assumptions: Are tourists really likely to spend a full day or most of it at LACMA? Could they not also walk to the La Brea Tar Pits next door, or the other museums nearby on the “Miracle Mile or shop at The Grove just a 15 minute walk away– or get in their rented cars to go look at the Hollywood sign or the beach scene in Venice on that same day? Are they really spending a day in town just because of their visit to LACMA – so the motive not the behavior is the justification for the assumption? Or are they going to LACMA to fill part of a day they already planned on spending in LA and they then plan on also eating dinner, say at Spago, because they are not only are art lovers, but also restaurant tourists, etc.? In a world of multi-tasking, is uni-motivation for a day’s schedule really reasonable? Why then should a full day’s spending be attributed to the LACMA visit if its visitors – or at least a good number of them –are likely spending only a fraction of the day there and going to other destinations they might highly value in the remaining hours? Should portions of their daily expenditures be allocated to these other venues? If so, then by what formula? Will the assumptions produce answers that are sufficiently accurate to be usefully informative?
  • Are the consumers of the research being told about its data and methodological limitations and overtly adequately cautioned about its conditional value and utility?

Expenditure estimates based on iffy assumptions and that arrive without adequate and overt cautions about their use should be treated as probable horse puckey.

The LACMA study also provides a good example of just how much estimates of visitor expenditures can vary in one community, in this instance Los Angeles. Its analysis uses the following data, based on research published by TNS TravelAmerica in 2010, about visitor off-site spending per day: $53 those from Southern CA; $75 those from other places in CA; $75 those from other places in the US and $116 international visitors (12). However, the authors then note that:

“These estimates are conservative. In comparison, the estimates used by the Los Angeles Convention Center and Visitors Bureau for international visitors are at least four times as high, and those for domestic non-California visitors are five times that shown in the exhibit” (13).

The variation in these survey findings speaks more to the variation in their researchers’ skills and methodologies than to visitor expenditure patterns.

Arts impact table 6

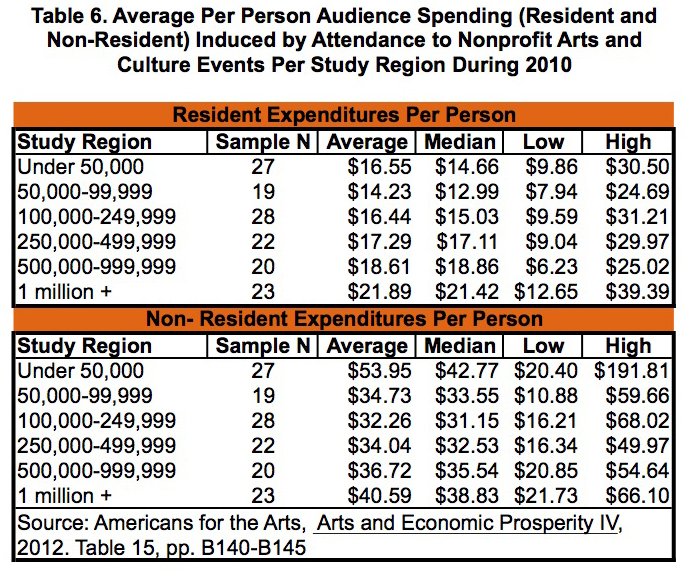
Realizing that its I-O models would be far more accurate and useful with accurate and reliable estimates of audience expenditures, AftA has made an enormous and impressive effort to get to surveys of arts audiences completed in each of the study areas for which it has generated an I-O model. The arts induced daily expenditures reported by AftA for the nation and in its 139 study regions are considerably lower than those cited in the LACMA study, though they still show a good deal of variation. Nationally, nonprofit arts attendees averaged arts induced daily expenditures of $24.60 per person (admission costs excluded) in 2012, with local audience members spending $17.42 and non-locals spending $39.96 (14). As can be seen in Table 6, the average resident daily expenditure across the six study region groups ranged from $16.55 to $21.89, with the highest community average within each group ranging from $24.69 to $39.39. Much the same is the case for non-residents, though the expenditures are, as to be expected, about twice as high. (It should be remembered that the non-arts related downtown expenditures of local residents may well easily erase this discrepancy.) The average individual expenditure ranged among the study region groups from $32.26 to $53.95, with the highest community average within each group ranging from $49.97 to a Colorado ski resort town’s $191.81.

AftA’s survey data across 139 communities and the data cited by the LACMA report indicate that there is so much potential variation in visitor daily expenditure estimates that data not gathered specifically for and in the subject arts venue is likely to be too error prone to warrant any useful and actionable conclusions. Secondary analysis of someone else’s survey of guest expenditures certainly should not be the preferred way to go.

Arts impact table 7

For Downtowners, Audience Surveys Provide Much Richer Information About an Arts Venue Impacts Than I-O Models. Downtowners in the communities that did AftA directed surveys and have arts venues in their districts are likely to find the information collected and the way it is presented to be very useful, indeed. In these instances, the data describe the total arts induced spending that arts visitors bring along with them into the larger community (e.g., the large city, county or region) when they visit downtown arts venues, but not what they spend downtown. In other words, these data detail the sizes and types of spending pies (e.g., meals, clothing, gifts, ground transportation, etc.) downtown merchants can go after (see Table 7). They do not address how big a slice downtown merchants have won of each pie, though the survey has established that the respondents have visited the downtown, and the merchants’ geographic proximity should give them some competitive edge. This is similar to the information benefits merchants in downtown North Adams can get from the I-O model C3D used because AftA survey data for comparably sized communities were entered into that model.

Arts impact table 8

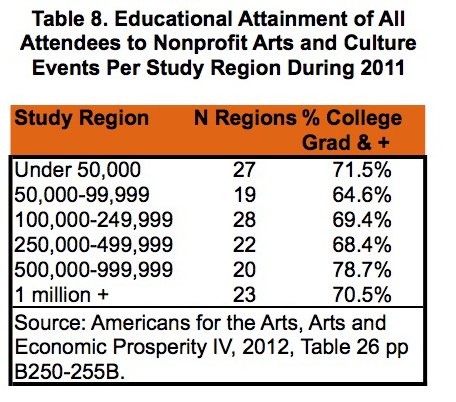
Importantly, the survey data detail a number of other interesting audience characteristics, e.g., the visitors’ household incomes, education levels (see Table 8) and their reasons for visiting the community. For the vast majority of downtown business people and EDOs, these surveys provide much more useful and simple impact-related information (the characteristics and spending patterns of people brought downtown are the impacts, the arts venue is the “impacter”) than any I-O model can. Undeniably, the I-O models cannot function properly without them, since data about audience spending are a critical initial impacting force variable.

Looked at another level, the AftA data on the 139 study regions constitutes a unique database in which the audiences of many more than 139 arts venues (study areas can contain more than one venue) have been surveyed using the same questionnaire and in similar settings. It can facilitate the drawing of general conclusions about the impacts of arts venues. For example, Table 7 indicates that arts venue induced spending is most likely to go for “need” type purchases, such as food and drink away from home and lodging, while apparel and accessory shops might not win as many sales dollars or benefit so much from the arts venue’s downtown presence. Table 8 shows just how strongly arts venues attract well-educated visitors. True, these conclusions were long generally held within the economic development community, but never before has such strong systematic evidence been gathered in their support.

Downtowners and their EDOs also can learn a lot from AftA’s survey techniques:

  •  Survey people on-site at the venue being studied
  • Don’t ask too many questions (but make sure that the respondents zip code is one of them)
  • Have a lot of respondents
  • Do it over enough calendar time to account for variation in events and weather
  • Make it easy for people to respond by asking about recent situations and actions, about things that are easy to know or remember, e.g., about purchases that were made recently.

These are also characteristics that should be found in the surveys downtown EDOs do of people employed in their districts or attending a college there.

A Closer Look at the Audience Expenditures Impact Attribution Problem. Impact attribution is a problem that plagues many entertainment niche element impact analyses, not just those in the arts. It derives from the essential tasks of logically establishing and/or measuring the causal linkage between an entertainment venue and some effect, sometimes when compared to other potential impacting factors or agents. For example, in earlier articles in this series, questions arose about:

  • How much of the improvements on Division Street Plaza (in Somerville, NJ), could be attributed to its conversion into a pedestrian mall and how much was the result of the general revitalization of its downtown?
  • How much of the revitalization of Manhattan’s Upper West Side, especially the Lincoln Square area, was due to the creation and growth of Lincoln Center and how much was due to the revitalization of Central Park and/or the area’s proximity to the Midtown CBD and strong transportation assets?

A similar problem also frequently arises regarding the spending of arts venue visitors, a critical variable for I-O impact analyses: how much of their local spending can be attributed to their visit to the venue? This was, for example, the challenge that prompted the LACMA study to make various assumptions about non-resident museum visitor spending. Making assumptions is one approach to establishing the causal linkage.  A more effective one is to undertake an audience survey structured so that the respondents essentially report the causal linkages they have made between their arts venue visits and the local expenditures. Unfortunately, the impact attribution problem also can crop up in such surveys.

Americans for the Arts, as an advocacy organization, wants to show that arts venues and local arts industries provide strong economic benefits for their communities. It knows that its survey respondents are arts venue guests and so they just could be asked about their purchases in the community that day. But, their concern about arts impact attribution apparently is so strong that their survey asks the following two questions:

“2. Which of the following best describes your primary reason for being in this community today?

— I am a full-time resident/I live here

— I am a part-time resident (e.g., I own a vacation home)

— I am here specifically to attend this arts/cultural event

— I am here on a vacation/holiday

— I am here to conduct business (e.g., meeting)

— I am here for a combination of business & pleasure

— I am here on personal business (e.g., wedding)

— I am here to visit friends or relatives who live here

— Other (Please specify)”

 “5. List below the estimated amount of money that you and the members of your immediate travel party have spent or plan to spend in this community specifically as a result of your attendance to this arts event. Remember to include money spent before, during, and after the event. If exact figures are not available, use your best estimates.

  1. Admission tickets to this event
  2. Refreshments and/or snacks purchased while at this event
  3. Food, drinks, or meals purchased before or after this event (i.e., at a local restaurant)
  4. Souvenirs, gifts, books, recordings, and/or art
  5. Clothing or accessories specifically for this event
  6. Local transportation (e.g., gas, parking, tolls, rental car, taxi or bus fare—not air fare)
  7. Child-care specifically to attend this event
  8. Overnight accommodations because of this event (e.g.,hotel, motel, bed & breakfast)
  9. Other (Please specify):” (underline added) (15).

Question 2 allows residents and non-residents to be identified, though that can be equally achieved by another question that asks for the respondents residential zip code. More importantly, it allows the non-residents who are visiting specifically to attend an arts/cultural event to be identified. That helps measure the magnetism of the arts venue to attract tourists to the community. In building a downtown as a tourist center, venues that are strong tourist magnets are very important assets.

The question also enables non-residents who are visiting for other purposes to be identified. For these visitors, the arts venue is not a magnet, but more of a potential amenity. The arts venue, for them, makes the downtown “stickier,” i.e., it can pleasantly occupy visitors’ time  and makes them want to stay longer and return. Successful downtowns are sticky, especially those targeting tourists. One well-known axiom about tourism is the “four times one rule, ” i.e., that “people will visit your community if it has activities that interest them, and that keep them busy four times longer than it took to get them there” (16). Entertainment venues are often recommended by tourism experts as good ways to make a downtown stickier.

Notice that the differentiators being looked for here are specific motivations; surveys are essential for capturing information about them. The reported behaviors of traveling to the community and attending the event cannot do the job by then turning into assumption burdened surrogate variables.

Q5 aims at establishing a very clear causal link so AftA can claim their findings show: “The total direct expenditures made by arts and culture audiences in each participating study region as a direct result of their attendance to nonprofit arts and culture events…” (underline added) (17). The question enables the art venue visitors — not the impact analysts — to make the connection between their expenditures and their visits. The arts impact attribution is very clear.

Downtowners, of course, will wish that the AftA surveys had asked about expenditures in the arts venues’ downtowns, something they can fix when they do their own surveys of their arts audiences. For some downtowners, the filter AftA used to establish the impact attribution may be too clear, perhaps finding that the wording in question 5 would exclude purchases that they would want to know about and see as causally related to visits to the arts venue. For instance, what about a desk or antique lamp purchased in the downtown that trip , but shipped to the home of the arts event attendee? Q5 does not ask about home furnishings or antiques. Also, what does  “a direct result of your attendance” mean? Is the wording clear enough that respondents will not be confused or puzzled? Does the article of clothing purchased have to be worn at the event or  simply purchased on the trip to attend the event for it to be counted? However, issues about question wording are, of course, endemic in survey research. Nevertheless, while the AftA surveys are understandably not perfect for downtowners, downtowners can learn much from their methodology and from the findings of all the surveys done in communities of comparable size to their own.

That said, it is still necessary to also keep in mind that surveys asking about how people spend their money are very error prone because of respondents’ memories and their concerns about confidentiality. Items that cost a lot ( e.g., a TV, computer or car) or are repetitive payments (e.g., rent, car payments) are best remembered. Smaller transactions are less well remembered. Survey questions that ask for expenditures in categories, such as the AftA survey asks, essentially require respondents to work, to remember individual transactions and then add them up in their heads. Consequently, the data produced by AftA type surveys are likely to have more erroneous responses, the extent of which cannot be determined. Nevertheless, they still may be the best information we can get about arts audience expenditures and still useful if we treat them as pretty good ballpark estimates, rather than some kind of precise statistical photograph of the real situation. Such estimates very likely will be good enough to meet the needs of decision-makers who are thinking in the ordinal measurement terms of everyday language (e.g. none, some, most, all) that inherently lack rigorously defined boundaries.

The essential question of whether or not such data are good enough really can only be answered by their potential end users and the people to whom they are accountable. For those of us who live in a world filled with imperfect data, this is not an unfamiliar question.

Up Next:  Part 3 of this article will focus on analyzing the economic impacts of downtown parks.


ENDNOTES

7. Telephone conversation with Implan’s technical support.

8. See, for example, its research on the Casita Maria Center for Arts and Education (Bronx, NY) at: http://web.williams.edu/Economics/ArtsEcon/Casita.html

9. Quoted from an email message to the author

10. Christine Cooper, Shannon M. Sedgwick, and Somjita Mitra THE TRANSFORMATION OF LACMA: AN ECONOMIC IMPACT ANALYSIS. Economic And Policy Analysis Group, Los Angeles County Economic Development Corporation. January 2014, pp.17, p.9. (Hereafter referred to as LACMA study,)

11. For a good example, see: Economic Development Research Group, “The Economic Role and Impact of Lincoln Center,” September 2004, pp.49, p.18

12. LACMA study, p. 11-13

13. LACMA study p. 12

14. Americans for the Arts, “Arts Facts…Spending by Arts Audiences.” http://www.americansforthearts.org/by-program/reports-and-data/legislation-policy/naappd/arts-facts-spending-by-arts-audiences-2012

15. Americans for the Arts, “Arts & Economic Prosperity IV: National Statistical Report,” pp. 377, p. C-27

16. Roger A. Brooks, Maury Forman, “Twenty-five Immutable Rules of Successful Tourism,” Kendall/Hunt Publishing Company, 2003, pp. 55, p. 46.

17. Americans for the Arts, “Arts & Economic Prosperity IV: National Statistical Report,” p. B149