Capturing “Up for Grabs Shoppers” is an Important Key to Downtown Retail Success

By N. David Milder

Who Are They?

Many downtown retail growth strategies are doomed because they try to avoid some key facts. One is that, except in the very rarest of rare situations, downtown retailers, be they new or old, large or small, must compete for and win sufficient market share to prosper. Another, and closely related fact,  is that beneath the venerated “leaked” sales to merchants located beyond the downtown’s trade area, and the 45% of GAFO sales now being e-leaked to online merchants, is a group of shoppers who are either weakly bonded or completely unbonded to merchants in either the downtown or its larger trade area. They are “up for grabs shoppers” who are very likely to buy fewer things, or to be won over by strongly magnetic brick and mortar merchants located beyond the trade area, or by online merchants, or—and this is very important – by new retailers opening in the downtown or elsewhere in the trade area.

Some Implications

The existence of such shoppers has important implications:

  • The up for grabs shoppers are always there, though their numbers may vary across retail sectors and over time.
  • For new and expanding downtown retailers, it means that there very often will be between 15% to 60% of the shoppers in their retail sector who are up for grabs and likely to give them a look. That indicates the local competition is weak.  If the new/expanding retailers are capable, they will have a very good chance of winning the dollars and loyalties of these shoppers.
  • For many existing retailers, the up for grabs shoppers can indicate – if they learn about them — that a good percentage of their customer base may be prone to desertion and signal a need for the merchants to improve their operations.
  • For downtown economic strategists and leaders, it means that any successful new retailer brought into town is likely to win customers away from merchants located beyond the trade area, or from online merchants, and/or from brick and mortar merchants currently located in the downtown or elsewhere in the trade area. The existence of substantial numbers of up for grabs shoppers also is a sign that downtown EDOs need to create effective programs to help existing merchants improve, or to be prepared to recruit more capable merchants who can better satisfy consumer needs and wants.
  • Just looking at the shoppers leaking their retail expenditures to beyond the trade area merchants is rather myopic – and a denial of reality. This myopia is understandable given that it seems to allow for the ill-conceived assumption of immaculate retailing that any new or expanding downtown retailer competing for the leaked dollars will not take any sales away from other downtown merchants. The existence of any sizeable number of up-for-grabs shoppers in the relevant retail sector means that is a highly unlikely prospect.

Some Examples


DANTH, Inc. first addressed up-for-grabs shoppers in a number of telephone surveys we did back in the 1990s when we asked respondents  whether various types of retail stores they could visit within  a 20-minute drive from their homes, were excellent, good, fair, or bad. Responses of fair and bad were treated as indicators of weak bonding with the relevant retailers. Their retail expenditures consequently may be considered as up-for- grabs and more prone to being captured by new or expanding retailers, be they brick and mortar 
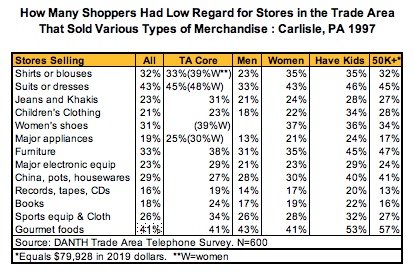
or online.  Above are two tables showing the responses to surveys done of the shopperss in the trade areas of Rutland, VT, and Carlisle, PA.  For example, about 44% of the expenditures for suits or dresses by shoppers in Rutland’s trade area were up-for-grabs, as were about 43% of those expenditures by shoppers in Carlisle’s trade area.

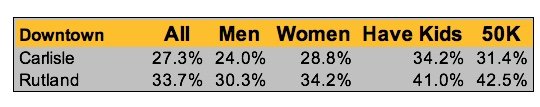
For all the retail store types, the average number of loosely bonded shoppers in Carlisle’s trade area, 27.3%, was somewhat lower than that in Rutland’s trade area, 33.7% — see the table above. This may be because Carlisle is in a denser region, with higher household incomes, and with many more retail choices. Downtown Rutland is located in the Rutland Micropolitan Statistical Area that is composed of Rutland County. The median household income in 2017 in the county was about $52,000, and about 19% of the households had an annual income of $100,000+.  The county has a population of about 61,000, and Rutland City is by far its largest retail center. In contrast, Downtown Carlisle is on the western edge of the  Harrisburg–Carlisle MSA that had a population of about 560,000. Carlisle is located in Cumberland County where the median household income in 2017 was over $82,000, and about 27% of the households had an annual income of $100,000+. Moreover, back in 1997, in the downtown Carlisle trade area there were 12 major malls occupying a total GLA of about 3.5 million SF.

It is also interesting to note that, even with all that retail within an easy drive, on average, 27.3% of the shoppers in Carlisle’s trade area were up-for-grabs. Moreover, that number was even higher for some important markets segments: shoppers with children and those with annual household incomes over $50,000 (about $80,000 in 2019 dollars). The same pattern among market segments was even stronger among Rutland’s shoppers.

Some Types of Up-for-Grabs Shoppers

Up for grab shoppers can be present in many market segments and to varying degrees. For example, the numbers/percentages of loosely bonded shoppers in the upper income 4th and 5th quintiles are of particular interest because they account for a very disproportionate amount of consumer expenditures across all sectors, especially retail. As can be seen in the above table, nationally, shoppers in the highest income quintile (the 5th 20% group) accounted for about 38.9% of all consumer expenditures in 2017, about equal to the combined total of the 3rd and 4th quintiles. The 5th quintiles shares of all expenditures on food away from home, home furnishings, and apparel were at about that level. However, they also accounted for 52% of all entertainment fees and admissions, making them an absolutely critical market segment for most downtown entertainment niches. 

In rural towns and cities, such as Rutland, VT, Scotts Bluff, NE and Laramie, WY, where trade area populations are not large and household incomes are relatively modest, one might expect the more affluent shoppers will be among those most detached from local merchants. These downtowns usually do not have a strongly varied retail environment and local merchants are prone to catering to the more numerous middle income shoppers. Underserved, and possibly ignored, these more affluent consumers tend to shop in distant towns and cities having more robust retail assets, and they are increasingly buying from online retailers. 

Very often, a large proportion of leaked retail expenditures come from the 20% to 30%  of the households with the highest incomes in the trade area. Unless a sufficient bolus of the types of retail they prefer open in the downtown or trade area, it will be very difficult to recapture those leaked dollars. Traditional leakage analyses, by themselves, cannot identify such situations. However, an analysis of the up for grabs shoppers can help  answer the critical question that  leakage analyses raise, but cannot answer: how many of the leaked dollars can be captured by new or improved local merchants?

Lower income shoppers also can be up for grabs. The local retail structure also may not have the stores with the price points and/or merchandise they need. Evidence of this comes from the enormous growth in recent years of dollar store chains and their ability to take significant numbers of low-income shoppers away from huge, well-established retailers such as Walmart, as well as from local small merchants. 

It should be noted that an important element in the discussions of upper and lower income shoppers presented above is the existence of what might be termed a gap between the types of stores these shoppers need and/or want and those that exist in the downtown or trade area. A useful estimate of the monetary values of such gaps can be made by multiplying the number of dissatisfied shoppers by sector in the relevant income groups with estimates of the retail expenditures by sector of households in those income groups. However, such estimates do not carry along with them the assumption that all of the potential gap expenditures are being leaked to beyond the trade area merchants. Shoppers might also spend online, or simply reduce their spending levels.

The discussions of these two income groups also helps spotlight a frequent deficiency in downtown market analyses: the primary focus on statistical means and medians.

Millennials, now our largest generation, seems very prone to being weakly bonded to product brands. One might reasonably hypothesize that also will probably be the case for retailer brands.  For example, in 2017, a study found that “67 % of millennials changed brands in the last year” and called this “a clear lack of brand loyalty among 18-34 year olds.” The two major factors driving disloyalty were product quality (49%) and product availability (44%).  These findings suggest that the number of up for grabs shoppers is likely to grow in importance in coming years as the economic importance of the millennials grows. See: “Millennial Research: Factors Driving US Millennials Brand Disloyalty”, Posted on January 20, 2017 by B. Smith to https://www.customerinsightgroup.com/loyaltyblog/brand-loyalty/millennial-research-factors-us-millennials-brand-disloyalty

Here’s the Rub

In my experience, telephone surveys with about 500 to 600 respondents were the best way to obtain useful and reliable data about the up for grabs shoppers in a downtown’s trade area. However, over the past two decades, it has become harder and harder to conduct such surveys. Response rates have dropped significantly as the public became more resistant to answering surveys and responding to telemarketing efforts. Online surveys are not a substitute, since their use really requires a panel of respondents from which a valid sample of trade area respondents can be drawn. Few, if any, trade areas have such panels.

As a result, for many years we stopped doing trade area telephone surveys, yet the need for the types of data they could provide seemed to grow with the upheavals in the retail industry and the need to get a good grip on how many sales were going to online retailers. Today, in the face of that growing need, the best available solution path appears to be one framed by an analytical modesty that recognizes we will have to deal with survey data that is far less accurate than we might like. For example, it may be necessary to accept a 5%  or 10% estimate error at the 85%  or 90% confidence level. These can be maximized when the population being surveyed can be treated as finite.  Furthermore, the solution path might utilize several of these research tools:

  1. Shopper Intercept Survey. The value of these surveys depends a lot on where and when the interceptions are made and the number of interviews that are completed. The more completions the better. That number will be determined by where the interceptions are made, the length of the questionnaire, the ease of answering the questions, and the respondents interest in revitalizing/improving the downtown. Given the need for brevity –- say 10 minutes to complete the questionnaire – it will be essential to carefully select the most important questions. In the past, we limited our use of shopper intercept surveys because they seemed limited in their ability to gather all the information that a telephone survey could. Furthermore, they could not reach the trade area shoppers who did not shop downtown and obtain information from them that might help explain why. That said,  the need to get some useful data about these up for grabs shoppers has grown to the point that we are faced with the choice of either rejecting the use of any survey data or using surveys that may not have the error and confidence levels held as the acceptable standards in the past. One can argue, that if the conclusions drawn from a survey with a 7% or 10% error factor at an 80% or  90% confidence level are carefully structured, they still can be very useful analytically. The analyst is certainly in a better situation having access to such information than not having it.   
  2. Online Surveys. In a number of instances, some market segments may be known to be more important than others and merit special attention. The size of such a market segment and viable ways of contacting its members also may be known. That means that huge proportions of the relevant population, possibly even every member, can be invited to participate in an online survey. In these situations sampling is either not an issue or not a significant one. This is often very true of important segments in a downtown’s daytime population: people employed in the downtown, seniors in downtown housing and senior centers, high school students, patrons of downtown cultural venues, users of downtown transportation centers, downtown residents, etc.  
  3. Nominal Group Process (NGP).  We like this small group process because its structure prevents the discussion being dominated by a few participants and assures a useful information product will be produced at the end of the session. The NGP is able to handle 100 to 150 participants grouped in 10 to 12 tables and then the  results often can be stated in quantitative terms. However, the qualitative inputs generated by participants are usually the primary useful products.
  4. Focus Groups.  These small groups can be useful, but too often are not. They best provide qualitative information, Using them to predict market segment behaviors is ill founded, since the number of participants is usually too small to constitute a useful sample and their characteristics and recruitment are unlikely to be representative of the relevant population. If not well-led and/or are too large , focus groups can be dominated by a few individuals. However, the qualitative information they often can produce can give the analyst an understanding that simply cannot be provided by just the numerical data. They can be invaluable for generating viable explanatory hypotheses.       

SOME MORE THOUGHTS ABOUT DOWNTOWN RETAIL

GAFO E-Sales

In my retail recruitment experience, I’ve found that there are types of retail stores that clients need and those that they want. The need category generally includes groceries, specialty food shops, pharmacies, etc., while the want category overwhelmingly includes GAFO operations — i.e.,  general merchandise, clothing and footwear, home furnishings, electronics and appliances, sporting goods, book and music stores, and office supply stores. The shops that respond to needs did relatively well through and after the Great Recession, while the GAFO stores have been in consistent decline or weakness since about 2009. Recent research indicates that e-GAFO retailers are now eating the lunch of brick and mortar GAFO merchants.  

An Enormous 45% Hit on B&M Retail Sales Potentials!. One of the most significant trends that has helped define the new normals for retailing and our downtowns is the increasingly significant share of the sales of the merchandise sold in GAFO stores that are being captured by online operations. Obviously, the more sales dollars the e-stores win, the less there are for brick and mortar shops (B&Ms) to capture.

A while back, in another blog posting, I presented the above table, taken from a provocative  study by Hortacsu and Syverson,  that showed  e-store market penetration for a range of retail  categories in 2013 along with estimates of the years in which they each would reach 25%, 50%, 75% and 90% market shares.

A more recent 2019 report by Morgan Stanley suggests that the Hortacsu and Syverson study was pretty sound. It found that while “…e-commerce penetration reached 11% of total retail sales at the end of 2018”  that “e-commerce penetration in the GAFO segment”  was now over 45%.(1) That makes it so much harder for B&M GAFO retailers to survive, much less thrive, unless they are executing or part of an omni-channel marketing strategy.

The Morgan Stanley report also found that “the shift to e-commerce has hit the home-furnishings segment the hardest,” while clothing, linens and other “soft” goods have experienced a significant “e-commerce disintermediation” with a 22% e-commerce penetration expected in 2019. (2)  It was long thought that these two retail segments would be resistant to e-store penetration because one offers large and heavy merchandise and the other offers merchandise that consumers would want to touch, feel and try on. One weakness of such thinking was the failure to recognize that so many of the soft goods we buy are like commodities and we don’t need to touch them, feel them or try them on. For example, lots of people have long bought shirts, trousers, shoes, dresses, swimsuits, parkas from catalogs. They often are buying more garments like the ones they already have – e.g., I have countless blue, button down collar shirts — or replacements for them. Then, too, lots of home furnishings products are not furniture suites or otherwise prohibitively large, while others have been re-imagined – e.g., Casper Mattresses – so they can be shipped “small.” 

How Are the Leakage Analysis Data Providers Dealing With This? Frankly, I do not know the answer to this, but I think the data providers owe their customers a clear explanation of how they are handling this situation. One technique they might be using for estimating consumer demand is to take the sales of retail stores by NAICS code within a certain fairly large geographic area and then divide the sales by the number of households in that study area. That defines demand solely in terms of B&M store sales, ignoring the huge Internet sales and demand. If, instead, they are using extrapolations from BLS consumer expenditure surveys to determine demand, then they must have whopping “leakages” in each of the NAICS codes analyzed unless they also are using data on e-store sales by NAICS code.

The leakages to the Internet for GAFO store merchandise now are probably several magnitudes larger than traditionally defined leakages to B&M shops located beyond the trade area’s boundaries.

Of course, an increasing number of downtown merchants now have both a B&M shop and an e-store. Most of their e-store revenues often come from distant customers and represent “e-surplus” sales. How are these e-sales revenues included in the leakage analysis? How do leakage analysts know which e-sales come from within the B&M store’s traditional trade area from those that come from beyond it?

A growing number of retail sales are “click and collect” transactions that involve ordering online via a retailer’s server that probably is located hundreds of miles away and then picking up  the merchandise at the retailer’s local store. Are those transactions to be deemed leaked or “unleaked” sales? The local store’s involvement may be key to the sales transaction, though it may not logically be part of the monetary transaction. Would the sale have occurred if the local store were not there? If the answer is no, then somehow the role of the local shop has to be recognized in the analysis.

Vacancies, Store Closings and Openings, Changing Functions

A Word or Two About Vacancies. I fear that I’m very much an outlier, a contrarian, when it comes to downtown vacancies. While I don’t like vacant storefronts, my jockeys don’t always get in an uproar when I see them. Too often, they are not viewed from the proper perspective. Rule 1 for looking at vacancies should be to ask: where is the downtown on its revitalization arc? If it’s in the initial very troubled stages, then the prospects for recruiting really good retail tenants are not great, especially with today’s upheavals in the retail industry. Moreover, recruiting crappy tenants would be worse for the downtown’s revitalization effort than the empty shops. Also, at these early points in the revitalization process, an EDO’s scarce resources are probably better spent on working for improving the infrastructure and housing and reducing quality life issues such as the fear of crime,  than paying for very problematic efforts to recruit good retail tenants.

Rule 2 is don’t be snooty — look at pamper niche tenant prospects such as hair and nail salons, yoga and martial arts studios, etc., especially early in the revitalization process when their relatively low revenue needs and desire for low cost spaces can put them among the downtown’s best tenant prospects.

I take vacancies more seriously when the downtown is much further along on its revitalization arc. In these situations, Rule 3 is the locations of the vacancies are far more important than their number. Those that are in strategic locations such as on or near the district’s “100% corner” or near other strong assets will certainly need attention. A cluster of them is also significant and probably indicates the existence of an important underlying problem.

Rule 4 is that the downtown EDO should identify and address such underlying problems, otherwise any “fill the vacancies” recruitment program undertaken either by it or local commercial brokers will most likely yield paltry results.

In the mid-arc downtowns, Rule 5 is to determine if new downtown projects have raised landlord expectations about:

  • Their ability to attract national chains, even though they are looking for fewer and smaller spaces and have become much more finicky about their new locations.
  • Potential rental incomes to the point that their spaces are too pricey for their most likely tenant prospects, small independent merchants.

If either of the above is the case, then there’s a landlord problem, not a tenant prospect problem. This leads into Rule 6: as downtowns revitalize, erroneous landlord estimates of viable rent increases can result in more vacant spaces than diminished consumer retail demand or its associated reduced retailer demand for store spaces.

In the past, I argued that a vacancy rate of about 5% was the sweet spot for mid-arc downtowns. Some vacancies are necessary to allow for the tenant churn that can bring in new merchant blood and help keep the district vital. That still strikes me as an ideal goal. Many years ago, my real estate mentors taught me that vacancy rates above 10% indicated the existence of serious downtown problems that needed immediate identification and remediation. Well, these days, under the New Normal, it seems that a 10% vacancy rate is about average for retail spaces (3). Of course, I am not clear whether that statistic refers to all the spaces in shopping centers and malls or just to those allocated for retail tenants. Given that so many malls and shopping centers have saved themselves by bringing in non-retail tenants, I would say it probably is the former. One disturbing implication for downtowns is that, these days, a 10% storefront vacancy rate may not be all that bad, comparatively speaking. Even more unsettling for me have been the reports I’ve seen of downtown vacancy rates in the 10% to 20% range in some of our small and medium sized communities,  Another implication is that downtowns must look more to nonretail tenant prospects to fill their vacancies, but ones that are able to stimulate and reinforce pedestrian traffic on nearby sidewalks.

Because of Omni-Channel Marketing, B&M Retail is Not Going Away. One might expect that if the addressable retail markets for B&M chain stores have shrunk substantially, that lots of the stores would be closed. In fact, there have been a huge number that were closed –e.g., 7,000 just in 2017.  However, new shops are also opening and an accelerating number of them are by Internet-birthed retailers (4). For example, so far in 2019, there have been 1,674 retail chain store losings, but 1,380 store openings (5).

Today, successful retailers do not see B&M store customers as a different set from their e-store shoppers. Instead, they just see customers who they can individually reach through several channels, e.g., B&M shops, websites, social media, traditional media, etc. They know that while most consumers may still prefer shopping in B&M stores over e-stores: (6)

  • Convenience is an important driver of which shopping channel the consumer will select
  • Unless the B&M store provides an attractive shopping experience, it will not attract as many customers as its management might want.

B&M retail shops, under an omni-channel marketing strategy can play a number of functions, besides being a place where sales transactions occur, that can justify their existence:

  • SONY and Samsung, for example, have had important store locations that are nothing more than showrooms. Many other retailers use their shops as places where customers can experience the use of their merchandise. You can, for example, book a nap at a Casper Mattress Sleep Shop.
  • More and more large retailers are offering “click and collect” purchasing, e.g., Best Buy, Walmart, Amazon.
  • Some retailers are developing special store formats, e.g., Nordstrom Local, where they can provide extremely high levels of customer service to shoppers with a proven record of spending large sums in their stores.
  • Almost universally, the B&M store is seen as the venue where the retailer can best provide experiences that will strengthen their relationships with customers.
  • B&M stores also can generate website traffic. For retail chains, a new B&M store in a market area sparks “a 37 percent increase in overall traffic to that retailer’s website” by area residents. (7) “For emerging brands, new store openings drive an average 45 percent increase in web traffic following a store opening, according to ICSC research” (8).  Of course, web traffic does not mean web sales (see below).

Very importantly, B&M stores outperform e-stores in several very critical ways:

  • They have a much higher sales conversion rates (visitors who turn into actual buyers), averaging about 22.5% across all retail sectors, than the less that 3% for e-stores (9).
  • Merchandise return rates for e-stores are three to four times higher than for B&M stores, probably because e-shoppers cannot touch, feel, try on or otherwise experience the merchandise. Returns have become an enormous ball and chain on e-retailer profitability, while bad returns experiences are really ticking off e-shoppers (10).

Bottom Line: B&M retail stores are not going away, but there will be far fewer of them, they will occupy smaller spaces, and perform many new functions that justify their existence besides making sales transactions. How is your downtown planning on dealing with such a scenario?

ENDNOTES

1) https://www.morganstanley.com/ideas/us-consumer-retail-trends-2019

2) ibid.

3) https://www.nreionline.com/retail/how-many-more-store- closures-are-expected-2019

4) Ibid.

5) ibid.

6) https://www.retaildive.com/news/why-most-shoppers-still-choose-brick-and-mortar-stores-over-e-commerce/436068/  . Pew surveys have had similar findings.

7) www.nreionline.com/retail/how-should-retail-leases-account-omni-channel-transactions

8) Ibid.

9) See: http://www.comqi.com/sales_conversion_rates_more_for_physical_stores/

and https://www.invespcro.com/blog/the-average-website-conversion-rate-by-industry/

10) https://www.retaildive.com/news/shoppers-are-judging-retailers-by-their-returns-process/544740/

Some More Specifics About Small Town Entrepreneurial Environments (STEEs)

By N. David Milder

Introduction

Back in October of 2017, DANTH, Inc posted my white paper “Toward an Effective Economic Development Strategy for Smaller Communities (under 35,000)”(1).  A central concept in that strategic approach was the STEEs (Small Town Entrepreneurial Environments). I then stated that: “Though I strongly suspect that such environments exist today somewhere in the USA, to date, I have not encountered one.”  I then proceeded to outline what I then thought the major components of s viable and effective STEE might be. Since then, I have done additional research and visited and worked in a number of smaller communities and learned a good deal more about possible STEE components. The objective of this article is to detail those recent findings.

Viewing STEEs as Informal Business Incubators.

For a number of years now, I have been arguing that small town downtowns could be informal business incubators. My recent work made me realize that STEEs function much like informal business incubators. They are informal in the sense that all the elements of a business incubator are not in one building operated by an organization tasked to do incubation. Instead, they are dispersed within a downtown in different locations, and each may have a separate management organization. An interesting blog post by Jim Metcalf on the SCORE blog argues that incubator functions may be  spread beyond the downtown and be found in the whole small town (2).

Formal business incubators have long been a fairly widely adopted economic development tool. I would argue that they will always have a vital  role to play for firms that have substantial growth aspirations, that yearn to be big in terms of revenues, profits and employees, that want to be the next Apple, Facebook or Amazon. However, that usually means that the formal incubator will nurture a relatively small percentage of the businesses in a smaller community. For example,  the well regarded Wyoming Technology Business Center operates incubators in the cities of Laramie,Sheridan and Casper and:

TABLE 1

  • In Laramie ,the incubator has 8 clients and there are 657 residents who are self-employed, but have unincorporated businesses in the city (see Table 1).
  • In Sheridan, the incubator also has 8 client sand there are 340 people who are self-employed, but have unincorporated businesses in the city.
  • In Casper, the incubator has 12 clients and there are 1,567 people who are self-employed, but have unincorporated businesses in the city.

Informal incubation functions can help the micro and very small businesses that are usually fairly numerous  even in smaller towns, as is evidenced in Table1. Their operators very often have more modest aspirations, mainly focused on how to have more stable and/or higher annual personal incomes and the steps that might help them to achieve those goals.

Many of these micro business operators work from their homes.  Back in the 1990s,  these home-based operators were not deemed of interest by many economic development experts, because it was thought that their numbers were few and that they seldom if ever hired any employees. More recent research, however, suggests that their numbers are far from insignificant and, at least in some instances, can be very significant (3). As Dave Carlson, the administrator of Lancaster. WI, has noted, these micro businesses, in aggregate, can equal the number of jobs provided by his town’s largest employer. Also, recent research indicates that these home-based entrepreneurs may indeed hire some employees (4).  

My recent work in a few smaller communities in Upstate NY confirms Metcalf’s view – the towns had many incubator components, and many were frequently being performed in the town, but not in the downtown. The downtown obviously will be stronger if it’s the location where the vast majority of these functions are performed.

STEEs Do More Than Micro and Very Small Business Incubation

STEEs are very much related to the nurturing of creative endeavors within our smaller communities. However, they can also be a huge asset in the retention of a town’s current creatives and the attraction of more of them from other towns and cities. Those in large central cities within a 2.5to 3.0 hour drive are where the best prospects now live and work.

As I have demonstrated in several other articles and as noted in a recent article in the New York Times, a significant number of big city creatives are being drawn to rural local communities either as second homeowners or in complete, year round relocations (5). These relocations are being motivated primarily by quality of life considerations. While many create new jobs in their new towns, others bring their old jobs with them or create new jobs because the local broadband pipe allows them to telecommute. More affordable housing , a lower cost of living, family, great scenery, and a stronger sense of community are other Q of L lures.

Table 2, below, presents 12 STEE functions that are in bold and underlined type. The more of them that are present in a town, the stronger will be the town’s ability to attract and retain creative enterprises. The more of them that are in the downtown, the stronger it will be economically. Under each function are “tools” that can be used to perform that function. Here, the question is not how many can be used, but the strength with which they perform. Better to have one thing that really works than several of marginal utility. Yes, it’s better still to have several that really work well.

TABLE 2

Many town and downtown STEE assets are not recognized or properly appreciated by local leaders. This matrix can be used by downtown leaders to assess their STEE assets.  This should help them to then determine:

  • The elements they may want to think seriously about adding.
  • How the existing elements can be organized so that they are better known and more easily utilized.
  • How these STEE assets can be marketed to attract more creatives to move and do business in the community and the downtown.

The matrix includes such typical incubator functions as providing a work space, technical assistance for business operations (e.g., marketing, bookkeeping, human resource management, etc.), networking opportunities, and help with financing. It also includes such things as affordable housing, accessible broadband, and an existing cluster of creatives – important factors in recruiting creatives. Additional elements listed are the presence of an organization tasked to maintain and grow the STEE and someone to manage the provision of technical assistance. Downtown EDOs have typically avoided like the plague the latter two types of endeavors, but one may reasonably argue that, under the new normal, cultivating a strong, vibrant STEE will need to be a growing part of their missions.

Some Observations About Specific Types of STEE Components

While in the past few years I have come across some co-worker spaces and a few incubators that are located in in small towns, they were not the STEE components that impressed me the most. Here are some that impressed me as being far more important.

Libraries. In more and more small towns, the public library has become – or is becoming – an anchor component for its STEE.Libraries are changing big time. As one blog has described it, many libraries are now  “in the process of transitioning from a content collection-only facility to a content creation-inspired makerspace” (6). Not only do they provide spaces where “makers,” a term that is often broadly defined, can meet, learn from each other, and network, but they also provide a wide range of equipment the makers can use in the library. A few are even assembling an inventory of maker “kits” that are loaned out to makers for their use off site. Some librarians are arguing that libraries need to become “creative spaces.”

The Phillips Free Library in Homer, NY (pop 6,200) is a good example. It has two writers clubs, a film making club and a significant Makerspace, filled with a lot of equipment (see Table 3).

TABLE 3

Arts Coops. In many of these small towns there are a fair number of artists and artisans. Few are likely to get all their incomes from their artistic endeavors, so many will need additional employment. As one artist in Small Town X told me, and several of his artist friends then concurred: “Small Town X is a great place for artists – except for those who want to earn a living.”

Most lack business related skills and want help in marketing and getting exposure. Unfortunately, it is often difficult to get these small town artists and artisans the technical assistance they need and often want because the assistance  simply does not exist and/or the artists’ great need for independence, that they share with other small businesspeople, makes them resistant consumers.

In these small towns, getting say 20 artists and artisans the technical assistance they need may be a daunting and resource burning task.For that reason, coops are an appealing concept. When they are functional, they substantially diminish the needs of the participating artists for technical assistance. The coop can handle a lot of an artist/artisan’s marketing and bookkeeping needs, while creating a social network among the coop members.  

However, coops are often unstable and short-lived. In recent months I have found one that closed, another that was reorganized and a third that appears to have some long-term stability. Even the venerable Torpedo Factory in Alexandria, VA, had a recent organizational and financial crisis. Someone, who was involved there on the management side, noted that managing artists was like trying to herd cats. Coop leaders very likely to face a similar challenge.

The questions that comes to my mind are:

  • Can the management of a coop be improved more easily, efficiently and effectively than improving the business-related skills of their 15 to 30 artist/artisan members? Getting them to individually attend an eight-to-ten month course comprised of four 10-hour workshops and up to six two-hour interim sessions, as a highly regarded program in Montana does, requires a significant amount of commitment from the artists/artisans.
  • The Montana program is indeed interesting and useful, as well as a model for similar efforts in other states. In Montana, it has improved the entrepreneurial skills of 400+ artists over 5 years, resulting in impressive increased net sales of 397% with a 44% increase in out-of-state sales, on average, since participating in the program. Nevertheless, I still find myself asking: could the development of a program aimed at making coops more successful be a cheaper and more productive way of meeting the technical assistance needs of artists and artisans (7)?    

I do not know of anyone who has addressed the question of how to make arts coops more stable and successful. Someone perhaps should take a stab at it.

 Vendor Marts. I have long been familiar with antiques malls, but somehow vendor malls, their kin, had not been on my radar until I recently came across one in a smaller community in Upstate NY.  However, I had seen one in a downtown in NJ a few years ago that was being pitched as a retail incubator in the owners attempt to win support from the downtown’s EDO and city officials.

Indeed, my recently aroused interest in vender malls is precisely because of their incubation and STEE  capabilities:

  • They provide small, maybe about 150 SF,  and comparatively affordable spaces, maybe about $2,700/yr,  for aspiring retailers, artists and artisans.
  • The vendors must “mind the store” and be behind the cash register for at least a few days a month, so they can get some retail experience. For many artists and artisans, whose primary concern is creating, not selling, this can be a very attractive feature.
  • Vendors that do well then can “graduate” and lease a regular storefront elsewhere in the downtown or town. The vendor mall I recently visited in Upstate NY had just had such a graduate.

Any competent downtown EDO should be able to set up a vendor mart in an empty storefront. It could increase the incubation capabilities of the vendor mart by helping the vendors learn about available technical assistance providers and then helping the vendors to connect with the TA providers. Of course, if the downtown already has a vendor mall, it could similarly increase their incubation capabilities.  

Project Generated Local Investment Groups. A few years ago, in the twin cities of Scottsbluff and Gering in Nebraska, I came across informal investment groups that were formed within the local business community. One such group, for example, has helped the development of a new hotel in downtown Gering. I recently heard of similar type group being formedt o help fund the significant expansion of a local craft brewery in a smaller community also located in Upstate NY. The town may well have lost the craft brewery had not the local investment group emerged and taken action.

These groups usually are formed in response to a public need that has been identified by local officials or by well-known private sector needs.   

Opportunity Zones (OZs). Recent congressional action has significantly increased the capital investment incentives that can be offered in OZs.  While many in the economic development community are waiting to see how those incentives are used and the positive impacts they produce, there now is a hopeful optimism that those incentives can be powerful.

I have come across a number of downtowns that are entirely or partially covered by OZs, but do not tout them very much. Perhaps their new incentives are just too new for local leaders to figure out how they can be used. It also may be that the incentives go to Qualified Opportunity Zone Funds:

“A Qualified Opportunity Zone Fund is any investment vehicle which is organized as a corporation or a partnership for the purpose of investing in qualified opportunity zone property (other than another qualified opportunity fund) that holds at least 90 percent of its assets in qualified opportunity zone property (8).”

Many REITs and other commercial real estate investment funds are making OZ investments. For smaller towns to attract these big time investors, they will have to market the opportunities offered in the OZs  and compete for the available investment dollars.

Might it be better to have the local residents and businesspeople who participate in the informal investment groups form their own QualifiedOpportunity Zone Fund?  

Some Final Comments

Since I published the white paper I have been repeatedly impressed by what I have found in the smaller towns I have visited and read about. (See especially: “Our Towns: A 100,000-Mile Journey Into the Heart ofAmerica” by Deborah Fallows and James Fallows). I certainly recognized that they have significant challenges, but I also found a large number of capable and inventive people and capable organizations. Together, they are often building communities rich in their quality of life, if so far not in household incomes and corporate profits. There are often substantial human, organizational and economic resources in these communities that go unnoticed by outsiders and locals alike. Rather than disappearing, I expect that within the next 10 years or so our smaller communities, especially those within a three-hour drive of a major city, will become “hot” and attract many new residents and jobs. And that’s the view of a dyed in the wool New Yorker, who may like to visit smaller towns, but would never live fulltime in one – unless he has to.  

Endnotes

1) See: https://www.dropbox.com/s/tnwdomfzwrkv5i1/White-Paper-Toward-an-Effective-Economic-Development-Strategy-for-Smaller-Communities-1.pdf?dl=0

2) Jim Metcalf. “Small Towns as Business Incubators.” SCORE Blog, March 29, 2018. https://www.score.org/blog/small-towns-business-incubators

3) “According to the 2012 GlobalEntrepreneurship Monitor (GEM) Report, 69 percent of all businesses are started from home and 59 percent are still operating from their homes three years later. Additionally, ‘only one-fourth of the entrepreneurs surveyed stated they had no employees working for their businesses. Given the high prevalence of entrepreneurs operating at home (two-thirds of Total Entrepreneurial Activity),this finding suggests that many actually had employees in their home-based businesses.’” Melissa Davidson. “FOCUSING ON HOME-BASED BUSINESSES: The Forgotten Sector. IEDC EconomicDevelopment Journal,  Volume 17 / Number 1/ Winter 2018, pp.11-18, p 11.

4) Ibid.

5). N, David Milder,  “Quality-of-Life Based Retail Recruitment: CommunitiesWith Populations Under 35,000,” IEDC Economic Development Journal,  Volume 16 / Number 3 / Summer 2017. Seealso:  Brooke Lea Foster. “Forget theSuburbs, It’s Country or Bust  “ New York Times, Dec. 14, 2018    https://www.nytimes.com/2018/12/14/realestate/forget-the-suburbs-its-country-or-bust.html

6) There’s even a librarian guide to makerspaces. See: https://oedb.org/ilibrarian/a-librarians-guide-to-makerspaces/

7) For the Montana program see: https://art.mt.gov/map. “Artists in the program (2009-2014) report increased net sales of 397% with a44% increase in out-of-state sales on average since participating in the program, proving that the program works. The Montana Artrepreneur Program has earned national acclaim and has impacted nearly 400 artists across Montana.” “FY2019Activities

8) See:  https://www.wellsfargo.com/the-private-bank/insights/planning/wpu-qualified-opportunity-zones/

Downtown Tourism: Boon or Bane?

By N. David Milder

Introduction

As my years spent in the downtown revitalization field increased, I gradually realized that I unconsciously had been working with the view that bigger and better defined a successful downtown. With time, I also realized –perhaps in an embarrassingly late fashion — that making a downtown better was much more important than making it bigger. Indeed, for many communities, a bigger downtown would essentially change the whole character of the town.

As I came to realize that better was more important than bigger, I also began to think more critically about tourism. Downtowns large and small are often lured into economic growth strategies with large tourist attraction components. NYC’s mayors and economic development agencies, for example,  for decades have targeted tourist growth and lauded how many millions are attracted annually, how much money they spend, and how many jobs they generate. Smaller communities, especially those in rural areas, often see tourism as a major way to overcome the small populations and low consumer spending power in their market areas. It is often seen as a way to strengthen a Main Street’s retail shops. Well regarded organizations that work to support Main Street and downtown revitalization often suggest increasing tourism as a viable component of an economic growth strategy – as do many economic development consultants. Unfortunately, tourism can be a two edged strategic sword, a boon or a bane – or even a boon and  a bane. In my experience, too may downtown andMain Street leaders leap at a tourist growth strategy without properly thinking through its possible drawbacks as well as its advantages

Some Boons and Banes

The Character of the Community. Over the past year, several articles have appeared that indicate that I am far from the only one who is concerned about what is, for me, the worst  possible drawback about tourism: that too many tourists can change the character of a downtown and/or the community in which it is located. For example, the November 18, 2018 edition of the Washington Post had an article headlined:

“DETOURING. Top world destinations are overrun. Take our suggestions for roads not taken.”

Earlier in the year, the German newspaper Der Spiegel noted that European tourism officials were reporting frequent problems of “overtourism,”where too many tourists and/or unacceptable tourist behavior threaten to severely diminish the very attractions that lure the tourists.  In response, local officials:

“…want to redirect the streams of tourists, as officials in Rome are trying to do, or even to limit them, as Dubrovnik is doing. Barcelona is no longer approving new hotels, Paris has strictly regulated Airbnb and other apartment?rental platforms….(1)

Nicole Gelinas, in a very thoughtful article in the City Journal, has argued that:

“While much of this change ( increased global travel) is positive in economic terms, the ongoing invasion of global cities by people who stay for a few days or a few weeks can fundamentally transform the character of places whose unique charms are what attracted tourists in the first place.” (2)

Gelinas goes on to argue that in the West’s central cities, tourist pedestrian behavior has changed their character:

“Central­ city sidewalks designed decades or centuries ago can’t handle today’s foot traffic, particularly when people don’t walk like the local commuters and residents of decades ago did.Today’s pedestrians walk slowly, several abreast, stop frequently to take photos or look at maps on their ever­ available phones, and wheel bulky luggage behind them, ensuring that fast walkers can’t pass. Tourists to a large extent have become the central cities.” (3)

Unhappily, Yogi Berra’s quip that “nobody goes there anymore, it’s too crowded” is increasingly applicable to many of our most attractive city centers, public spaces  and arts venues. Can you really appreciate the Mona Lisa at the Louvre if you are standing 50 feet away in a dense crowd (while few are looking at the marvelous Raphael’s and Titians nearby?) Or appreciate an exhibition at NYC’s MoMA in rooms packed like a sardine can, but with people and no olive oil? Most visitors to both museums are tourists – 75% at MoMA, 70% at the Louvre.

Many NYC residents stay away from Times Square because it is too crowded, filled overwhelmingly with tourists and passé attractions – we no longer feel it is one of “our” places. It is this ability of overtourism to make local residents feel dispossessed that is most troubling.

Sadly, too,  problems being caused by tourism are not confined to large central cities. In smaller towns, it is tourism’s insidious ability to make local residents feel dispossessed that is perhaps even more troubling, because a strong sense of community is what so many residents cherish about living in them.  I have run into small town residents who feel that way in a number of communities such as Montauk, NY, Chatham, MA, and Lambertville, NJ.  Montauk used to be known as the Hampton’s blue collar community, a great, affordable place that middle income folks could go for terrific fishing, attractive beaches,  and some good, if funky, eateries. Today, it is the pricey summer recreational town for affluent hipsters. The whole tone of the town has changed.  

In a very useful article, Tomoko Tsundoda and Samuel Mendlinger looked at the economic and social impacts of tourism on the small and very attractive town of Peterborough, NH( 4). They showed that there long has been an awareness of  a number  of wide ranging impacts, both good and bad, that tourism can have. On the positive side are:

  • Increased jobs
  • More  business opportunities
  • More interesting shops and entertainments
  • Heightened demand for local housing and commercial properties
  • More tax revenues

On the negative side are:

  • Loss of the community’s character
  • Higher retail and restaurant prices
  • Higher housing prices
  • Businesses favoring tourist patrons over local resident patrons
  • Low-paying or unsustainable new jobs
  • Increased traffic and poorer air quality
  • More quality of life crimes

One of their most concerning findings was that wealthy families and working families may view the benefits of tourism quite differently.

Much can be said about each of the above impacts, but that would take a far longer article than this one. My key point here is that downtown leaders who are thinking about avidly pursing a tourist growth strategy should carefully assess these potential impacts on their communities.

Tourism as a Strategy to Improve a Downtown’s Retail

I do want to do a bit of a deep dive here because in recent years I have so often heard this argument offered by downtown leaders  to explain why a tourist growth strategy should be developed.


I would say that,  in my experience, almost invariably when clients and client prospects have suggested pursing tourist growth, their primary reason for doing so is to improve the downtown’s retail.  To put the potential benefits in some perspective, it is useful to look at how much of tourist spending goes to retail, see the table above. It shows that, for example, tourists in NY spent about $64 billion in 2016, but only about 9.9% of this hefty amount went for retail. Expenditures for recreation and entertainment were slightly larger 10.0%,while expenditures for food and beverages was much higher, 23.7%. All of these expenditures can help the types of merchants that downtown can attract – if there are those types of shops already present or if the tourist spending potential is large enough to spark their development. In many instances, these types of operations do not exist, and the tourist spending potential is not sufficient to stimulate their creation. Retail in MS accounts for a seemingly impressive 26% of tourist expenditures, but this is partially due mathematically to the extremely low expenditures for recreation and entertainment. In NC, on the other hand, tourist spending for retail rivals, in absolute dollars, those expenditures in NY, and surpasses it on a percentage basis, 20.2% to 9.9%. In NC, the percentages of tourist spending that go for both recreation-entertainment and food and beverages are relatively low, but the level of absolute dollars spent does suggest that retail merchants in that state are rather good at capturing tourist dollars.

The above table shows the percentages of tourist spending that went for food services, retail and recreation in 11 multi-county regions in PA in 2016.Retail  accounted for a lower percentage of tourist spending than food services or recreation. The highest percentage for retail expenditures among the 11 regions was 18% and the lowest was 12%.

My observations over many years suggests that towns with strong tourist sales all have strong retail offerings: outlet centers (e.g., Manchester, VT), major urban retail streets like Fifth Ave, Rodeo Drive, Michigan Ave, or ritzy tourist havens where lots of rich people have 2nd, 3rd or 4th homes (e.g.,East Hampton, Bal Harbor, Palm Beach).

Unique offerings in the other towns can indeed sell, but I hear more about how they can sell than I see merchants actually doing it.

In the towns most downtown leaders would want to emulate,  quality merchandise is offered to tourists in attractive and often charming shops.  Unfortunately, there are also towns that are tourist nightmares. I shall refrain from mentioning any of them, but they are usually busy, gaudy, and filled with a lot of shlock merchandise. As with obscenities, you know them when you see them.   

Suggested Take Aways

The above leads me to make the following observations:

  • Most downtowns should not expect tourism to be the savior of their retailing. Retail expenditures will probably typically account for only 10% to 20% of local tourist spending. Tourism can provide local retailers with the equivalent of the  whipped cream and cherry on top of a sundae, but not the two scoops of its ice cream.
  • Attractive local hotels and restaurants are likely to capture most local  tourist expenditure dollars.  Is a tourism growth effort worth it if those types of enterprises are by far the primary beneficiaries?   
  • Crappy retail shops selling crappy merchandise will usually not capture many tourist dollars.But the real danger is that, if there is a lot of such shops, they just will attract a lot of crappy tourists. This can create town – tourist problems.
  • The major retail needs in many smaller communities are grocery stores, pharmacies, a hardware store, etc., the types of neighborhood retail that tourist expenditures are unlikely to support. If tourist focused retail is dominant, and these needs are not met, then some hairy town –retailer/tourist problems can emerge.
  • To attract lots of tourists, your town needs to be well-located and accessible. If you do not have significant levels of auto traffic now, or strong nearby scenic magnets, assume that you probably cannot quickly build a base of local tourist attractions that will significantly increase the flow of tourist customers.
  • To succeed you probably need enough local attractions to keep tourists in your downtown for four times the length of time it took them to travel there.  Your downtown needs some real there, there.      
  • If there are significant tourist flows nearby and your downtown is not capturing significant traffic from them, correcting that should be the first order of business of any tourism development program.
  • Tourism that endangers the community’s character is never worth it. Why kill the goose that’s laying golden eggs?
  • Yet, tourism certainly can be beneficial for a downtown. Programs to attract more tourists should be thoughtfully designed, with an eye on possible emerging problems, not just a look at potential financial gains for local businesses and residents.

ENDNOTES

1. Der Spiegel staff. “Paradise Lost: How Tourists Are Destroying the Places They Love.”  Spiegel Online.  http://www.spiegel.de/international/paradise-lost-tourists-are-destroying-the-places-they-love-a-1223502.html . Posted: 08/21/2018 01:20 PM

2. Nicole Gelinas. “Planet Travel. Globalization has created a tourist boom in world cities—but masses of tourists create new challenges.” City Journal. August 31, 2018. https://www.city-journal.org/html/global-tourism-16143.html

3.Ibid.

4.Tomoko Tsundoda and Samuel Mendlinger, “Economic and Social Impact of Tourism on a Small Town: Peterborough New Hampshire.”  J. Service Science & Management, 2009, 2: 61-70
Published Online June 2009 in SciRes (www.SciRP.org/journal/jssm)