Since I started working on downtown revitalizations there have always been ogre-like competitors that local merchants see as the primary threats to their financial well-being. First, it was the department store anchored regional malls, then the catalog mail-order operations, which were followed by the big box value retailers. Most recently, e-retailers such as Amazon, are seen as the primary competitive threat. Consequently, I decided to try to assess, as best I could from available data, how strong a threat e-retail has become. My objective was not to be definitive, but to come up with ballpark numbers that would show the dimensions of this impact.
Some Relevant Data
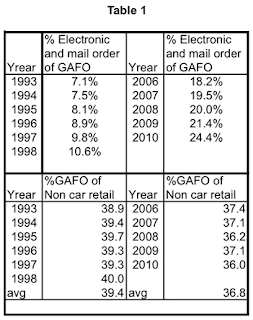
But, did the NAICS 4541 nonstore sales take sales away from the GAFO merchants? Between 2006 and 2010 NAICS 4541 merchants grew steadily from the equivalent of 18.2% of GAFO sales to 24.4% of GAFO sales or from $202.6 billion to $276.2 billion, while the actual levels of annual GAFO sales in trillions were $1.113, $1.148, $1.144, $1.098 and $1.1320, with a 1.6% net increase over the period. In other words, while the NAICS 4541 had strong growth, there was fluctuation, but no real major erosion in GAFO sales.
The bottom part of Table 1 covers the same time periods, but it shows the proportion of non-auto-related retail sales that GAFO sales account for annually. Both e-retailing and mail order houses as well as GAFO stores are included in the total non-auto-related retail sales figures. So are groceries, supermarkets and pharmacies. Between the two time periods there is a definite drop in GAFO’s share of non-auto-related retail sales:
- The peak, 40% was in 1998, the low point was in 2010 at 36%
- The average for the 1993 to 1998 period was 2.7% higher than the average for the 2006 to 2010 period.
These fall offs certainly might be considered as indicators of the sales e-retailers took from the GAFO merchants. If these are valid indicators, then the numerical impacts may not seem large, but events have shown that a 3% to 4% drop in sales can take the wind out of any retail sector.
However, other factors were also present during this time period that could account for the reduction in GAFO sales. For example, as the Great Recession manifested itself, GAFO expenditures, especially for big ticket items, were where consumers cut quickly and deeply, while expenditures for food for the home and health and personal care items grew.
Furthermore, GAFO includes some of the nations largest and strongest retail chains such as Walmart, Target, Home Depot, Best Buy, Macy’s, Saks Fifth Avenue, etc. They are not only strong brick and mortar competitors, but also have developed very strong and elaborate online stores. Many smaller GAFO chains and some independent operators have followed suit. Unfortunately, the GAFO data does not provide sufficiently detailed information to look into these issues.
Reviewing these data I am inclined toward the following conclusions:
- E-retailers have had much more impressive growth than the Census Bureau’s e-commerce data would suggest. The proper benchmark is not all retailing that includes auto dealers, supermarkets and drugstores, but GAFO merchants. The latter sell the department store type merchandise that downtown leaders would like to have available in their districts, though many downtowns are just too small to have numerous GAFO shops.
- Pure play e-retailers have knocked out many, if not most, book and recorded music stores, but broad swathes of GAFO brick and mortar merchants remain.
- Though some erosion among other GAFO segments has likely also happened, it probably has involved marginal firms that were already poor competitors and/or could not develop significant online presences. Large firms fall into this group — think Borders, Circuit City, Blockbuster — but smaller firms with few financial and skill resources are more prone to having such vulnerability. Of course, many of the GAFO operations in our small and medium-sized downtowns fall into this category.
- Many of these small marginal downtown GAFO firms would still be marginal if the e-retail threat did not exist. They have always been there in the 35+ years I have been working in downtowns. The thing that has changed over time is the nature of the threat.
- My reading of various articles indicate that to date, the pure play e-retailers have not captured many sales in the auto, grocery, health and personal care sectors. These often have a strong presence in or near downtowns and are usually where a small or medium-sized downtown’s strongest retail market potentials reside.
- E-retailing’s biggest impact is not the “constructive destruction” of most brick and mortar merchants, but in changing what it means to be a retailer: retailing now has an electronic as well as a brick and mortar component.
- This means that many small downtown GAFO operations will have to “innovate” by either having their owners/managers learn new internet related skills or by hiring outsiders who have them. This is a strong challenge, as I outlined in my previous blog posting, that admonishments to get on the web alone cannot address.
- If the current operations of these GAFO retailers are badly managed — a likely condition if they are marginal — it is unlikely that they will either acquire the necessary skills or be saved if they do.
What do you think?
N. David Milder
